. 2023 Dec;9(48):eadi0508.
doi: 10.1126/sciadv.adi0508. Epub 2023 Dec 1.

Genetically engineered transfusable platelets using mRNA lipid nanoparticles

Affiliations

Genetically engineered transfusable platelets using mRNA lipid nanoparticles

Jerry Leung et al. Sci Adv. 2023 Dec.

Abstract

Platelet transfusions are essential for managing bleeding and hemostatic dysfunction and could be expanded as a cell therapy due to the multifunctional role of platelets in various diseases. Creating these cell therapies will require modifying transfusable donor platelets to express therapeutic proteins. However, there are currently no appropriate methods for genetically modifying platelets collected from blood donors. Here, we describe an approach using platelet-optimized lipid nanoparticles containing mRNA (mRNA-LNP) to enable exogenous protein expression in human and rat platelets. Within the library of mRNA-LNP tested, exogenous protein expression did not require nor correlate with platelet activation. Transfected platelets retained hemostatic function and accumulated in regions of vascular damage after transfusion into rats with hemorrhagic shock. We expect this technology will expand the therapeutic potential of platelets.


Figures

Fig. 1.
Fig. 1.. Platelets transfected with mRNA using LNP can express exogenous protein.
(A) Schematic describing the transfection of platelets using mRNA-LNP. (B) NanoLuc expression, measured as the relative luminescence units (RLU) per total protein, using various transfection agents (n = 3). (C and D) Representative flow cytometry plots and quantification of median fluorescence intensity (MFI) (bars, left y axis) and percentage of platelets (red circles, right y axis) positive for Cy5-labeled mRNA (C) and platelet activation marker CD62P (D). The vertical dashed lines represent the MFI, and the arrows (top) represent the gate for positive events (n = 3). P values were determined by one-tailed unpaired Student’s or Welch’s t test. Values are mean ± SEM. ns, not significant; *P < 0.05. A.U., arbitrary units.
Fig. 2.
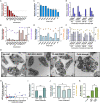
Fig. 2.. Luciferase expression and platelet activation depend on lipid composition and mRNA base modifications.
(A to F) Relative NanoLuc expression and platelet activation, respectively, with (A and B) various ionizable lipids, (C and D) helper lipids, and (E and F) combinations of select ionizable and helper lipids (n = 3). (G) Transmission electron micrographs of washed platelets (WPs) without LNP (no LNP), treated with mRNA-LNP (ALC-0315 DOPC and CL4H6 POPC) and stored at 4°C (cold storage). Scale bars, 500 nm. (H) Correlation between the NanoLuc expression in MEG-01 cells and platelets. Colors represent screens of ionizable lipid (red), helper lipid (blue), combinations of ionizable and helper lipids (purple). (I and J) Relative NanoLuc expression (I) and platelet activation (J) with unmodified uridine base [uridine 5′-triphosphate (UTP)] or the uridine base modifications 5-methoxyuridine (5moU) or pseudouridine (Ψ) (n = 3). All values were normalized to MC3 DSPC (dashed line). (K) Relative firefly luciferase expression normalized to MC3 DSPC. P values were determined by one-tailed unpaired Student’s t test. Values are mean ± SEM. **P < 0.01; ***P < 0.001.
Fig. 3.
Fig. 3.. Expression of exogenous protein does not correlate with activation nor extent of mRNA uptake.
(A and B) Pearson correlation matrix between relative NanoLuc expression, mRNA uptake, and platelet activation (A) with corresponding three-dimensional plot (B). (C and D) The data from (A) and (B) are replotted in two-dimensional graphs. Correlation between NanoLuc expression and mRNA uptake (C) and platelet activation (D). The dashed lines represent MC3 DSPC. Colors represent screens of ionizable lipid (red), helper lipid (blue), combinations of ionizable and helper lipids (purple), and DMG-PEG2000 content (green). (E and F) Relative NanoLuc expression in the platelet pellet (E) and supernatant (F) following stimulation with agonists of platelet activation. All values were normalized to CL4H6 POPC treated platelets without agonists, represented by the dashed line (n = 3). P values were determined by one-way analysis of variance (ANOVA). Values are mean ± SEM. **P < 0.01; ****P < 0.0001.
Fig. 4.
Fig. 4.. Platelets treated with LNP maintain their ability to activate and contribute to the growth and firmness of blood clots.
(A and B) Platelet activation without agonists or stimulation by ADP, CRP-XL, or thrombin, as measured by the MFI of surface CD62P levels (A) and percentage of platelets positive for surface CD62P (B). (C) Representative ROTEM curves, with clotting initiated by ellagic acid (n = 3). The red shaded region is the area between whole blood (WB) and diluted WB (DWB) without the additional transfusion package (TP) added. (D to G) Quantifying ROTEM clot formation time (s) and maximum clot firmness (mm), for clotting activated with ellagic acid via the intrinsic pathway (C and D) or thromboplastin via the extrinsic pathway (E and F). The dashed lines represent firmness of WB (dark red) and DWB (light gray). P values were determined by one-way ANOVA. Values are mean ± SEM. *P < 0.05; **P < 0.01.
Fig. 5.
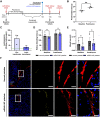
Fig. 5.. Rat platelets transfected with mRNA-LNP and transfused into rats circulated, accumulated at damaged vasculature in wounds, and contributed to hemostasis.
(A) Overview of the transfusion procedure. Timeline not drawn to scale. (B) Prothrombin time in WB collected from rats receiving normal platelets before trauma (baseline) and posttrauma (n = 3). (C) NanoLuc expression in mRNA-LNP–treated platelets before transfusion and 10 min posttransfusion into rats (n = 3). The green dashed line represents the luminescence of the pretransfusion platelets after correcting for the predicted dilution factor of transfusing into the bloodstream. P values were determined by one-tailed unpaired Student’s t test. Values are mean ± SEM. (D and E) Kidney bleeding times (D) and blood loss (E) of rats transfused with platelets transfected with mRNA-LNP (mRNA-LNP platelets, purple) and platelets not transfected (normal platelets, gray) (n = 3). (F) Representative histological images of lacerated kidneys. mRNA-LNP–treated platelets contained a fluorescent lipid in the LNP (DiI, yellow). Sections were stained with an antibody for platelet CD61 (red) and a nuclear stain [4′,6-diamidino-2-phenylindole (DAPI), blue]. Scale bars, 20 μm.

References

    1. J. M. Jones, M. R. P. Sapiano, A. A. Savinkina, K. A. Haass, M. L. Baker, R. A. Henry, J. J. Berger, S. V. Basavaraju, Slowing decline in blood collection and transfusion in the United States – 2017. Transfusion 60,Suppl 2, S1–S9 (2020). - PMC - PubMed
    1. P. E. J. van der Meijden, J. W. M. Heemskerk, Platelet biology and functions: New concepts and clinical perspectives. Nat. Rev. Cardiol. 16, 166–179 (2019). - PubMed
    1. X. R. Xu, D. Zhang, B. E. Oswald, N. Carrim, X. Wang, Y. Hou, Q. Zhang, C. Lavalle, T. McKeown, A. H. Marshall, H. Ni, Platelets are versatile cells: New discoveries in hemostasis, thrombosis, immune responses, tumor metastasis and beyond. Crit. Rev. Clin. Lab. Sci. 53, 409–430 (2016). - PubMed
    1. L. J. Gay, B. Felding-Habermann, Contribution of platelets to tumour metastasis. Nat. Rev. Cancer 11, 123–134 (2011). - PMC - PubMed
    1. J. Johnson, Y.-W. Wu, C. Blyth, G. Lichtfuss, H. Goubran, T. Burnouf, Prospective therapeutic applications of platelet extracellular vesicles. Trends Biotechnol. 39, 598–612 (2021). - PubMed