. 2023 Dec;9(48):eadj3793.
doi: 10.1126/sciadv.adj3793. Epub 2023 Dec 1.

Early life adversity shapes social subordination and cell type-specific transcriptomic patterning in the ventral hippocampus

Affiliations

Early life adversity shapes social subordination and cell type-specific transcriptomic patterning in the ventral hippocampus

Aron Kos et al. Sci Adv. 2023 Dec.

Abstract

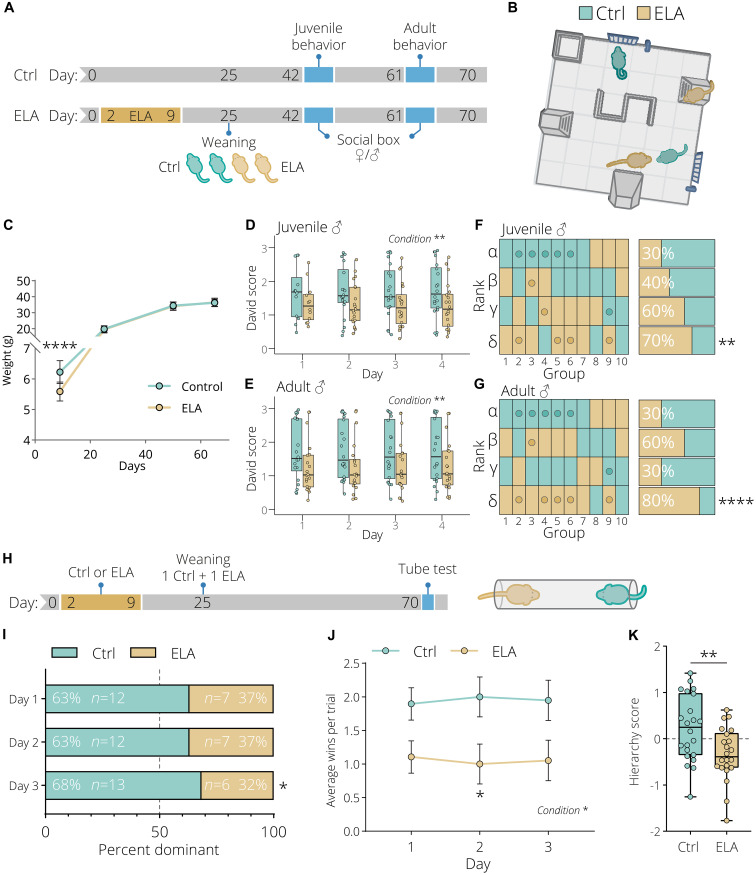
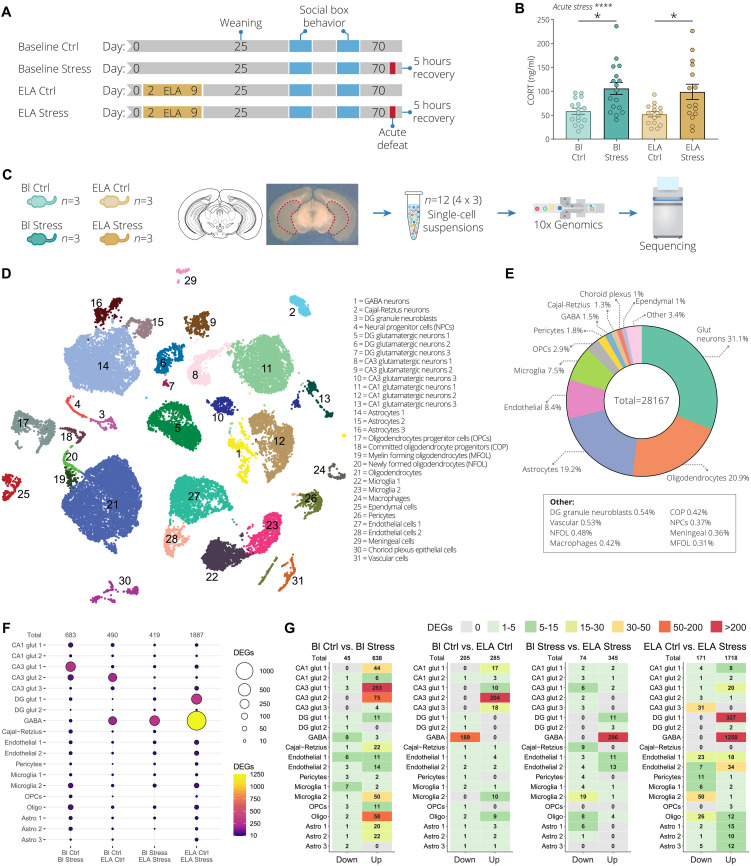
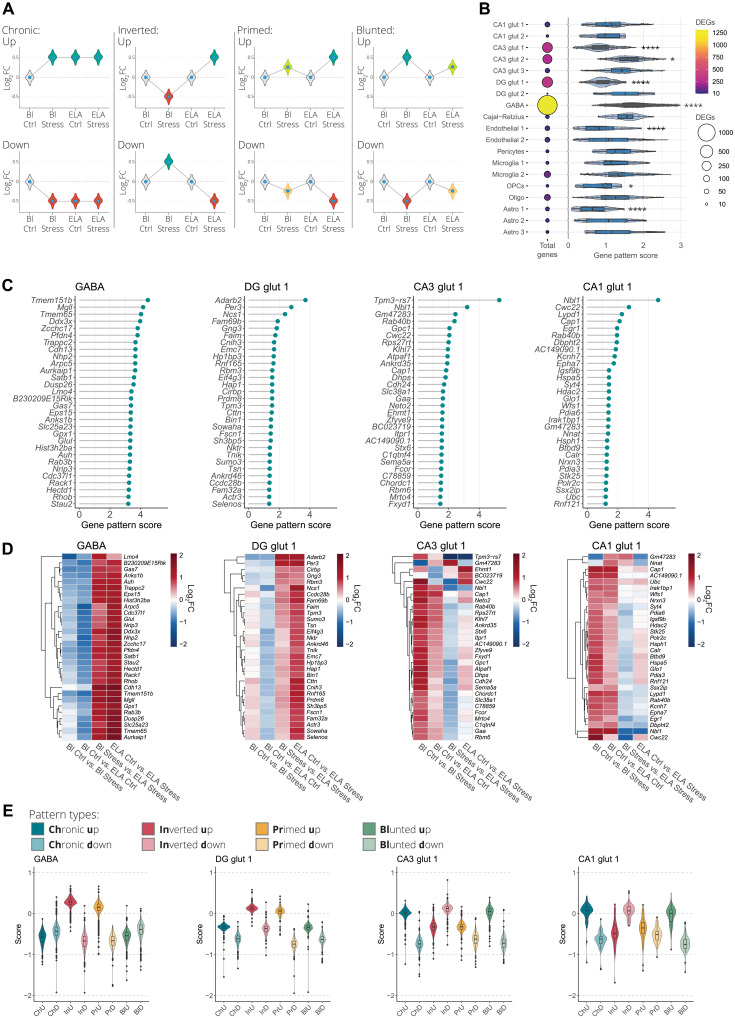
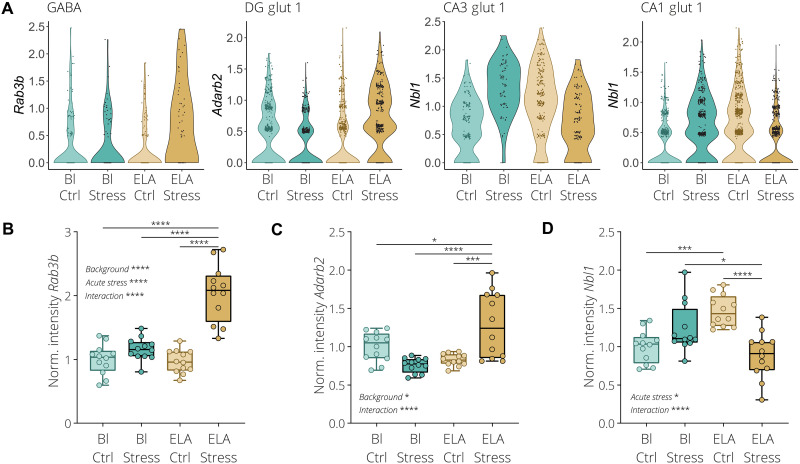
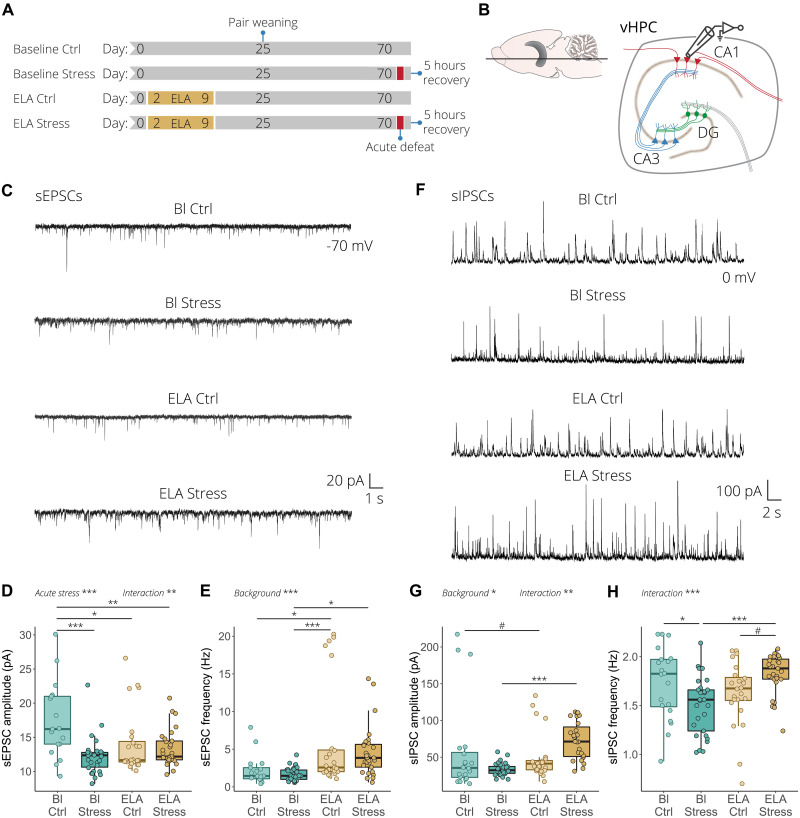
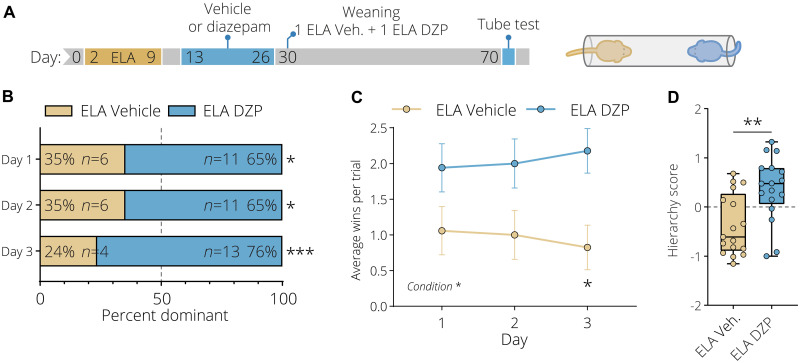
Adverse events in early life can modulate the response to additional stressors later in life and increase the risk of developing psychiatric disorders. The underlying molecular mechanisms responsible for these effects remain unclear. Here, we uncover that early life adversity (ELA) in mice leads to social subordination. Using single-cell RNA sequencing (scRNA-seq), we identified cell type-specific changes in the transcriptional state of glutamatergic and GABAergic neurons in the ventral hippocampus of ELA mice after exposure to acute social stress in adulthood. These findings were reflected by an alteration in excitatory and inhibitory synaptic transmission induced by ELA in response to acute social stress. Finally, enhancing the inhibitory network function through transient diazepam treatment during an early developmental sensitive period reversed the ELA-induced social subordination. Collectively, this study significantly advances our understanding of the molecular, physiological, and behavioral alterations induced by ELA, uncovering a previously unknown cell type-specific vulnerability to ELA.


Figures

Fig. 1.
Fig. 1.. Early life adversity leads to social subordination in group-housed animals.
(A) Experimental timeline of control and early life adversity (ELA) animals. Animals were weaned in groups of four consisting of two control (light green) and two ELA (light gold) animals. Ten groups were behaviorally tested in the social box (SB) at the juvenile (~6 weeks) and adult (~9 weeks) stage. (B) The 60 cm × 60 cm SB arena containing an s-wall, nest, small nest, two feeders, and two ramps. (C) Reduced weight gain of ELA animals compared to control animals. Data represent mean ± SD, n = 20 per condition. Two-way repeated-measures analysis of variance (ANOVA) with Bonferroni post hoc test. ELA-exposed animals have a lower daily David score based on chases at the (D) juvenile and (E) adult stage. Two-way repeated-measures ANOVA. (F and G) Hierarchy distribution based on the cumulative David score over 4 days of all 10 groups tested in the SB. The hierarchy order is from alpha, beta, gamma to sigma, with the highest-ranking animal being the alpha. Mice selected for sequencing are highlighted with a dot. Both at the (F) juvenile and (G) adult stage, ELA animals display a significantly lower social rank. Yates’ corrected chi-square test. (H) Experimental timeline of animals tested in the tube test. Animals were pair-weaned with one control and one ELA animal. (I) Hierarchy distribution over the three tube test days. Yates’ corrected chi-square test. (J) ELA exposure significantly reduced the average number daily tube test wins. Data represent mean ± SEM. Two-way repeated-measures ANOVA with Bonferroni post hoc test. (K) ELA animals have a significantly lower hierarchy score. Box plots represent the 25%, median, and 75% quartile; whiskers span 1.5 × interquartile range (IQR). Unpaired t tests, two-tailed. *P < 0.05, **P < 0.01, ****P < 0.0001.
Fig. 2.
Fig. 2.. ELA blunts the acute stress–induced transcriptional activation in ventral hippocampal CA3 glutamatergic neurons.
(A) Experimental timeline. “Baseline” indicates animals that were not exposed to ELA. The blue sections indicate when animals were behaviorally tested in the SB. Half of the baseline and half of the ELA animals underwent acute social defeat stress (red blocks). The four conditions baseline control (Bl Ctrl), baseline stress (Bl Stress), ELA control (ELA Ctrl), and ELA stress were characterized using single-cell RNA sequencing (scRNA-seq). (B) Corticosterone (CORT) levels 5 hours after acute social defeat exposure. Data represent mean ± SEM. Two-way ANOVA with Tukey post hoc test. (C) Outline of the scRNA-seq experiment. For each condition, three animals (total of 12 individual samples) were used from which the ventral hippocampus (vHPC) was bilaterally isolated followed by scRNA-seq. (D) Cell clustering of all 12 mouse vHPC samples depicted using uniform manifold approximation and projection (UMAP). The colors represent the 31 Louvain groups of individual cell types. (E) Distribution of all major cell types identified in the vHPC, with a total of 28,167 collected cells. A number of cell types are abbreviated as follows: glutamatergic neurons (Glut neurons), oligodendrocyte progenitor cells (OPCs), GABAergic neurons (GABA), newly formed oligodendrocytes (NFOL), committed oligodendrocyte progenitors (COP), neural progenitor cells (NPCs), and myelin-forming oligodendrocytes (MFOL). (F) Dot plot of the number of differentially expressed genes (DEGs). From left to right: baseline control versus baseline stress, baseline control versus ELA control, baseline stress versus ELA stress, and ELA control versus ELA stress. The size and color of the circle indicate the number of DEGs. (G) Identified DEGs in 19 clusters split by down- and up-regulated. The number in each tile indicates the number of DEGs. *P < 0.05, ****P < 0.0001.
Fig. 3.
Fig. 3.. Widespread and cell type–specific transcriptional patterning induced by ELA.
(A) Illustration of the theoretical transcriptional patterning effects where ELA interacts with gene expression changes induced by acute stress exposure. The transcriptional patterning effects are categorized as up- or down-regulated chronic, inverted, primed, or blunted expression. (B) Dot plot on the left side represents all combined DEGs in 19 clusters identified in all four comparisons (Bl Ctrl versus Bl Stress, Bl Ctrl versus ELA Ctrl, Bl Stress versus ELA Stress, and ELA Ctrl versus ELA Stress). Size and the color of the circles indicate the number of DEGs. The violin plot on the right side indicates the calculated gene patterning score for each DEG associated with each cluster. The gene patterning score of several clusters significantly deviates from the collection of all gene patterning scores from all 19 clusters. The higher the score, the higher the likelihood to find one of the four gene patterning types, while a lower score indicates a lower interaction between ELA and the acute stress. One-way ANOVA with Tukey post hoc test. (C) Lollipop plot ranking the top 30 highest scoring genes in GABAergic neurons (GABA), dentate gyrus (DG) glutamatergic neuron cluster 1 (DG glut 1), CA3 glutamatergic neuron cluster 1 (CA3 glut 1), and CA1 glutamatergic neuron cluster 1 (CA1 glut 1). (D) Clustered heatmap visualization of the log2FC of the top 30 highest scoring genes in the four selected clusters. The four rows in each heatmap represent the four differential expression comparisons. (E) Quantification of each of the individual transcriptional patterning types in the four selected clusters identifies distinct transcriptional patterns. Box plots represent the 25%, median, and 75% quartile; whiskers span 1.5 × IQR. *P < 0.05, ****P < 0.0001.
Fig. 4.
Fig. 4.. Rab3b, Adarb2, and Nbl1 differentially respond to acute stress after ELA exposure.
(A) Violin plots illustrating the expression of selected top scoring genes determined by scRNA-seq, namely, Rab3b in the GABAergic neuron cluster, Adarb2 in the DG glutamatergic neuron cluster 1, and Nbl1 in the CA3 glutamatergic neuron cluster 1 and CA1 glutamatergic neuron cluster 1. (B) Quantification of the Rab3b mRNA expression signal in cells positive for the GABAergic neuron marker Slc32a1 in the CA3 vHPC region. (C) Quantification of the Adarb2 mRNA expression signal in cells positive for the glutamatergic neuron marker Slc17a1 in the DG vHPC region. (D) Quantification of the Nbl1 mRNA expression signal in cells positive for the glutamatergic neuron marker Slc17a1 in the CA3 vHPC region. Box plots represent the 25%, median, and 75% quartile; whiskers span minimum to maximum. Two-way ANOVA with Tukey post hoc test. *P < 0.05, ***P < 0.001, ****P < 0.0001.
Fig. 5.
Fig. 5.. ELA alters excitation and inhibition transmission in response to acute stress in the vHPC.
(A) Experimental timeline for the electrophysiological recording of the baseline control, baseline stress, ELA control, and ELA stress conditions. (B) Illustration of an ex vivo acute ventral hippocampal brain slice depicting whole-cell patch-clamp recording obtained from CA1 pyramidal neurons. (C) Representative spontaneous excitatory postsynaptic current (sEPSC) recordings from CA1 pyramidal neurons. (D) Quantification of sEPSC amplitude. Acute stress reduces sEPSC amplitude, while ELA-exposed animals have chronically reduced sEPSC amplitude with no further effect of acute stress (left). (E) In wild-type mice, acute stress has no effect on sEPSC frequency, while in ELA mice it increases sEPSC frequency (right). (F) Representative spontaneous inhibitory postsynaptic current (sIPSC) recordings from CA1 pyramidal neurons. (G) Quantification of sIPSC amplitude showed that acute stress had no effect in wild-type animals, while acute stress significantly increased sIPSC amplitude in mice with ELA background (left). (H) Acute stress significantly reduced sIPSC frequency in wild-type mice, while the frequency was increased in response to acute stress in ELA mice (right). sEPSCs and sIPSCs were recorded at –70 and 0 mV, respectively, from n = 17 to 30 cells/four to six mice per group. Box plots represent the 25%, median, and 75% quartile; whiskers span 1.5 × IQR. Two-way ANOVA with Tukey post hoc test. #P < 0.1, *P < 0.05, **P < 0.01, ***P < 0.001.
Fig. 6.
Fig. 6.. Diazepam reverses the ELA-induced subordination behaviors.
(A) Experimental timeline of the early life chronic diazepam treatment of ELA-exposed animals. Animals were pair-housed after the chronic diazepam treatment, with each pair consisting of one ELA saline–treated (light gold) and one ELA diazepam–treated (blue) animal. The hierarchy of the pairs was subsequently tested in the tube test in adulthood. (B) Hierarchy distribution over the three tube test days shows that diazepam-treated ELA animals are significantly more dominant over ELA saline–treated animals. Yates’ corrected chi-square test. (C) Diazepam treatment of ELA animals significantly increased the average number of daily tube test wins. Data represent mean ± SEM. Two-way repeated-measures ANOVA with Bonferroni post hoc test. (D) Diazepam-treated ELA animals have a significantly higher hierarchy score combining the average number of wins, head pushes, and the time they spent retreating and moving forward. Box plots represent the 25%, median, and 75% quartile; whiskers span minimum to maximum. Unpaired t tests, two-tailed. *P < 0.05, **P < 0.01, ***P < 0.001.

References

    1. C. Heim, C. B. Nemeroff, Neurobiology of early life stress: Clinical studies. Semin. Clin. Neuropsychiatry 7, 147–159 (2002). - PubMed
    1. P. E. Mullen, J. L. Martin, J. C. Anderson, S. E. Romans, G. P. Herbison, The long-term impact of the physical, emotional, and sexual abuse of children: A community study. Child Abuse Negl. 20, 7–21 (1996). - PubMed
    1. C. B. Nemeroff, Paradise lost: The neurobiological and clinical consequences of child abuse and neglect. Neuron 89, 892–909 (2016). - PubMed
    1. M. H. Teicher, J. A. Samson, Annual research review: Enduring neurobiological effects of childhood abuse and neglect. J. Child Psychol. Psychiatry 57, 241–266 (2016). - PMC - PubMed
    1. R. C. Kessler, K. A. McLaughlin, J. G. Green, M. J. Gruber, N. A. Sampson, A. M. Zaslavsky, S. Aguilar-Gaxiola, A. O. Alhamzawi, J. Alonso, M. Angermeyer, C. Benjet, E. Bromet, S. Chatterji, G. de Girolamo, K. Demyttenaere, J. Fayyad, S. Florescu, G. Gal, O. Gureje, J. M. Haro, C.-Y. Hu, E. G. Karam, N. Kawakami, S. Lee, J.-P. Lépine, J. Ormel, J. Posada-Villa, R. Sagar, A. Tsang, T. B. Ustün, S. Vassilev, M. C. Viana, D. R. Williams, Childhood adversities and adult psychopathology in the who world mental health surveys. Br. J. Psychiatry 197, 378–385 (2010). - PMC - PubMed