. 2024 Feb;11(5):e2305311.
doi: 10.1002/advs.202305311. Epub 2023 Dec 1.

Design and Engineering of Light-Induced Base Editors Facilitating Genome Editing with Enhanced Fidelity

Affiliations

Design and Engineering of Light-Induced Base Editors Facilitating Genome Editing with Enhanced Fidelity

Yangning Sun et al. Adv Sci (Weinh). 2024 Feb.

Abstract

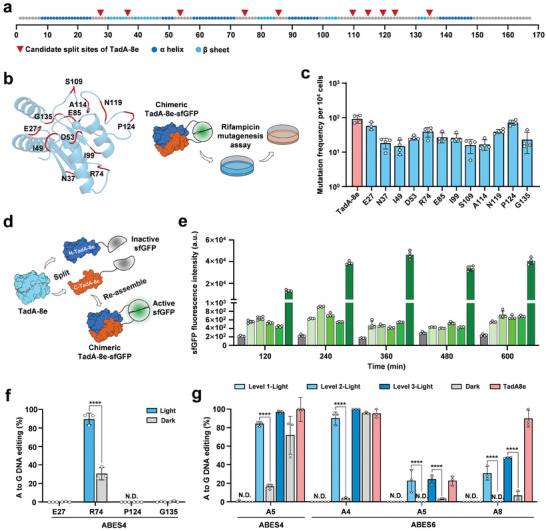
Base editors, which enable targeted locus nucleotide conversion in genomic DNA without double-stranded breaks, have been engineered as powerful tools for biotechnological and clinical applications. However, the application of base editors is limited by their off-target effects. Continuously expressed deaminases used for gene editing may lead to unwanted base alterations at unpredictable genomic locations. In the present study, blue-light-activated base editors (BLBEs) are engineered based on the distinct photoswitches magnets that can switch from a monomer to dimerization state in response to blue light. By fusing the N- and C-termini of split DNA deaminases with photoswitches Magnets, efficient A-to-G and C-to-T base editing is achieved in response to blue light in prokaryotic and eukaryotic cells. Furthermore, the results showed that BLBEs can realize precise blue light-induced gene editing across broad genomic loci with low off-target activity at the DNA- and RNA-level. Collectively, these findings suggest that the optogenetic utilization of base editing and optical base editors may provide powerful tools to promote the development of optogenetic genome engineering.

Keywords: base editor; low off-target effect; optogenetics; spatiotemporal control.


Conflict of interest statement

The authors declare no conflict of interest.

Figures

Figure 1
Figure 1
Schematic of BLABE and BLCBE. a) Split DNA deaminase TadA‐8e was linked to two ingredients of Magnets (pMag and nMag) and nCas9, with the N‐terminal TadA‐8e (blue) fused to nMag (orange), and the C‐terminal was tagged with pMag and nCas9, respectively. Under the blue light (488 nm) adaptor stage, the Magnets dimerize, resulting in functional TadA‐8e that converted the target adenine (A) to inosine (I). b) For BLCBE, similar to BLABE, N‐terminal APOBEC3A (cyan blue) was fused to nMag. The C‐terminal APOBEC3A (green) combined with nCas9 and UGI, with pMag attached to C‐terminal APOBEC3A. Blue light (488 nm) permitted the dimerization of N‐ and C‐terminal APOBEC3A to form a functional protein that changed target cytosine (C) to uracil (U). In another instance, the active protein was dissociated and inactivated under the dark stage.
Figure 2
Figure 2
Split deaminases strategy for optically regulated base editing of BLABE. a) Schematic of potential split sites on the primary TadA‐8e structure. Twelve candidate sites for splitting are located in the unstructured loops, indicated with the red triangle, and positioned between two amino acids. The secondary structure of TadA‐8e is highlighted with different colors (α‐helix, dark blue; β‐sheet, light blue). b) Cartoon representation of TaA‐8e protein monomer and the assay of screening test for rifampicin resistance. Left, potential sfGFP insertion sites for TadA‐8e were located after the red‐labeled amino acid. Right, intact TadA‐8e and chimeric TadA‐8e‐sfGFP were transformed into E. coli DH10B to evaluate rifampicin resistance mutations, with TadA‐8e as the positive control. c) The frequency of rifampicin‐resistance mutations of intact TadA‐8e and chimeric TadA‐8e variants were measured using the number of RifR clones on the expression of TadA8e variants in E. coli DH10B. d) Strategy for characterizing spontaneous dimerization of split TadA‐8e. The chimeric TadA‐8e‐sfGFP were engineered split within the sfGFP to yield N‐ and C‐terminal chimeric proteins, where the sfGPF was inactive. The sfGFP intensity can be detected until the spontaneous complementation of split TadA‐8e. e) The green fluorescence intensity of split‐sfGFP with various split sites for TadA‐8e. E. coli DH10B with split‐proteins variants were incubated up to 600 min at 120‐min intervals and subsequently evaluated for green fluorescence intensity. Intact sfGFP was used as the positive control and E. coli DH10B without plasmid (CK) as negative control. f) The efficiency of BLABE on base editing at the target ABES4 site. To investigate the editing efficiency using pMag and nMagHigh1 as preliminary light‐inducing elements. E. coli DH10B was transformed with plasmids expressing BLABE featuring various split sites (E27, R74, P124, and G135). Base editing efficiency was evaluated using Sanger sequencing and EditR (N.D. no detected; **** P < 0.0001). g) Selection of photoswitches for BLABE system. Candidates contain pMagFast1‐nMagHigh1 (Level 1), pMag‐nMagHigh (Level 2), and pMagHigh1‐nMagHigh1 (Level 3). The efficiency of adenine editing with various Magnets for the BLABE system targeting two different sites (n = 3, N.D. no detected; **** P < 0.0001). Dots represent individual biological replicates, and bars represent mean ± standard deviation (s.d.) from n  =  4 donors (c) or n  =  3 donors (e, f, and g).
Figure 3
Figure 3
Characterization of BLABE and BLCBE for base editing in E. coli. a) DNA editing efficiency of BLABE under various blue light intensities. The E. coli DH10B with BLABE system targeting ABES4 was treated with varying intensities (dark, 2.5; 5; and 10 mW cm−2) of light and dark for 300 min. b) The E. coli DH10B with BLCBE system targeting CBES3 was treated with varying intensities (dark; 2.5; 5; and 10 mW cm−2) of blue light and dark for 300 min, then the DNA editing efficiency was analyzed using Sanger sequencing. c) Heat maps show the on‐target adenine editing frequencies of ABE, BLABE‐light, and BLABE‐dark with different sgRNAs targeting genome. d) Heat maps show the on‐target cytosine editing frequencies of CBE, BLCBE‐light, and BLCBE‐dark with different sgRNAs targeting the genome. The editing windows represent the base involved in DNA editing, not the entirety of the protospacer. The numbering at the bottom represents the position of the respective base in the protospacer sequence. All data are shown as individual data points and means ± s.d. for n = 3 independent biological replicates.
Figure 4
Figure 4
BLBEs enable temporal control of base editing in E. coli. a) Schematic illustrating the construction of ABE, BLABE, and target sfGFPTGA* plasmids. b) Schematic illustrating the construction of CBE, BLCBE, and target sfGFPACG plasmids. c) Temporal control of gene editing of inactivated sfGFP variants by the BLBEs systems. The process was divided into the dark (0–240 min) and light (240–540 min) stages. ABE was in normal light. For BLBEs systems, E. coli DH10B with inactive sfGFP was incubated up to 240 min, after which the function of BLBEs was regulated in the presence or absence of light until 540 min. d) Fluorescence image showing sfGFP expression level after cultured for 60 min and treatment with blue light from 240 to 540 min. Scar bar, 20 µm. e,f) Quantification of fluorescence intensity of sfGFPTGA* (e) and sfGFPACG (f) by MicroplateReader with intact BEs or BLBEs with the presence or absence of blue light changed from 0 to 540 min. The time point of blue light activation (240 min) is marked in red. The mean and s.d. were obtained from three independent biological replicates.
Figure 5
Figure 5
Off‐target editing of base editor systems on the genome and transcriptome. a) Schematic showing sgRNA‐dependent off‐target effects for ABE (left) and CBE (right). b) Left shows quantified on‐target genomic editing for ABE, BLABE, and sgRNA targeting ABES4. Right shows quantified sgRNA‐dependent off‐target genomic editing for BLABE on the OT1. c) Left shows quantified on‐target genomic editing for ABE, BLABE, and sgRNA targeting ABES19. Right shows quantified sgRNA‐dependent off‐target genomic editing for BLABE on the OT1, off‐target 2 (OT2), and off‐target 3 (OT3). d) Left shows quantified on‐target genomic editing for CBE, BLCBE, and sgRNA targeting CBES4. Right shows quantified sgRNA‐dependent off‐target genomic editing for BLABE on the OT1. e) Left shows quantified on‐target genomic editing for CBE, BLCBE, and sgRNA targeting CBES6. Right shows quantified sgRNA‐dependent off‐target genomic editing for BLABE on the OT1. f) Schematic diagram of orthogonal R‐loop assay for evaluating sgRNA‐independent off‐target of TadA‐8e on the genome. g) The sgRNA‐independent off‐target genomic editing was evaluated. The editing efficiency of ABE and BLABE (light and dark) were evaluated using NGS. R‐loop 1, R‐loop 2, and R‐loop 3 show off‐target editing effects at the locus opened by dSaCas9. h) Manhattan scatter plot showing transcriptomic A‐to‐I mutations detected in RNA‐seq experiments from E. coli DH10B in which ABE, BLABE‐light, BLABE‐dark with sgRNA targeting ABES4. The E. coli DH10B as the negative control expressed no sgRNA. The number of adenines modified is indicated at the top. i) Schematic diagram of orthogonal R‐loop assay for evaluating sgRNA‐independent off‐target of A3A on the genome. j) The sgRNA‐independent off‐target genomic editing was evaluated. The editing efficiency of CBE and BLCBE (light and dark) were evaluated using NGS. R‐loop 1, R‐loop 2, and R‐loop 3 show off‐target editing effects at the locus opened by dSaCas9. k) Manhattan scatter plot showing transcriptomic C‐to‐U mutations detected in RNA‐seq experiments from E. coli DH10B in which CBE, BLCBE‐light, BLCBE‐dark with sgRNA targeting CBES3. The E. coli DH10B as the negative control expressed no sgRNA. The number of cytosines modified is indicated at the top. All data are shown as individual data points and means ± s.d. for n = 3 independent biological replicates.
Figure 6
Figure 6
Off‐target editing of BLABE and BLCBE on the genome and transcriptome in HEK293T. a) Left, heat maps show on‐target adenine editing frequencies of ABE, BLABE‐light, and BLABE‐dark with different sgRNAs targeting HEK293T genome. Right, heat maps show on‐target cytosine editing frequencies of CBE, BLCBE‐light, and BLCBE‐dark with different sgRNAs targeting HEK293T genome. The editing windows represent the base involved in DNA editing, not the entirety of the protospacer. The numbering at the bottom represents the position of the respective base in the protospacer sequence. b) Schematic showing sgRNA‐dependent off‐target effects for ABE and BLABE. Left shows that on‐target genomic editing was quantified for ABE and BLABE with sgRNA targeting HEK2. Right shows that sgRNA‐dependent off‐target genomic editing was quantified for ABE and BLABE on the off‐target 1 (HEK2‐OT1). c) Schematic diagram of orthogonal R‐loop assay for evaluating sgRNA‐independent off‐target of ABE and BLABE on the genome. The sgRNA‐independent off‐target genomic editing was evaluated. The editing efficiency of ABE and BLABE (light and dark) were evaluated using NGS. Sa‐site3, Sa‐site4, and Sa‐site5 show off‐target editing effects at the locus opened by dSaCas9. d) Schematics show sgRNA‐dependent off‐target effects for CBE and BLCBE. Left shows quantified on‐target genomic editing for CBE and BLCBE with sgRNA targeting HEK2. Right shows quantified sgRNA‐dependent off‐target genomic editing for ABE and BLABE on the off‐target 1 (HEK2‐OT1). e) Schematic diagram of orthogonal R‐loop assay for evaluating sgRNA‐independent off‐target of CBE and BLCBE on the genome. The sgRNA‐independent off‐target genomic editing was evaluated. The editing efficiency of CBE and BLCBE (light and dark) were evaluated using NGS. Sa‐site3, Sa‐site4, and Sa‐site5 show off‐target editing effects at the locus opened by dSaCas9. f) The combination of column stacking plot and heat map for the off‐target efficiency of ABE and BLABE on the transcriptome. Cloum stacking plot shows the proportion of various types of RNA mutation in the total transcriptomic SNPs mutation. The number indicated the percentage of A to G and T to C mutation frequencies across all mutation types of the transcriptome (left) and the hot map indicated the number of A to G and T to C mutations at the transcriptome (right). g) The combination of column stacking plot and heat map for the off‐target efficiency of CBE and BLCBE on the transcriptome. Cloum stacking plot shows the proportion of various types of RNA mutation in the total transcriptomic SNPs mutation. The number indicated the percentage of C to T and G to A mutation frequencies across all mutation types of the transcriptome (left) and the hot map indicated the number of C to T and G to A mutations at the transcriptome (right). All data are shown as individual data points and means ± s.d. for n = 3 independent biological replicates.

References

    1. Komor A. C., Kim Y. B., Packer M. S., Zuris J. A., Liu D. R., Nature 2016, 533, 420. - PMC - PubMed
    1. Gaudelli N. M., Komor A. C., Rees H. A., Packer M. S., Badran A. H., Bryson D. I., Liu D. R., Nature 2017, 551, 464. - PMC - PubMed
    1. Rees H. A., Liu D. R., Nat. Rev. Genet. 2018, 19, 770. - PMC - PubMed
    1. Grisch‐Chan H. M., Schwank G., Harding C. O., Thöny B., Hum. Gene Ther. 2019, 30, 1274. - PMC - PubMed
    1. Lee C., Hyun Jo D., Hwang G.‐H., Yu J., Kim J. H., Park S.‐E., Kim J.‐S., Kim J. H., Bae S., Mol. Ther. 2019, 27, 1364. - PMC - PubMed

Publication types

LinkOut - more resources