. 2023 Dec 11;41(12):2154-2165.e5.
doi: 10.1016/j.ccell.2023.11.005. Epub 2023 Nov 30.

Phenotypic signatures of circulating neoantigen-reactive CD8+ T cells in patients with metastatic cancers

Affiliations

Phenotypic signatures of circulating neoantigen-reactive CD8+ T cells in patients with metastatic cancers

Rami Yossef et al. Cancer Cell. .

Abstract

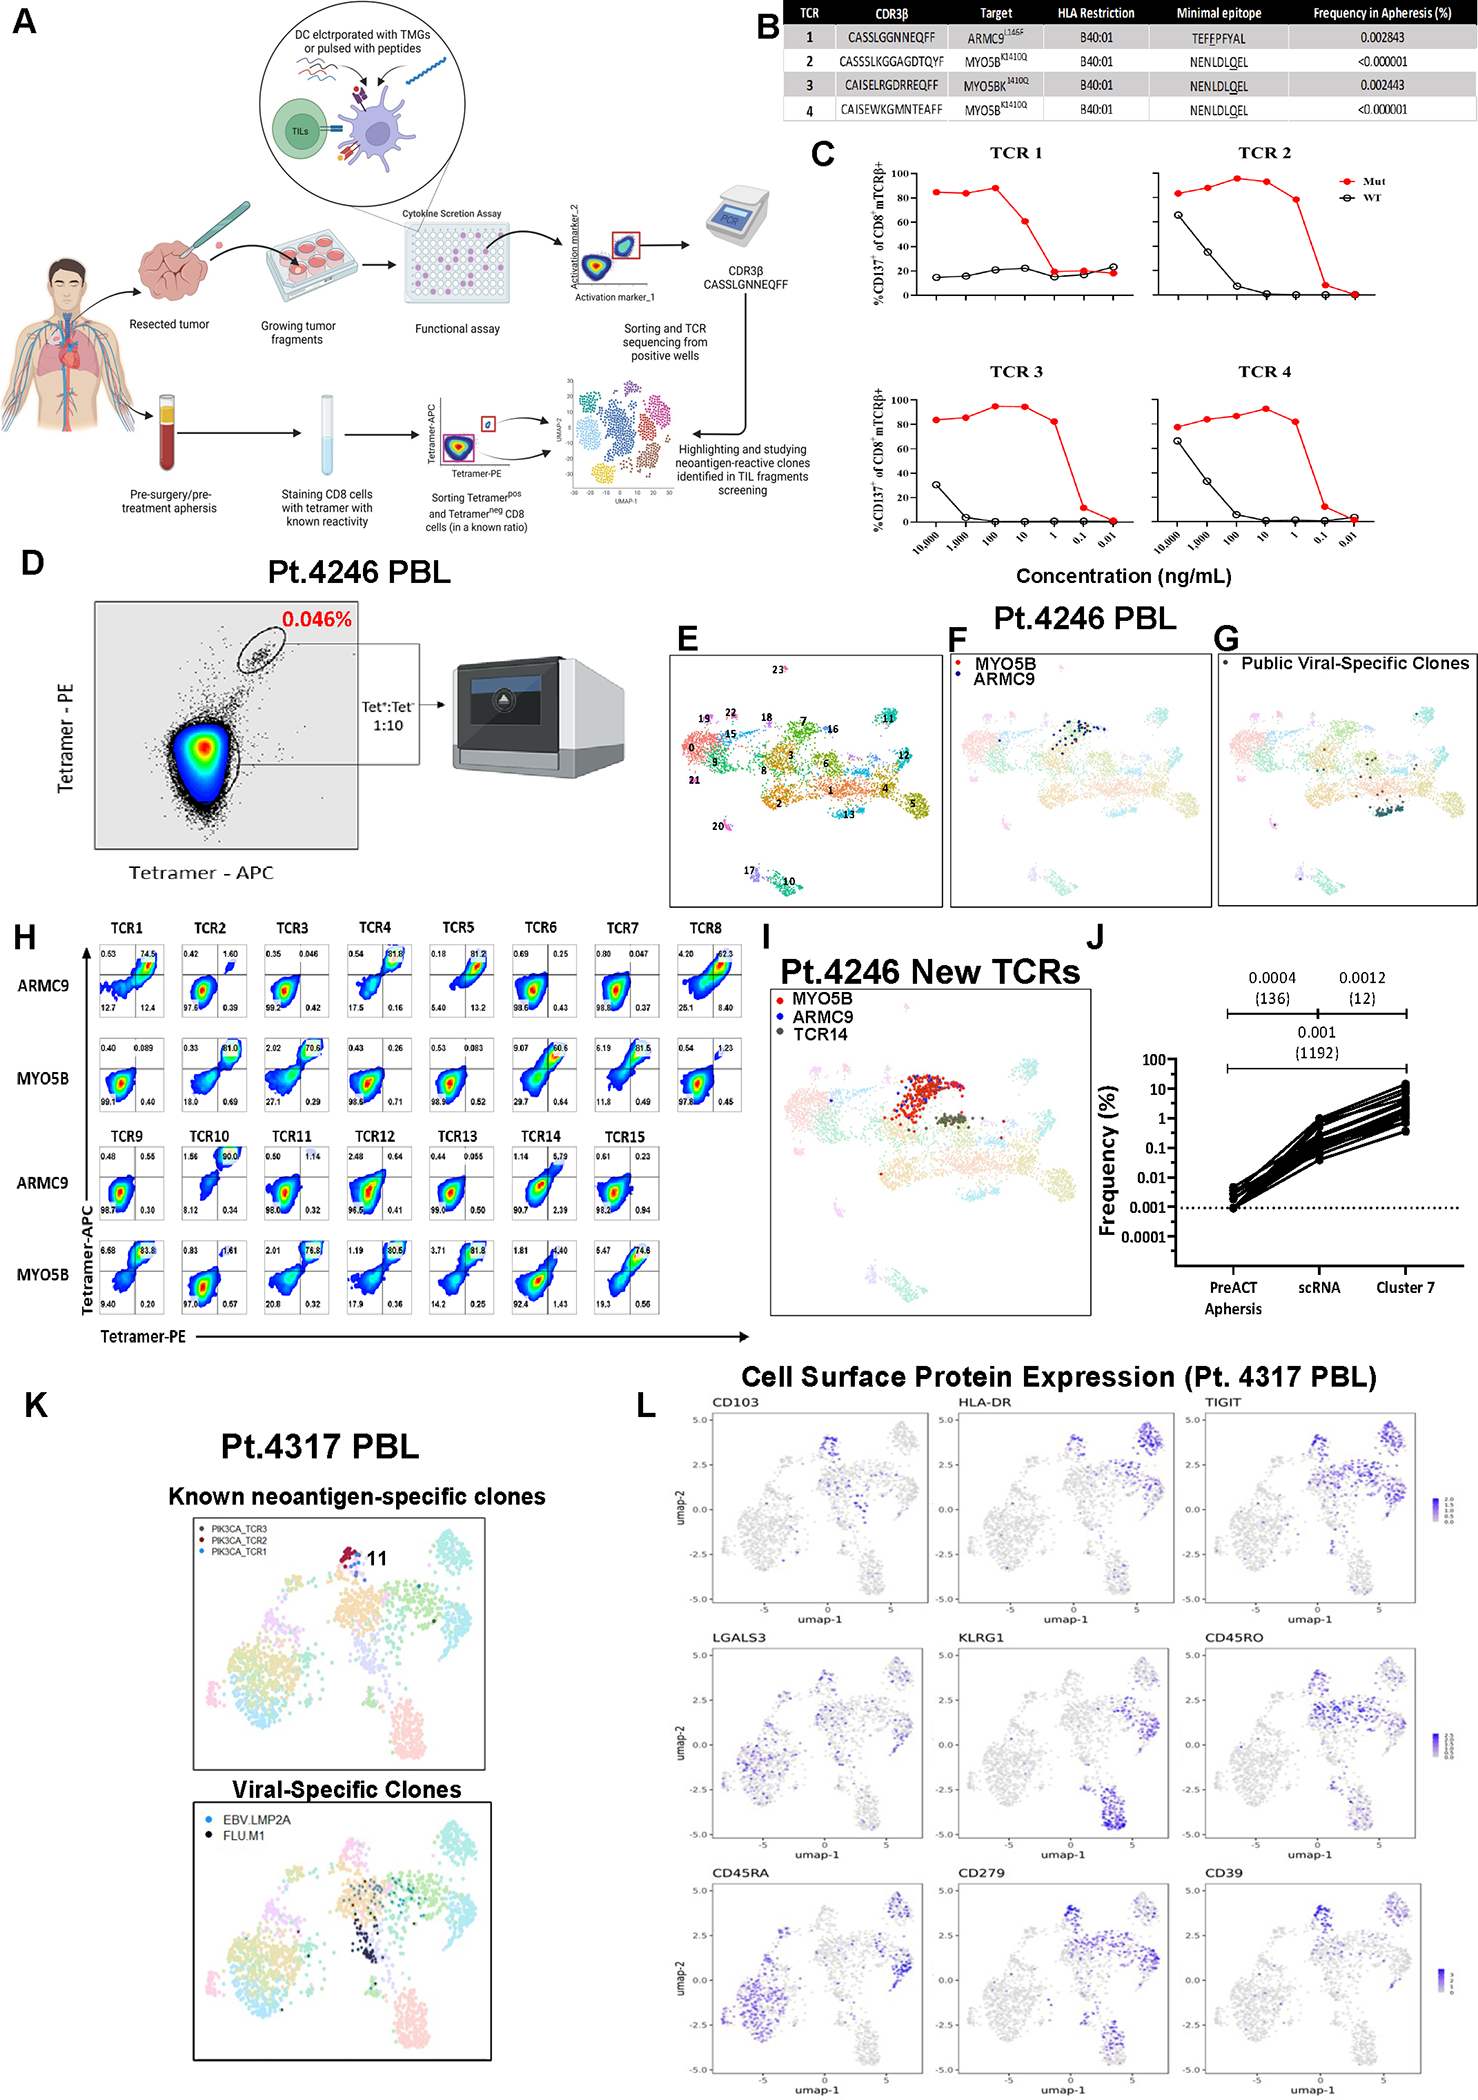
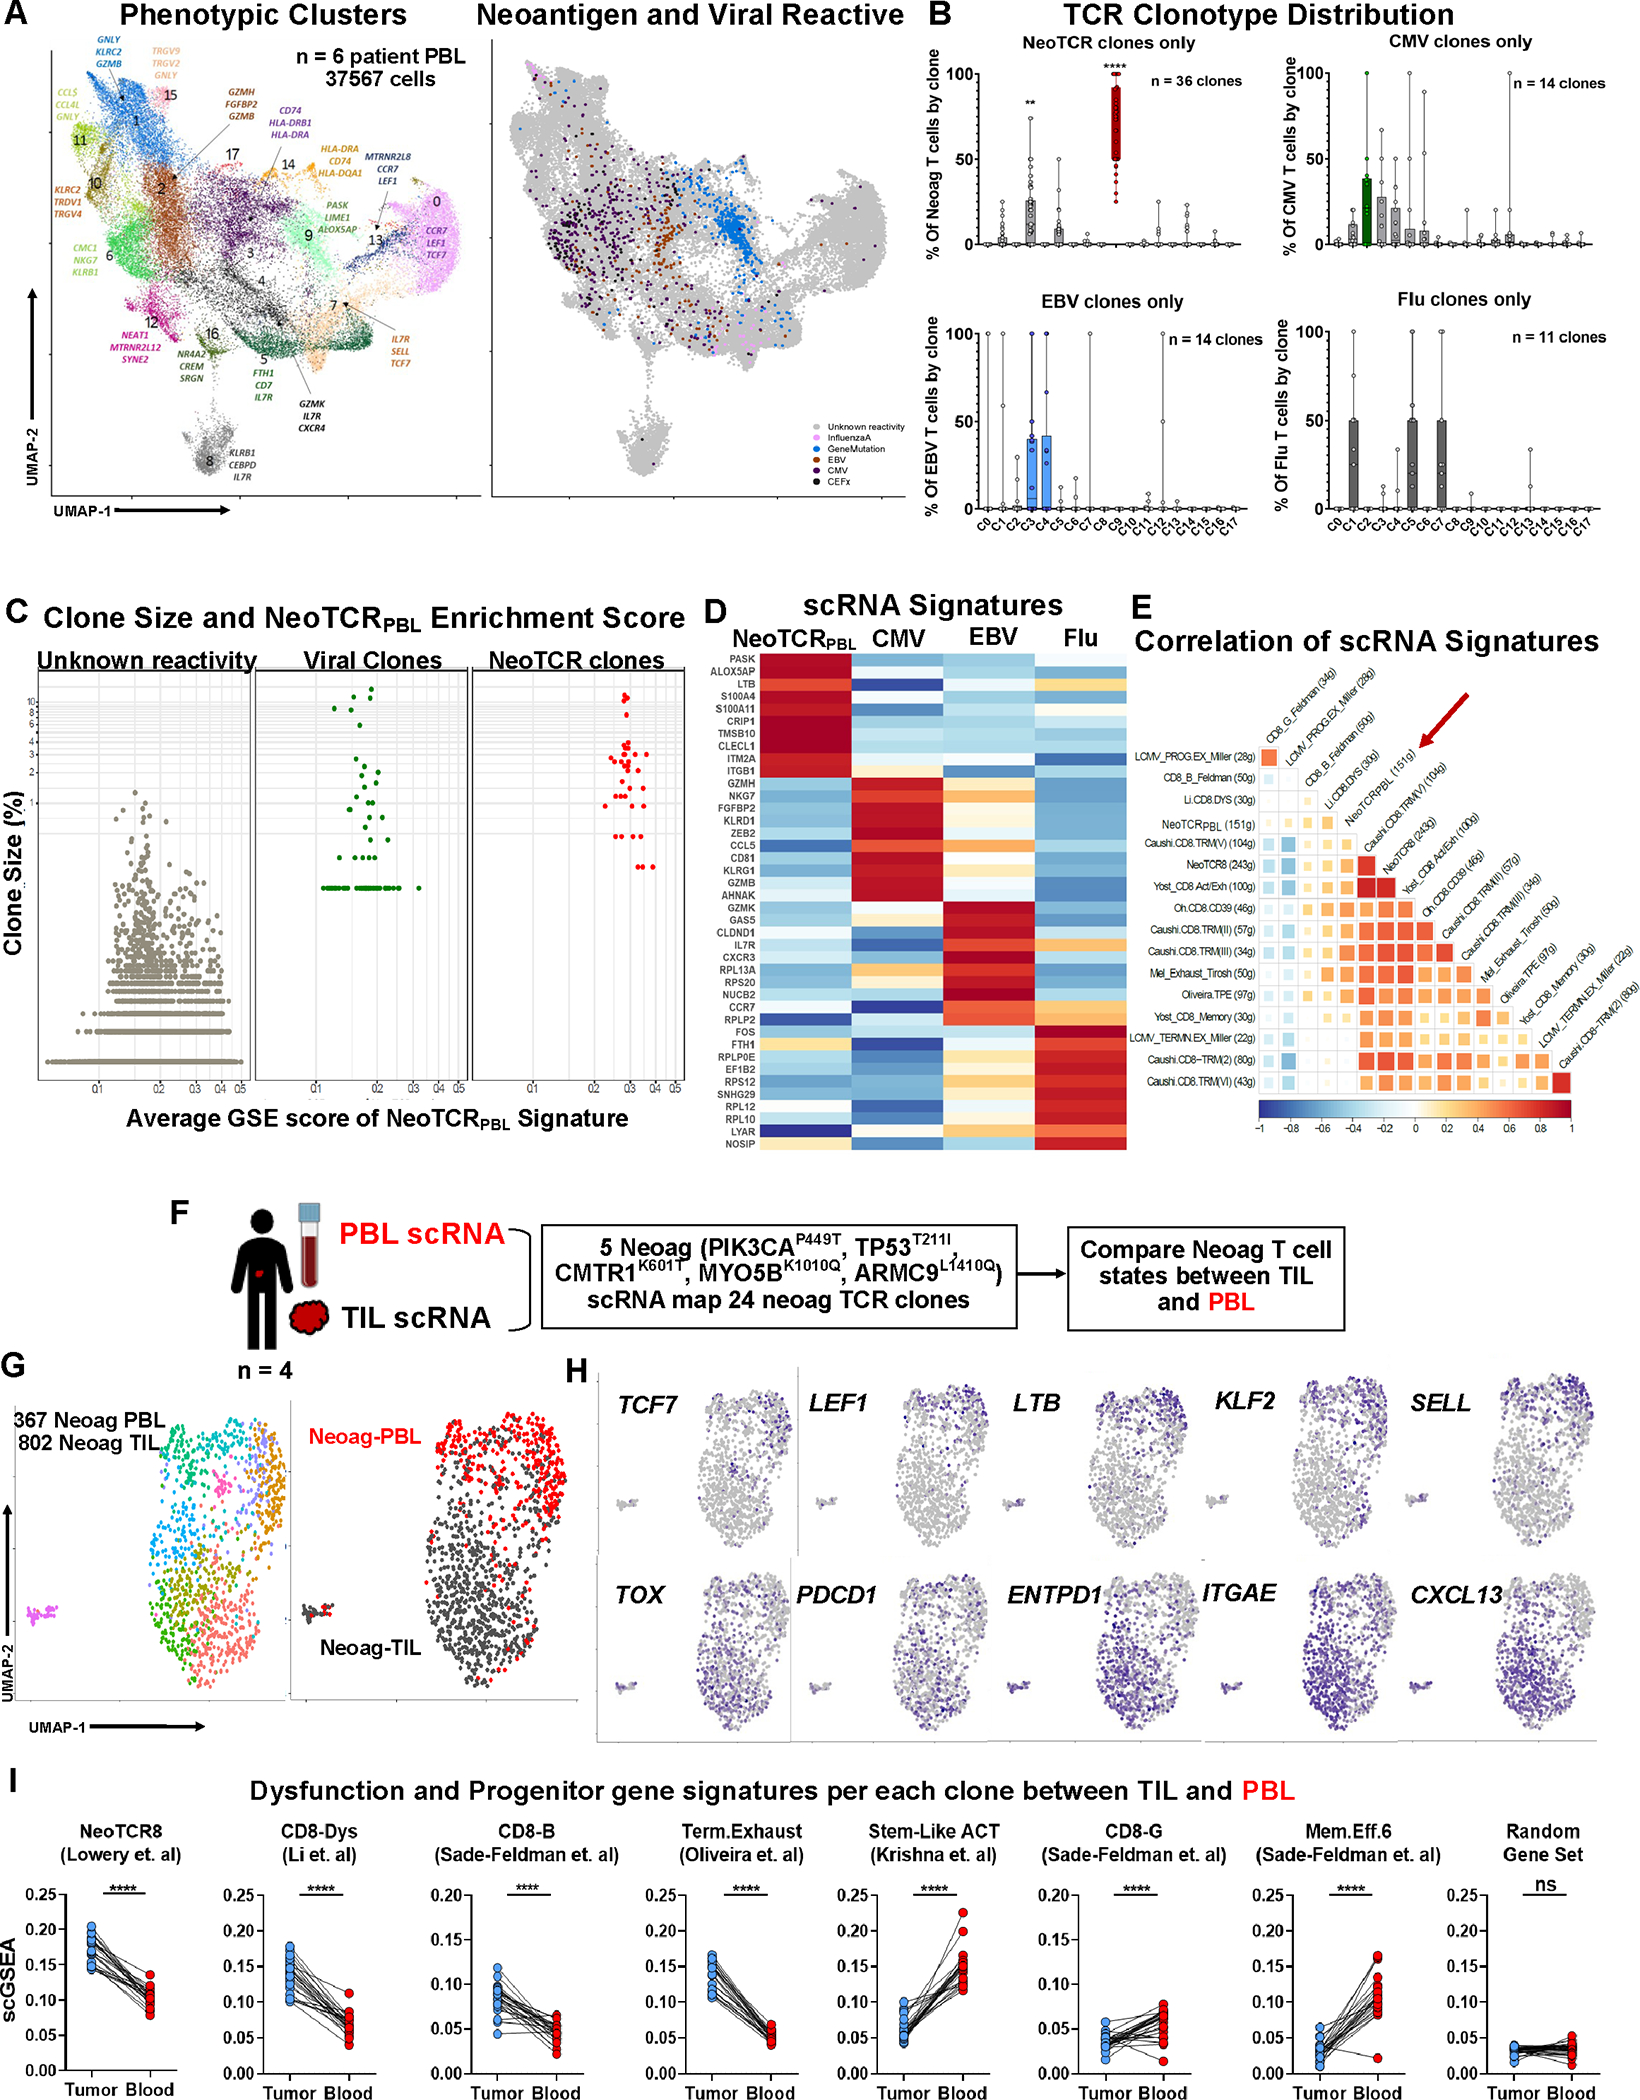
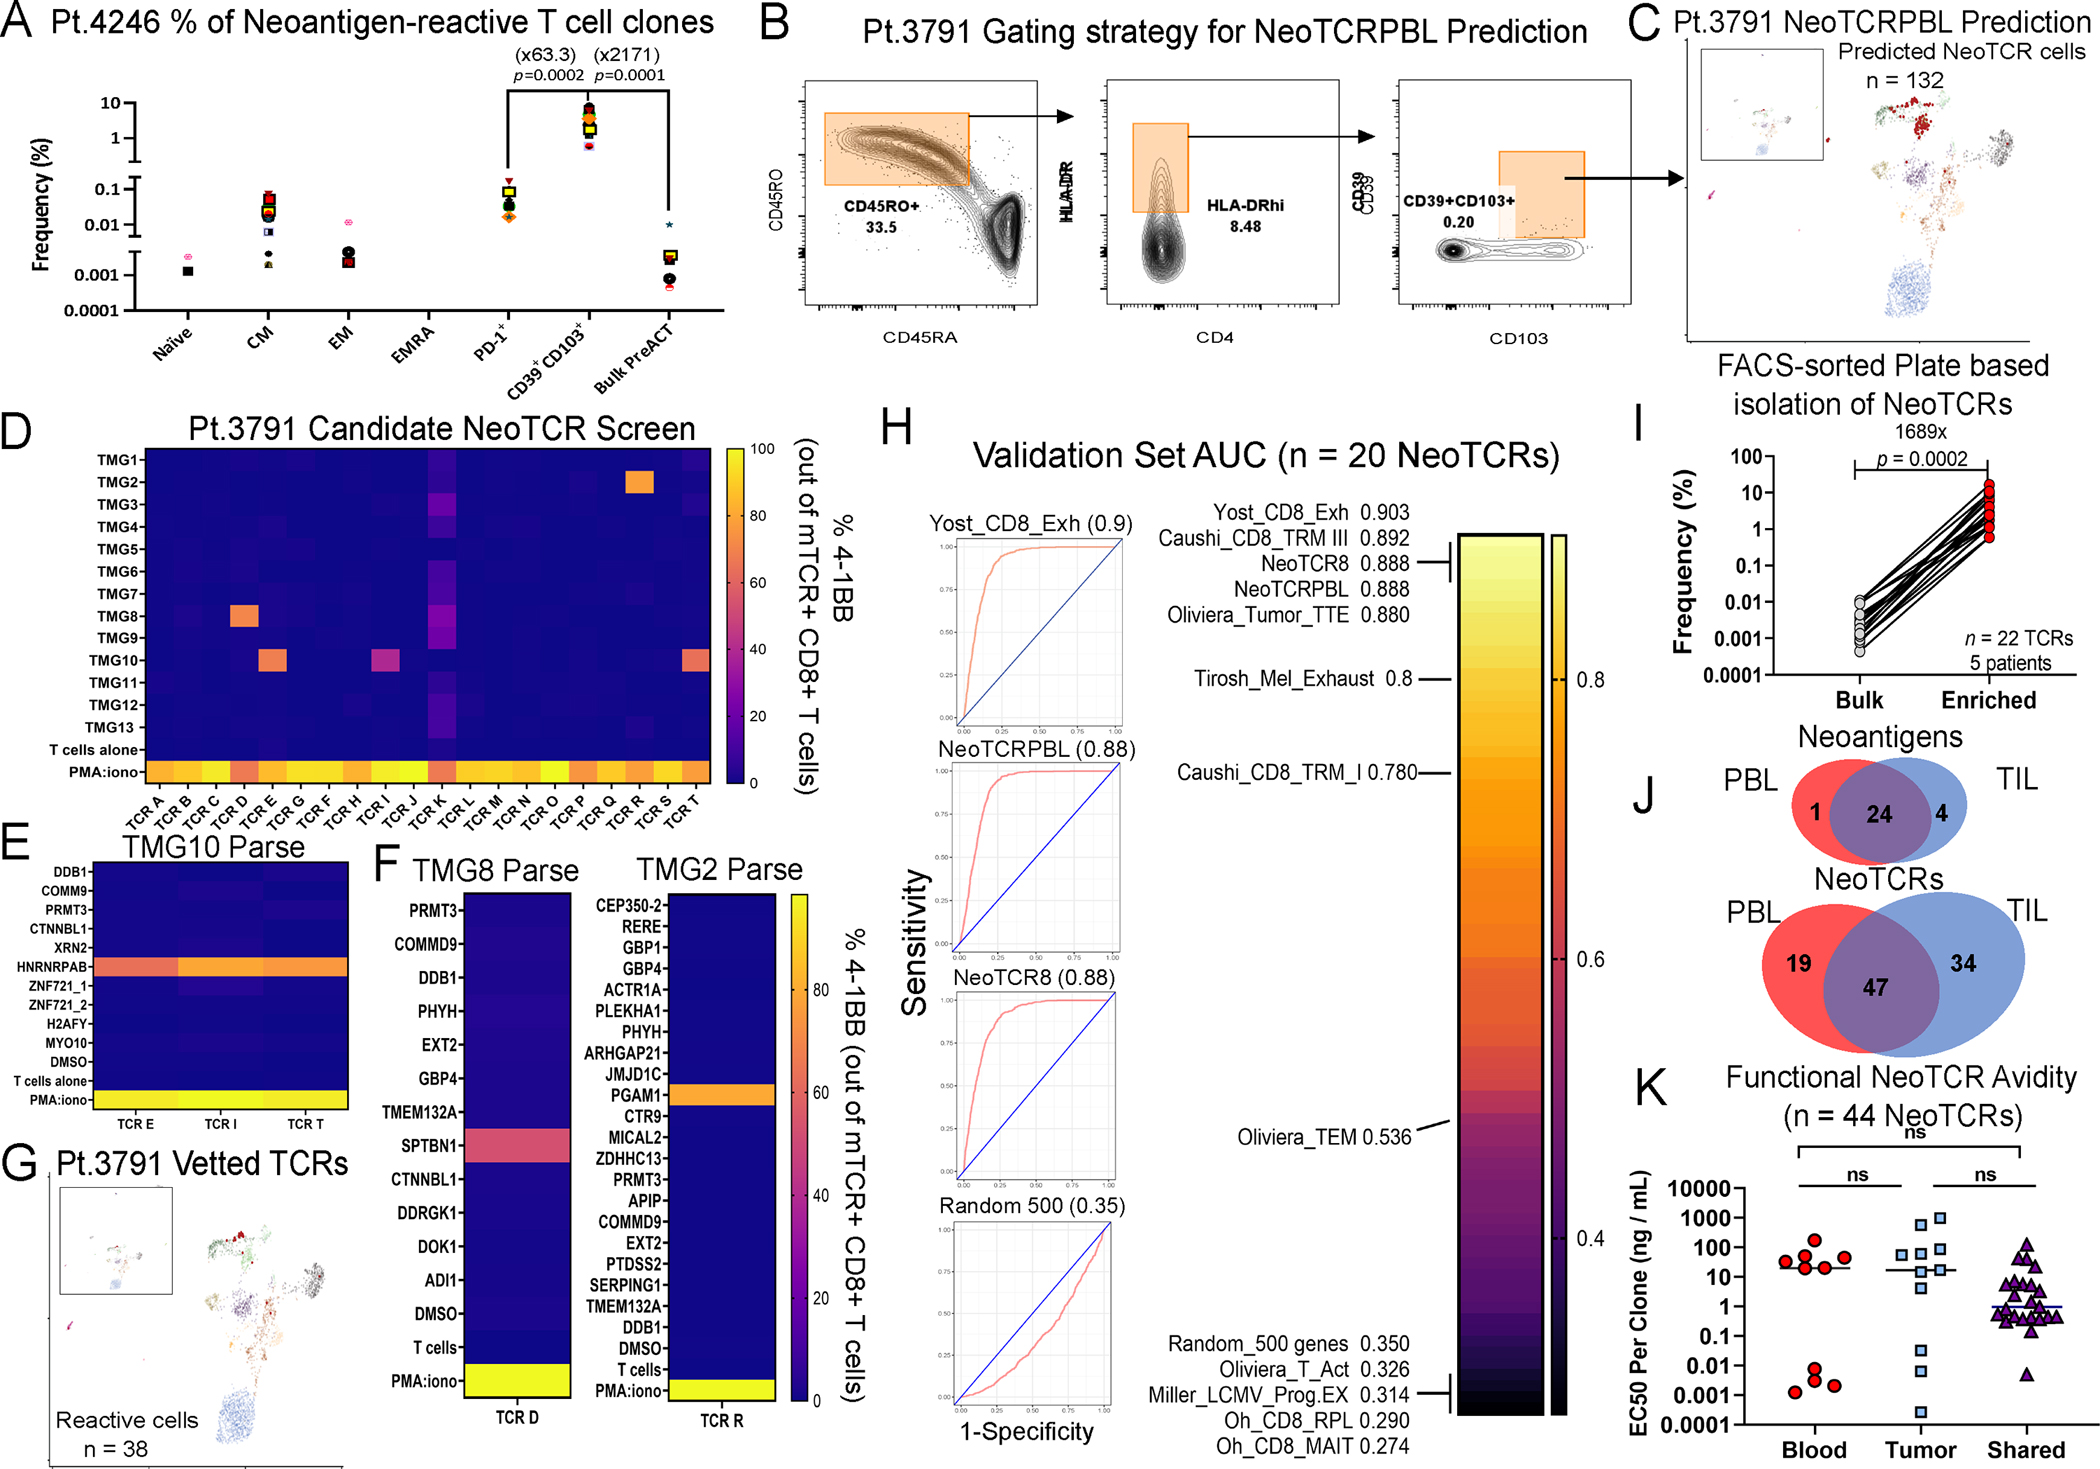
Circulating T cells from peripheral blood (PBL) can provide a rich and noninvasive source for antitumor T cells. By single-cell transcriptomic profiling of 36 neoantigen-specific T cell clones from 6 metastatic cancer patients, we report the transcriptional and cell surface signatures of antitumor PBL-derived CD8+ T cells (NeoTCRPBL). Comparison of tumor-infiltrating lymphocyte (TIL)- and PBL-neoantigen-specific T cells revealed that NeoTCRPBL T cells are low in frequency and display less-dysfunctional memory phenotypes relative to their TIL counterparts. Analysis of 100 antitumor TCR clonotypes indicates that most NeoTCRPBL populations target the same neoantigens as TILs. However, NeoTCRPBL TCR repertoire is only partially shared with TIL. Prediction and testing of NeoTCRPBL signature-derived TCRs from PBL of 6 prospective patients demonstrate high enrichment of clonotypes targeting tumor mutations, a viral oncogene, and patient-derived tumor. Thus, the NeoTCRPBL signature provides an alternative source for identifying antitumor T cells from PBL of cancer patients, enabling immune monitoring and immunotherapies.

Keywords: CD8(+) T cells; T cell receptors; adoptive cell transfer; blood; neoantigens.


Conflict of interest statement

Declaration of interests R.Y., A.R.C., S.K., F.J.L. P.F.R., and S.A.R. are listed on a patent application (PCT/US2021/023225) that covers the use of NeoTCR(PBL) signature to identify antitumor TCRs.

Figures

Figure 1.
Figure 1.. Tetramer enrichment and scRNAseq of circulating neoantigen-reactive CD8+ T cells.
(A) Graphical pipeline summary of discovery, tetramer-enrichment and phenotypic analysis of neoantigen-reactive circulating CD8+ cells (prepared using BioRender.com). (B) Known neoantigen-reactive TCR CDR3β sequences, specificities, HLA of restriction, minimal epitope, and their frequencies in the pre-surgery blood of metastatic colon cancer patient (Pt. 4246). (C) CD137 expression of health-donor PBL TCR-transduced PBLs following overnight co-culture with 4246 dendritic cells (DCs) pulsed with various dilutions of their cognate minimal mutated or wild-type peptides. (D) Tetramer-enrichment sort of circulating neoantigen-reactive T cells spiked back into bulk CD8+ population at a 1:10 ratio. (E) UMAP projection of the single-cell transcriptome of Pt.4246 PBL. (F) Previously known neoantigen-reactive T cells (against ARMC9L146F or MYO5BK1410Q) highlighted in Pt.4246 PBL (G) Public viral-targeting TCRs highlighted (H) Healthy donor PBLs virally-transduced with candidate TCRs from cluster 7 (C7) stained with ARMC9L146F or MYO5BK1410Q fluorescent tetramers. (I) Highlighting all T cell clones expressing neoantigen-reactive TCRs. (J) Summary of enrichment of neoantigen-reactive clones in the pre-enrichment PBL, scRNA after enrichment, and specifically in cluster 7. (K) UMAP projection of scRNAseq of PIK3CAP449T:HLA-A*02:01-tetramer-enriched T cells from the peripheral blood sample of a metastatic cancer patient (Pt. 4317). (L) Expression of cell surface feature-barcoded CITE-Seq antibody staining intensities of protein markers. Also see Fig. S1–3 and Table S1.
Figure 2:
Figure 2:. Transcriptional program of circulating neoantigen-reactive CD8+ T cells.
(A) Transcriptional clustering and UMAP projection of circulating CD8+ cells from six metastatic cancer patients’ blood samples (Left) and Projection of neoantigen- and viral-reactive clones on the UMAP space (right). (B) Frequency of neoantigen- and viral-reactive clones within UMAP clusters. **P < 0.01, ****P < 0.001 by Two-way ANOVA adjusted by Bonferroni multiple corrections (C) Comparison of clonal frequency and average NeoTCRPBL signature score by scGSEA within neoantigen-, viral-specific clones, and rest of clones with unknown-reactivities. Welch Two Sample t-test of clone size between viral and NeoTCRPBL clones P = 0.227. (D) Heatmap of top 10 differentially expressed genes between Neoantigen-, CMV, EBV-, and InfluenzaA-reactive T cells from the six patient PBL. (E) Pearson correlation between public TIL gene-signatures and NeoTCRPBL. (F) Schematic representing the combined TIL + PBL neoantigen T cell phenotypic states analysis within each patient. (G) UMAP displaying the combined analysis of neoantigen-specific T cells (24 total neoantigen T cell clones) from each of the 4 patients (left panel), and segregation of transcriptomic states based on their TIL compartment (Neoag-TIL) or peripheral blood compartment (Neoag-PBL) (right panel). (H) Gene expression of candidate memory progenitor genes (top panel), and tissue-residency, dysfunctional T cell genes (bottom panel) across the combined TIL-PBL UMAP. (I) Average gene signature scores (scGSEA) scores of immunotherapy response and non-response associated gene signatures that indicate T cell dysfunction, stem-like progenitor states within each individual neoantigen-reactive clone (n = 24) compared between its TIL compartment and PBL compartment from all 4 patients. Random gene set of 50 genes are displayed as control gene signature. ****P < 0.0001 by Paired T-test per each neoantigen T cell clonotype. Also see Fig S.4–5 and Table S1–2.
Figure 3:
Figure 3:. Prospective prediction of neoantigen-reactive circulating CD8+ T cells patient PBL
(A) Frequency of known neoantigen-reactive T cell clones in FACS-sorted T cell subsets from pt.4246 PBL. Fold change of the mean frequencies of neoantigen-reactive T cell clones between indicated groups is presented in parentheses. T-test p-value is shown between the groups. Each colored shape represents a different neoantigen TCR clone from pt.4246 PBL. (B) FACS-sorting enrichment gating of circulating CD8+ T cells from pt.3791 for scRNAseq. 3,290 CD39+CD103+ were sorted and mixed with 9500 bulk CD8+ T cells from PBL. (C) Clustering and projection of predicted neoantigen-reactive T cells from PBL, based on AUCell (red). (D) Frequency of TCR-transduced CD8+ cells expressing CD137 following co-culture with imDCs electroporated with patient’s TMGs (D) or mutated peptides for the corresponding TMG. (E-F) Deconvolution of TMG hits to identify specific neoantigens recognized by patient NeoTCRPBL. (G) Summary back-projection of experimentally vetted NeoTCRPBL cells on pt.3791 PBL UMAP. (H) Summarized mean AUC scores of ROC analysis comparing NeoTCRPBL signature and published TIL gene-signatures for prediction of neoantigen-reactive T cells from three validation set samples (pt.3791, pt.4180, pt.4359). Random 500 gene set is shown as control (I) FACS-based enrichment and identification of neoantigen-reactive clones within circulating lymphocytes from PBL of 5 prospective patients. Neoantigen-reactive clone frequency was compared between bulk lymphocytes and within enriched sorted populations (based on Table S1). Numbers represent fold enrichment and p-value of Paired T-test. (J) Summary of the landscape of neoantigen-reactive TCR clonotypes and their cognate neoantigens shared between TIL and PBL (identified by NeoTCRPBL signature or FACS-sorting) from all patients (total of 100 TCRs from TIL and PBL). (K). Functional avidity of 44 NeoTCR clones that were either found only in the PBL compartment (Blood), TIL compartment (Tumor), or shared between PBL and TIL (Shared). Data shown is the half-maximal reactivity for each TCR clone assessed by titrating the reactivity across a wide range of cognate mutated neopeptide concentrations relative to the wildtype peptide pulsed on autologous APCs. Also see Fig. S6–8 and Table S1.

References

    1. Pardoll DM (2012). The blockade of immune checkpoints in cancer immunotherapy. Nature Reviews Cancer 12, 252–264. 10.1038/nrc3239. - DOI - PMC - PubMed
    1. Rosenberg SA, and Restifo NP (2015). Adoptive cell transfer as personalized immunotherapy for human cancer. Science 348, 62–68. 10.1126/science.aaa4967. - DOI - PMC - PubMed
    1. Morgan RA, Dudley ME, Wunderlich JR, Hughes MS, Yang JC, Sherry RM, Royal RE, Topalian SL, Kammula US, Restifo NP, et al. (2006). Cancer regression in patients after transfer of genetically engineered lymphocytes. Science 314, 126–129. - PMC - PubMed
    1. June CH, and Sadelain M (2018). Chimeric Antigen Receptor Therapy. N. Engl. J. Med. 379, 64–73. - PMC - PubMed
    1. Thorsson V, Gibbs DL, Brown SD, Wolf D, Bortone DS, Ou Yang T-H, Porta-Pardo E, Gao GF, Plaisier CL, Eddy JA, et al. (2019). The Immune Landscape of Cancer. Immunity 51, 411–412. - PubMed

Substances