. 2023 Dec 11;41(12):2100-2116.e10.
doi: 10.1016/j.ccell.2023.11.004. Epub 2023 Nov 30.

ALK inhibitors increase ALK expression and sensitize neuroblastoma cells to ALK.CAR-T cells

Affiliations

ALK inhibitors increase ALK expression and sensitize neuroblastoma cells to ALK.CAR-T cells

Elisa Bergaggio et al. Cancer Cell. .

Abstract

Selection of the best tumor antigen is critical for the therapeutic success of chimeric antigen receptor (CAR) T cells in hematologic malignancies and solid tumors. The anaplastic lymphoma kinase (ALK) receptor is expressed by most neuroblastomas while virtually absent in most normal tissues. ALK is an oncogenic driver in neuroblastoma and ALK inhibitors show promising clinical activity. Here, we describe the development of ALK.CAR-T cells that show potent efficacy in monotherapy against neuroblastoma with high ALK expression without toxicity. For neuroblastoma with low ALK expression, combination with ALK inhibitors specifically potentiates ALK.CAR-T cells but not GD2.CAR-T cells. Mechanistically, ALK inhibitors impair tumor growth and upregulate the expression of ALK, thereby facilitating the activity of ALK.CAR-T cells against neuroblastoma. Thus, while neither ALK inhibitors nor ALK.CAR-T cells will likely be sufficient as monotherapy in neuroblastoma with low ALK density, their combination specifically enhances therapeutic efficacy.

Keywords: ALK; adoptive T cell therapy; cell engineering; cellular immunity; chimeric antigen receptors; lorlatinib; neuroblastoma; solid tumors; tyrosine kinase inhibitors.


Conflict of interest statement

Declaration of interests D.A. is an employee of Celldex Therapeutics, a company that developed anti-ALK antibodies for therapeutic applications. E.B., W.-T.T., and R.C. filed a patent related to this work covering the development of ALK.CAR-T cells.

Figures
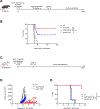
Figure 1.
Figure 1.. Mouse ALK.CAR-Ts demonstrate antitumor activity in leukemia and neuroblastoma models.
(A) Schema of the CD19+/ALK+ Eμ-myc leukemia syngeneic tumor model infused with CAR-Ts on day 4 after tumor inoculation. ALK-sorted CD19+/ALK+ Eμ-myc cells were injected i.v. and after 3 days treated i.p. with cyclophosphamide (100 mg/kg). (B) Kaplan-Meier survival curve of mice in (A) (6 mice/NT group, 8 mice/CTX group, 9 mice/mCD19.CAR-T group, 9 mice/mALK.CAR-T group). ***P = 0.0003 (CTX only versus mALK.CAR-T), *P = 0.0121 (CTX only versus mCD19.CAR-T), by Mantel-Cox test. Days indicated represent the days post T cell infusion. (C) Schema of the ALKF1174L/MYCN syngeneic neuroblastoma tumor model infused with CAR-Ts on day 1 after tumor inoculation. The endpoint of the experiment was determined by the appearance of signs of graft-versus-host disease (GVHD) characterized by loss of fur and weight with lethargy. (D) Tumor volumes of mice in (C) (10 mice/NT group, 12 mice/mCD19.CAR-T group, 18 mice/mALK.CAR-T group). Days indicated represent the days post T cell infusion. (E) Kaplan-Meier survival curve of mice in (C) (10 mice/NT group, 12 mice/mCD19.CAR-T group, 18 mice/mALK.CAR-T group). ****P < 0.0001 (NT versus mALK.CAR-T), ****P < 0.0001 (mCD19.CAR-T versus mALK.CAR-T), by Mantel-Cox test. Days indicated represent the days post T cell infusion. NT, non-treated; TFS, tumor-free survival. See also Figures S1,S2.
Figure 2.
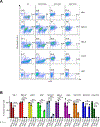
Figure 2.. Human ALK.CAR-Ts efficiently kill human neuroblastoma cells in vitro.
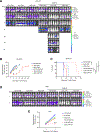
(A) The indicated neuroblastoma cell lines labeled with GFP were co-cultured with UT, CD19.CAR-T, ALK.CAR-T, GD2.CAR-T at the T cell to tumor ratio 1 to 5 (1 to 1 for NGP cell line). On day 5, neuroblastoma (GFP+) and T cells (CD3+) were enumerated by flow cytometry. Flow-cytometry plots representative of 4 healthy donors are shown. (B) The indicated neuroblastoma cell lines expressing FFluciferase-GFP were co-cultured with UT, CD19.CAR-T, ALK.CAR-T, GD2.CAR-T at the T cell to tumor ratio 1 to 1. On day 3, luciferase activity of targets was measured. Data points indicate the mean ± SD of quadruplicates from a representative of 3 independent experiments conducted with different healthy donors. *P < 0.05, **P < 0.01, ***P < 0.001, ****P < 0.0001, by one-way ANOVA with Tukey test for multiple comparisons. UT, untransduced T cells; ns, not significant. See also Figures S2,S3.
Figure 3.
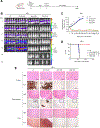
Figure 3.. Human ALK.CAR-Ts show antitumor activity in neuroblastoma metastatic model with high ALK expression.
(A) Schema of the ALK amplified neuroblastoma metastatic model infused with CAR-Ts on day 33 after tumor inoculation. (B) Bioluminescence images of FFluc-NB-1 tumor growth in the neuroblastoma metastatic model shown in (A). (C) Bioluminescence kinetics measured as total flux (photons/s) of FFluc-NB-1 tumor growth (5 mice/group) in the neuroblastoma metastatic model shown in (A). Data points indicate the mean ± SEM. **P < 0.01, ***P < 0.001 (CD19.CAR-T versus ALK.CAR-T), by unpaired, two-tailed t-test. (D) Kaplan-Meier survival curve of mice in (A) (5 mice/group). **P = 0.0023 (CD19.CAR-T versus ALK.CAR-T), **P = 0.0023 (CD19.CAR-T versus GD2.CAR-T), by Mantel-Cox test. Days indicated represent the days post T cell infusion. (E) Representative hematoxylin and eosin staining (H&E) and immunohistochemistry staining performed with ALK antibody in the indicated tissues of the neuroblastoma metastatic model shown in (A). Organs have been collected at the end of the survival experiment shown in (B), when signs of discomfort have been detected or at the end of the experiment 120 days post T cells infusion. Black boxes indicate 3-fold zoomed-in cutout. Scale bar = 200 μm. UT, untransduced T cells. See also Figure S3.
Figure 4.
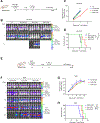
Figure 4.. Antitumoral activity of human ALK.CAR-Ts in neuroblastoma metastatic models with low ALK expression.
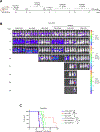
(A) Schema of the ALK mutated neuroblastoma metastatic model infused with CAR-Ts on day 21 after tumor inoculation. The endpoint of the experiment was determined by the appearance of signs of distress or sickness in mice. (B) Bioluminescence images of FFluc-SK-N-SH tumor growth in the neuroblastoma metastatic model shown in (A). (C) Bioluminescence kinetics measured as total flux (photons/s) of FFluc-SK-N-SH tumor growth (5 mice/group) in the neuroblastoma metastatic model shown in (A). **P < 0.01 (CD19.CAR-T versus ALK.CAR-T), by unpaired, two-tailed t-test. (D) Kaplan-Meier survival curve of mice in (A) (5 mice/group). **P = 0.0084 (UT versus ALK.CAR-T), *P = 0.0143 (CD19.CAR-T versus ALK.CAR-T), *P = 0.0143 (ALK.CAR-T versus GD2.CAR-T), by Mantel-Cox test. Days indicated represent the days post T cell infusion. (E) Schema of the ALK mutated neuroblastoma metastatic model infused with CAR-Ts on day 13 after tumor inoculation. The endpoint of the experiment was determined by the appearance of signs of distress or sickness in mice. (F) Bioluminescence images of FFluc-NGP tumor growth in the neuroblastoma metastatic model shown in (E). (G) Bioluminescence kinetics measured as total flux (photons/s) of FFluc-NGP tumor growth (5 mice/group) in the neuroblastoma metastatic model shown in (E). *P < 0.05, **P < 0.01 (CD19.CAR-T versus ALK.CAR-T), by unpaired, two-tailed t-test. (H) Kaplan-Meier survival curve of mice in (E) (5 mice/group). *P = 0.0153 (CD19.CAR-T versus ALK.CAR-T), **P = 0.0018 (CD19.CAR-T versus GD2.CAR-T), P = 0.0714 (ALK.CAR-T versus GD2.CAR-T), by Mantel-Cox test. Days indicated represent the days post T cell infusion. UT, untransduced T cells; ns, not significant. See also Figures S4,S5.
Figure 5.
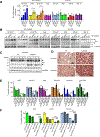
Figure 5.. ALK inhibitors increase ALK expression potentiating the activity of ALK.CAR-Ts in vitro.
(A) qRT-PCR expression analysis of ALK mRNA in the indicated neuroblastoma cell lines, NT, treated with DMSO, 10 nM lorlatinib or 100 nM lorlatinib 24 hours posttreatment. Data are the means ± SD of at least 3 independent experiments. **P = 0.0077 (DMSO versus 10 nM lorlatinib in SK-N-SH), *P = 0.0246 (DMSO versus 100 nM lorlatinib in SK-N-SH), *P = 0.0471 (DMSO versus 100 nM lorlatinib in LAN-5), **P = 0.0098 (DMSO versus 100 nM lorlatinib in SHSY5Y), by one-way ANOVA with Tukey test for multiple comparisons. (B) Western blot of the indicated neuroblastoma cell lines, NT, treated with DMSO, 10 nM lorlatinib or 100 nM lorlatinib. Cell lysates were immunoblotted using the indicated antibodies 24 hours posttreatment. α-actinin protein expression was included for protein loading normalization. (C) Western blot of lysates from SH-SY5Y s.c. tumors obtained from NSG mice treated or not with lorlatinib for 4 days. Cell lysates were immunoblotted using the indicated antibodies. Human GAPDH protein expression was included for protein loading normalization. Densitometric values of the bands are indicated. (D) Representative immunohistochemistry staining performed with ALK antibody in tumors of the neuroblastoma s.c. models SH-SY5Y and SK-N-SH in NSG mice treated or not with lorlatinib for 4 days. Scale bar = 50 μm. (E) The indicated neuroblastoma cell lines expressing FFluciferase-GFP were co-cultured with UT, CD19.CAR-T, ALK.CAR-T, GD2.CAR-T at the T cell to tumor ratio 1 to 5 (1:10 for SK-N-SH and Felix-PDX) and treated with 100 nM lorlatinib where indicated. On day 3, luciferase activity of targets was measured. Data points indicate the mean ± SD of quadruplicates from a representative of 3 independent experiments conducted with different healthy donors. *P < 0.05, ***P < 0.001, ****P < 0.0001, by unpaired, two-tailed t-test. (F) Indicated neuroblastoma cell lines expressing FFluciferase-GFP were treated or not with 500 nM TL-13–112. After 18 hours when the ALK protein is largely degraded, CD19.CAR-Ts or ALK.CAR-Ts were added to the culture at the T cell to tumor ratio 1 to 2 (for NGP cell line) or 1 to 20 (for LAN-5 and SK-N-FI cell lines) as well as treated with 200 nM ceritinib where indicated. On day 3, luciferase activity of targets was measured. Data points indicate the mean ± SD of quadruplicates from a representative of 2 independent experiments conducted with different healthy donors. **P < 0.01, ***P < 0.001, ****P < 0.0001, by one-way ANOVA with Tukey test for multiple comparisons. NT, non-treated; UT, untransduced T cells; lorl, lorlatinib; cer, ceritinib. See also Figures S6,S7.
Figure 6.
Figure 6.. Lorlatinib potentiates the activity of ALK.CAR-Ts in vivo.
(A) Bioluminescence images of FFluc-SK-N-SH tumor growth in the neuroblastoma metastatic model shown in Figure S8 (A). (B) Bioluminescence kinetics measured as total flux (photons/s) of FFluc-SK-N-SH tumor growth (4/5 mice/group) in the neuroblastoma metastatic model shown in Figure S8 (A) treated or not with lorlatinib. *P < 0.05, **P < 0.01 (CD19.CAR-T+lorl versus ALK.CAR-T+lorl), by unpaired, two-tailed t-test. (C) Kaplan-Meier survival curve of mice in Figure S8 (A) treated or not with lorlatinib (4/5 mice/group). *P = 0.0139 (CD19.CAR-T versus ALK.CAR-T), **P = 0.005 (CD19.CAR-T+lorl versus ALK.CAR-T+lorl), **P = 0.0027 (ALK.CAR-T versus ALK.CAR-T+lorl), **P = 0.0034 (ALK.CAR-T+lorl versus GD2.CAR-T+lorl), **P = 0.0039 (CD19.CAR-T versus ALK.CAR-T+lorl), by Mantel-Cox test. Days indicated represent the days post T cell infusion. (D) Bioluminescence images of FFluc-NGP tumor growth in the neuroblastoma metastatic model shown in Figure S8 (B). (E) Bioluminescence kinetics measured as total flux (photons/s) of FFluc-NGP tumor growth (5 mice/group) in the neuroblastoma metastatic model shown in Figure S8 (B) treated or not with lorlatinib. ****P < 0.0001 (CD19.CAR-T+lorl versus ALK.CAR-T+lorl), by unpaired, two-tailed t-test. lorl, lorlatinib. See also Figure S8.
Figure 7.
Figure 7.. Lorlatinib potentiates the activity of ALK.CAR-Ts in neuroblastomapatient derived xenograft (PDX) in vivo.
(A) Schema of the ALK mutated neuroblastoma metastatic model infused with CAR-Ts on day 43 after inoculation of Felix-PDX cells. (B) Bioluminescence images of FFluc-Felix-PDX tumor growth in the neuroblastoma metastatic model shown in (A). (C) Kaplan-Meier survival curve of mice in (A) treated with lorlatinib or not (5 mice/group). P = 0.5933 (CD19.CAR-T versus ALK.CAR-T), **P = 0.0015 (CD19.CAR-T versus GD2.CAR-T), *P = 0.0214 (CD19.CAR-T+lorl versus ALK.CAR-T+lorl), **P = 0.0021 (CD19.CAR-T+lorl versus GD2.CAR-T+lorl), by Mantel-Cox test. Days indicated represent the days post T cell infusion. PDX, patient derived xenograft; lorl, lorlatinib; ns, not significant.
Figure 8.
Figure 8.. Effects of lorlatinib treatment on ALK.CAR-Ts in vivo.
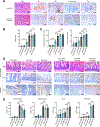
(A) Representative hematoxylin and eosin staining (H&E) and immunohistochemistry staining performed with the indicated antibodies in the livers of the neuroblastoma metastatic model shown in Figure S8 (B) treated or not with lorlatinib. NGP mice were sacrificed 15 days after CAR-T cell infusion. Scale bar = 100 μm. (B) Summary of hCD3+ cells quantified by immunohistochemistry as the average number of hCD3+ cells/20x field in 5 different areas of the liver for each mouse of the neuroblastoma metastatic model shown in Figure S8 (B) treated or not with lorlatinib. NGP mice were sacrificed 15 days after CAR-T cell infusion. Data points indicate the mean ± SD of 4 mouse/group. **P < 0.01, ****P < 0.0001, by one-way ANOVA with Tukey test for multiple comparisons. (C) Summary of the percentage of granzyme B+ or PD-1+ cells/hCD3+ cells quantified by immunohistochemistry in 5 different 20x field areas of the liver for each mouse of the neuroblastoma metastatic model shown in Figure S8 (B) treated or not with lorlatinib. NGP mice were sacrificed 15 days after CAR-T cell infusion. Data points indicate the mean ± SD of 4 mouse/group. ****P < 0.0001, by one-way ANOVA with Tukey test for multiple comparisons. (D) Representative hematoxylin and eosin staining (H&E) and immunohistochemistry staining performed with hCD3 antibody in the indicated tissues of the neuroblastoma metastatic model shown in Figure S8 (B) treated or not with lorlatinib. NGP mice were sacrificed 15 days after CAR-T cell infusion. Scale bar = 100 μm. (E) Summary of hCD3+ cells quantified by immunohistochemistry as the average number of hCD3+ cells/20x field in 5 different areas of the indicated tissues for each mouse of the neuroblastoma metastatic model shown in Figure S8 (B) treated or not with lorlatinib. NGP mice were sacrificed 15 days after CAR-T cell infusion. Data points indicate the mean ± SD of 4 mouse/group. **P < 0.01, ****P < 0.0001, by one-way ANOVA with Tukey test for multiple comparisons. lorl, lorlatinib; ns, not significant. See also Figure S8.

References

    1. Maris JM. (2010). Recent advances in neuroblastoma. The New England journal of medicine 362, 2202–2211. 10.1056/NEJMra0804577. - DOI - PMC - PubMed
    1. Park JR, Eggert A, and Caron H. (2008). Neuroblastoma: biology, prognosis, and treatment. Pediatr Clin North Am 55, 97–120, x. 10.1016/j.pcl.2007.10.014. - DOI - PubMed
    1. Irwin MS, and Park JR. (2015). Neuroblastoma: paradigm for precision medicine. Pediatr Clin North Am 62, 225–256. 10.1016/j.pcl.2014.09.015. - DOI - PubMed
    1. Pule MA, Savoldo B, Myers GD, Rossig C, Russell HV, Dotti G, Huls MH, Liu E, Gee AP, Mei Z, et al. (2008). Virus-specific T cells engineered to coexpress tumor-specific receptors: persistence and antitumor activity in individuals with neuroblastoma. Nature medicine 14, 1264–1270. 10.1038/nm.1882. - DOI - PMC - PubMed
    1. Heczey A, Louis CU, Savoldo B, Dakhova O, Durett A, Grilley B, Liu H, Wu MF, Mei Z, Gee A, et al. (2017). CAR T Cells Administered in Combination with Lymphodepletion and PD-1 Inhibition to Patients with Neuroblastoma. Molecular therapy : the journal of the American Society of Gene Therapy 25, 2214–2224. 10.1016/j.ymthe.2017.05.012. - DOI - PMC - PubMed

Publication types

MeSH terms

Substances