. 2023 Dec 12;56(12):2719-2735.e7.
doi: 10.1016/j.immuni.2023.11.003. Epub 2023 Nov 30.

Intestinal microbiota-specific Th17 cells possess regulatory properties and suppress effector T cells via c-MAF and IL-10

Affiliations

Intestinal microbiota-specific Th17 cells possess regulatory properties and suppress effector T cells via c-MAF and IL-10

Leonie Brockmann et al. Immunity. .

Abstract

Commensal microbes induce cytokine-producing effector tissue-resident CD4+ T cells, but the function of these T cells in mucosal homeostasis is not well understood. Here, we report that commensal-specific intestinal Th17 cells possess an anti-inflammatory phenotype marked by expression of interleukin (IL)-10 and co-inhibitory receptors. The anti-inflammatory phenotype of gut-resident commensal-specific Th17 cells was driven by the transcription factor c-MAF. IL-10-producing commensal-specific Th17 cells were heterogeneous and derived from a TCF1+ gut-resident progenitor Th17 cell population. Th17 cells acquired IL-10 expression and anti-inflammatory phenotype in the small-intestinal lamina propria. IL-10 production by CD4+ T cells and IL-10 signaling in intestinal macrophages drove IL-10 expression by commensal-specific Th17 cells. Intestinal commensal-specific Th17 cells possessed immunoregulatory functions and curbed effector T cell activity in vitro and in vivo in an IL-10-dependent and c-MAF-dependent manner. Our results suggest that tissue-resident commensal-specific Th17 cells perform regulatory functions in mucosal homeostasis.

Keywords: IL-10; TCF1; Th17 cells; Treg; c-MAF; commensal-specific CD4 T cells; intestine; microbiota; mucosal immunology; segmented filamentous bacteria.


Conflict of interest statement

Declaration of interests H.H.W. is a scientific advisor of SNIPR Biome, Kingdom Supercultures and Fitbiomics, who were not involved in the study.

Figures
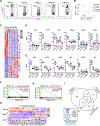
Figure 1.
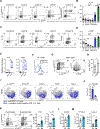
Figure 1.. SFB TH17 cells have an anti-inflammatory transcriptional program
(A) Intestinal lamina propria (LP) TH17 cells induced by various mechanisms. SI, small intestine; LI, large intestine; Colitis, CD45RBhi colitis. Representative FACS plots gated on TCRβ+CD4+ LP lymphocytes. (B) PCA plot of RNA-sequencing analysis of various intestinal LP TH17 cells. One experiment, N=2–3 mice/group. (C) Heatmap of core SFB TH17 cells program genes in bulk RNA-seq samples from (B). c-MAF controlled genes are also marked on the right. (D) Expression of selected cytokines and inhibitory receptors in LP TH17 cells in RNA-Seq data from (B). (E) Expression of selected transcription factors in LP TH17 cells in RNA-Seq data from (B). (F) Gene set enrichment analysis (GSEA) of genes upregulated in SFB TH17 cells compared to genes upregulated in exhausted CD4 T cells. (G) GSEA of genes upregulated in SFB TH17 cells compared to genes upregulated in mouse IL-10+ TH17 cells. (H) Expression of TR1 signature genes in various intestinal LP TH17 cells. (I) Venn Diagram of leading-edge genes from GSEA of genes upregulated in SFB TH17 cells and published datasets,,.
Figure 2.
Figure 2.. SFB TH17 cells express IL-10 and co-inhibitory receptors
(A, B) IL-10 expression in SI LP TH17 cells and Foxp3+ Tregs from Il10GFP/Il17aKatushka/Foxp3mRFP mice under various conditions. IL-17/IL-10 FACS plots in (A) gated on TCRβ+CD4+Foxp3mRFPneg lymphocytes. Foxp3/IL-10 FACS plot in (A) gated on TCRβ+CD4+IL-17Katushkaneg lymphocytes. (B) IL-10 (GFP) expression in TH17 (TCRβ+CD4+Foxp3mRFPnegIL-17Katushka+) or Treg (TCRβ+CD4+Foxp3mRFP+) cells. Three independent experiments, N=5–9 mice/group. (C, D) c-MAF expression (intracellular staining) in SI LP TH17 cells and Foxp3+ Tregs. FACS plots in (C) gated on TCRβ+CD4+ LP lymphocytes. (D) c-MAF expression in TH17 (TCRβ+CD4+IL-17+) or Treg (TCRβ+CD4+Foxp3+) cells. Two independent experiments, N=5–6 mice/group. (E) qPCR of Il10 and Maf transcripts in IL-10GFPneg and IL-10GFP+ SFB TH17 cells (TCRβ+CD4+Foxp3mRFPnegIL-17Katushka+) and IL-10GFPneg/IL-17Katushkaneg/Foxp3mRFPneg control (C) CD4 T cells FACS-purified from SI LP of Il10GFP/Il17aKatushka/Foxp3mRFP mice. Two independent experiments, N=2–5 mice/group. (F) Representative histograms of c-MAF expression (intracellular staining) in IL-10GFPneg and IL-10GFP+ TH17 cells and control CD4 T cells FACS-purified from SI LP of SFB-colonized Il10GFP/Il17aKatushka/Foxp3mRFP mice. Two independent experiments, N=2–5 mice/group. (G, H) Naive 7B8 SFB-specific TCR Tg CD4 T cells from 7B8 Il10GFP/Il17aKatushka/Foxp3mRFP mice were adoptively transferred into SFB-colonized congenic wild type mice. IL-10 (GFP) and c-MAF (intracellular staining) expression in transferred CD4 T cells was examined one week later. FACS plots gated on Ly5.1+CD4+TCRβ+Foxp3neg transferred 7B8 cells. Bar plots further gated on IL-17+ TH17 cells. Two independent experiments, N=5 mice. (I, J) tSNE analysis based on multi-parameter flow cytometry of IL-10 and co-inhibitory receptors (CIR) expression in SI LP TH17 cells from SFB-colonized (I, J) or Citrobacter rodentium (Crod) infected (J) Il10GFP/Il17aKatushka/Foxp3mRFP mice. Plots gated on Ly5.1+CD4+TCRβ+Foxp3mRFPnegIL-17Katushka+ cells. Two independent experiments, N=5 mice/group. (K) TH17 cell induction and IL-10 expression in SI LP TH17 cells from Il10GFP/Il17aKatushka/Foxp3mRFP mice after oral gavage of E. coli (Ec) or B. adolescentis (Ba) every other day for two weeks. IL-17/IL-10 FACS plots gated on TCRβ+CD4+Foxp3mRFPneg lymphocytes. Two independent experiments, N=4–5 mice/group. (L, M) c-MAF (intracellular staining) (L) and LAG-3 and CTLA-4 expression (M) in SI LP TH17 cells the experiments in (K). Two independent experiments, N=4–5 mice/group.
Figure 3.
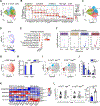
Figure 3.. c-MAF drives anti-inflammatory identity of intestinal commensal TH17 cells
(A) Intracellular staining for c-MAF in CD4 T (TCRβ+CD4+Foxp3mRFPneg) and TH17 (TCRβ+CD4+IL-17+) cells from SI LP of Foxp3mRFP/R26STOP-YFP/Il17aCre/Mafflox/flox (MafΔIL17) mice and Foxp3mRFP/R26STOP-YFP/Il17aCre/Mafflox/+ (WT) littermates. Three independent experiments, N=5–7 mice/group. (B) Frequency of TH17 cells (intracellular staining) in SI LP of WT and MafΔIL17 mice. Three independent experiments, N=7 mice/group. (C) IL-10GFP expression in SI LP TH17 cells and Foxp3+ Tregs from Il10GFP/Il17aKatushka/Foxp3mRFP/R26STOP-YFP/Il17aCre/Mafflox/flox (MafΔIL17) and littermate control (WT) mice. FACS plots gated on TCRβ+CD4+Foxp3mRFPnegIL-17Katushka+ (TH17) or TCRβ+CD4+Foxp3mRFP+ (Treg) lymphocytes. Two independent experiments, N=2–4 mice/group (D) Quantitative PCR of Il10, Areg, Tox, Ccl5 and Gzma mRNA in FACS-purified SI LP TH17 cells (TCRβ+CD4+Foxp3mRFPnegIL-17Katushka+) from WT and MafΔIL17 (Il10GFP/Il17aKatushka/Foxp3mRFP/R26STOP-YFP/Il17aCre/Mafflox/flox) mice. Two independent experiments, N=6–7 mice/group. (E) Intracellular staining for IL-17 and IFN-γ in (Left) CD4 T (TCRβ+CD4+) and (Right) TH17 (TCRβ+CD4+IL-17+) cells from SI LP of WT and MafΔIL17 (Foxp3mRFP/R26STOP-YFP/Il17aCre/Mafflox/flox) mice. Two independent experiments, N=6 mice/group. (F) Heatmap of selected SFB TH17 cell signature genes in scRNA-Seq of FACS-purified SI LP TH17 cells (TCRβ+CD4+Foxp3mRFPnegIL-17YFP+) from WT and MafΔIL17 (Foxp3mRFP/R26STOP-YFP/Il17aCre/Mafflox/flox) mice. One experiment, N=2–3 mice/group. (G) GSEA of top 200 upregulated genes in MafΔIL17 SI LP SFB TH17 cells (TCRβ+CD4+Foxp3mRFPnegIL-17YFP+) compared to genes upregulated in LI Crod TH17 cells and colitis TH17 cells in bulk RNA-Seq datasets in Figure 1.
Figure 4.
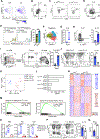
Figure 4.. Regulatory functions of commensal TH17 cells
(A) In vitro suppression assay. FACS-purified SI LP TH17 cells (TCRβ+CD4+ Foxp3mRFPnegIL-17GFP+) from SFB-colonized or Citrobacter rodentium infected (Crod) mice or Treg cells (TCRβ+CD4+Foxp3mRFP+) were co-cultured with WT naïve responder CD4 T cells from spleen of untreated mice as described in Methods. (Left) Proliferation of CTV-stained responder T cells (R) on Day 4. (Right) Percent suppression calculated as described in Methods. Cumulative of at least four independent experiments, N=2–3 technical replicates/experiment. Each dot represents a technical replicate. (B) Division index (see Methods) of CTV-labelled SFB and Crod LP TH17 cells in in vitro suppression assay. One experiment, N=3 mice/group and 2 technical replicates/mouse. Each dot represents a technical replicate. (C) Proliferation of WT responder CD4 T cells (R) alone or co-cultured with FACS-purified SI LP SFB TH17 cells (TCRβ+CD4+ Foxp3mRFPnegIL-17GFP+) in the presence of blocking anti-IL-10R antibody or isotype control. Five independent experiments, N=2–3 technical replicates/experiment. Significance, paired t-test. (D) Inhibition of proliferation of WT or Il10rb−/− responder CD4 T cells by purified WT SI LP SFB TH17 cells (TCRβ+CD4+ Foxp3mRFPnegIL-17GFP+). Three independent experiments, N=2–3 technical replicates/experiment. Significance, paired t-test. (E) Proliferation of WT responder CD4 T cells (R) alone or co-cultured with FACS-purified SI LP SFB TH17 cells (TCRβ+CD4+ Foxp3mRFPnegIL-17GFP+) in the presence of blocking anti-CTLA-4 antibody or isotype control. Four independent experiments, N=2–3 technical replicates/experiment. Significance, paired t-test. (F) Proliferation of WT responder CD4 T cells (R) alone or co-cultured with FACS-purified SI LP SFB TH17 cells (TCRβ+CD4+ Foxp3mRFPnegIL-17GFP+) in the presence of blocking anti-LAG3 antibody or isotype control. Three independent experiments, 2–3 technical replicates/experiment. Significance, paired t-test. (G) Proliferation of WT responder CD4 T cells (R) alone or co-cultured with SI LP SFB TH17 cells (TCRβ+CD4+Foxp3mRFPnegIL-17YFP+) from WT or MafΔIL17 mice. Cumulative of three independent experiments, N=2–3 technical replicates/experiment. Each datapoint represents a technical replicate. (H) Experimental schematic of in vivo suppression assay. (I-K) Expansion (I) and TH17 cell differentiation (J, K) of naïve 7B8 CD4 T cells (Ly5.1+) in SI LP 8 days after transfer into SFB colonized RAG1-deficient mice alone (C) or with co-transfer of SI LP Treg cells (TCRβ+CD4+Foxp3mRFP+) or SI LP SFB TH17 cells (TCRβ+CD4+IL-17GFP+) with and without neutralization of IL-10 signaling by intraperitoneal injection of an anti-IL-10R or isotype control antibody. (I, J, K) Plots gated on Ly5.1+TCRβ+CD4+ (7B8) SI LP lymphocytes. (I, K) Data was normalized to the average of the corresponding control group. Cumulative of six independent experiments, N=7–17 mice/group.
Figure 5.
Figure 5.. Commensal TH17 cells are heterogeneous and contain two IL-10+ populations
(A) UMAP clustering following scRNA-sequencing of 5721 SFB SI LP TH17 cells (TCRβ+CD4+Foxp3mRFPnegIL-17Katushka+) sorted from Il10GFP/Il17aKatushka/Foxp3mRFP reporter mice. (B) Functional grouping of SI LP TH17 cell clusters in (A) based on expression of select marker genes. (C) UMAP with annotation of the functional groups in (B). (D) Expression of Il10 in individual SFB SI LP TH17 cells overlayed over the UMAP clustering in (A). (E) Pathway analysis of differentially expressed genes between activated and inhibitory IL-10+ expressing groups. (F) COMPASS analysis for metabolic pathways in the two most differentiated IL-10+ UMAP clusters – C1 and C6. (G) GSEA for c-MAF target genes in individual SFB SI LP TH17 cells overlayed over the UMAP clustering in (A). (H) Expression of Il10 mRNA in indicated functional groups in SI LP SFB TH17 cells from WT (Foxp3mRFP/R26STOP-YFP/Il17aCre/Mafflox/+) and MafΔIL17 (Foxp3mRFP/R26STOP-YFP/Il17aCre/Mafflox/flox) mice, based on scRNA-Seq of SI LP TH17 cells sorted based on YFP expression. Based on the functional clustering in Figure S5B. SI LP SFB TH17 cells from individual mice were identified by hash-tagging of scRNA-Seq samples. N=2–3 mice/group. (I) Frequency of cells in clusters C7 (ex- TH17), C8 (inhibitory), and C10 (activated) based on the UMPA clustering in Figure S5A. Data from hash-tagged scRNA-Seq samples from WT and MafΔIL17 (Foxp3mRFP/R26STOP-YFP/Il17aCre/Mafflox/flox) mice. Data integrated from N=2–3 mice/group. (J) Statistics of (I) (K) Heatmap of z score of average expression of selected SFB TH17 signature genes and inflammatory genes in indicated functional groups based on UMAP in Figure S5B in hash-tagged scRNA-Seq samples from WT and MafΔIL17 (Foxp3mRFP/R26STOP-YFP/Il17aCre/Mafflox/flox) mice. (L) IL-17Katushka and ROSAYFP expression in (Left) CD4 T (TCRβ+CD4+Foxp3mRFPneg) and (Right) ex-TH17 (TCRβ+CD4+IL-17YFP+IL-17Katushkaneg) cells from SI LP of WT and MafΔIL17 Il10GFP/Il17aKatushkaFoxp3mRFP/R26STOP-YFP/Il17aCre/Mafflox/flox mice. N= 4 mice/group.
Figure 6.
Figure 6.. Commensal TH17 cells contain a progenitor TCF1+ population
(A) Expression of Tcf7 and Il7r mRNA in individual SFB SI LP TH17 cells overlayed over the UMAP clustering in Figure 5A. (B) TCF1 and IL-7R expression in SI LP SFB TH17 cells. Gated on TCRβ+CD4+IL-17+ lymphocytes. (C) Intracellular staining for TCF1 in FACS-purified IL-10GFPneg and IL-10GFP+ SI LP SFB TH17 cells (TCRβ+CD4+Foxp3mRFPnegIL-17Katushka+). (D) Intracellular staining for TCF1 and c-MAF in SI LP SFB TH17 cells. Gated on TCRβ+CD4+IL-17+ lymphocytes. (E) FACS-purified SI LP SFB progenitor TH17 cells (TCRβ+CD4+Foxp3mRFPnegIL-17Katushka+IL-10GFPnegIL-7R+) and SI LP SFB inhibitory TH17 cells (TCRβ+CD4+Foxp3mRFPnegIL-17Katushka+IL-10GFP+LAG-3+) were co-cultured with WT naïve responder CD4 T cells. (Left) Proliferation of CTV-stained responder T cells (R) on Day 4. (Right) Percent suppression. Cumulative of three independent experiments. Each dot represents a technical replicate. (F) Trajectory analysis of scRNA-Seq data in Figure 5A with a start node in C4. UMAP annotation as in Figure 5C. (G) Quantitative PCR for Il10 mRNA in FACS-purified TCF1mCherry+ and TCF1mCherryneg SI LP SFB TH17 cells from Tcf7mCherry/Il17aGFP mice. Two independent experiments, N=4 mice/group. (H) TCF1mCherry and IL-10Venus expression in SI LP SFB TH17 cells (TCRβ+CD4+IL-17GFP+) from Tcf7mCherry/Il17aGFP/Il10Venus mice. Two independent experiments, N=3 mice/group. (I) TCF1mCherry+IL-17AeGFP+ CD4 T cells were FACS-purified from SI LP of Tcf7mCherry/Il17aGFP mice (Ly5.1) and adoptively transferred into SFB-colonized WT mice (Ly5.2). TCF1 and IL-17 expression in transferred cells in SI LP was analyzed on Day 2 and Day 14 after transfer. Cumulative from several independent experiments, N=5 mice/group. (J) TCF1mCherry+IL-17GFP+IL-10Venusneg TH17 cells were FACS-purified from SI LP of SFB-colonized or LI LP of Citrobacter rodentium-infected mice and stimulated in vitro as described in Methods. (Left) IL-10Venus and IL-17GFP expression in CD4 T cells. (Right) Proportion of IL-10Venus+ cells in TCF1mCherrynegIL-17GFP+ TH17 cells on Day 4. Three independent experiments, N=2–7 mice/group. (K) PCA plot of bulk RNA-sequencing analysis of FACS-sorted TCF1mCherry+IL-17GFP+ and TCF1mCherrynegIL-17GFP+ TH17 cells from SI LP of SFB-colonized or LI LP of Citrobacter rodentium-infected (Crod) mice. One experiment, N=2–4 mice/group. (L) Number of differentially expressed genes (DEGs) in indicated pairwise comparisons of RNA-sequencing analysis in (K). One experiment, N=2–4 mice/group. (M) Gene set-enrichment analysis of genes (Left) upregulated in TCF1+ SFB TH17 cells compared to genes upregulated in total SFB TH17 cells or (Right) upregulated in TCF1+ Crod TH17 cells compared to total Crod TH17 cells. (N) Heatmap of DEGs arranged by the comparison between TCF1+ SFB and TCF1+ Crod TH17 cells. SFB core signature anti-inflammatory genes in blue and inflammatory genes in red are listed on the right. (O) Quantitative PCR for selected SFB signature genes in samples in K (P) TCF1mCherry+IL-17GFP+IL-10Venusneg TH17 cells were FACS-purified from SI LP of SFB-colonized mice and stimulated in vitro in with or without 10 ng/ml IL-1β and 10 ng/ml IL23. (Left) IL-10Venus and IL-17GFP expression in CD4 T cells. (Right) Proportion of IL-10Venus+ cells in TCF1mCherrynegIL-17GFP+ TH17 cells on Day 4. Two independent experiments, each dot represents a technical replicate. (Q) IFN-γ ELISA from in vitro cultures in (O). Two independent experiments, each dot represents a technical replicate.
Figure 7.
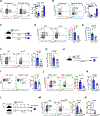
Figure 7.. IL-10 signaling in intestinal Mϕs drives generation of anti-inflammatory commensal TH17 cells in the terminal ileum
(A) Intracellular staining for TCF1 and IL-17 in duodenum (Duo) and terminal ileum (Ile) SI LP of SFB-colonized and SFB-negative WT mice. (Left) FACS plots from SFB-colonized mice, gated on TCRβ+CD4+ lymphocytes. (Right) Proportion of TCF1neg effector cells in TH17 cells, gated TCRβ+CD4+IL-17+ (Right). Two independent experiments, N=3 mice/group. (B) Distribution of IL-10GFP+ TH17 cells in duodenum (Duo) and terminal ileum (Ile) of SFB-colonized and SFB-negative Il10eGFP/Il17aKatushka/Foxp3mRFP mice. (Left) FACS plots from SFB-colonized mice gated on TCRβ+CD4+lymphocytes. (Right) Proportion of IL-10GFP+ cells in TH17 cells (TCRβ+CD4+IL-17Katushka+). Two independent experiments, N=4 mice/group. (C-E) Naïve SFB-specific 7B8 splenic CD4 T cells were purified from 7B8.Ly5.1 Il10GFP/Il17aKatushka/Foxp3mRFP mice and adoptively transferred into SFB-colonized Ly5.2 WT or Il10−/− mice (C). Expression of IL-10 (GFP) (D) and c-MAF (intracellular staining) (E) in SI LP one week after transfer. FACS plots in (D) gated on Ly5.1+TCRβ+CD4+Foxp3mRFPneg 7B8 CD4 T cells. Bar plots in (D) further gated on IL-17Katushka+ 7B8 TH17 cells. Bar plots in (E) further gated on IL-17+ transferred 7B8 TH17 cells. Cumulative of three independent experiments, N=5–6 mice/group. (F, G) Naïve SFB-specific 7B8 splenic CD4 T cells were purified from 7B8.Ly5.1 Il10GFP/Il17aKatushka/Foxp3mRFP mice and adoptively transferred into SFB-colonized WT or Cd4Cre/Il10flox/flox (Il10ΔT) mice. Expression of IL-10 (GFP) (F) and c-MAF (G) in SI LP one week after transfer. FACS plots in (F) gated on Ly5.1+TCRβ+CD4+Foxp3mRFP-neg 7B8 CD4 T cells. Bar plots further gated on IL-17Katushka+ (F) or IL-17+ (G) transferred 7B8 TH17 cells. Cumulative of two independent experiments, N=6–7 mice/group. (H) Experimental schematic. Naïve splenic CD4 T cells were purified from Il10GFP/Il17aKatushka/Foxp3mRFP (Ly5.2) WT or Il10rb−/− mice and adoptively transferred into SFB-colonized Ly5.1 WT mice. (I) IL-10 and c-MAF expression in transferred TH17 cells in SI LP two weeks after transfer from the mice in (H). FACS plots and bar plots gated on Ly5.2+TCRβ+CD4+Foxp3mRFPnegIL-17Katushka+ TH17 cells. Cumulative of four independent experiments, N=8 mice/group. (J, K) Naïve SFB-specific 7B8 splenic CD4 T cells were purified from 7B8.Ly5.1 Il10GFP/Il17aKatushka/Foxp3mRFP mice and adoptively transferred into SFB-colonized Ly5.2 WT or Il10rb−/− mice. IL-10 (GFP) (J) and c-MAF (K) expression in SI LP one week after transfer. FACS plots gated on Ly5.1+TCRβ+CD4+Foxp3mRFPneg transferred 7B8 T cells. Bar plots further gated on IL-17Katushka+ (J) or IL-17+ (K) transferred 7B8 TH17 cells. Cumulative of two independent experiments, N=4 mice/group. (L) Experimental schematic. Naïve SFB-specific 7B8 splenic CD4 T cells were purified from 7B8/Ly5.1 Il10GFP/Il17aKatushka/Foxp3mRFP mice and adoptively transferred into DT-treated SFB-colonized Ly5.2 WT BM chimeras, reconstituted with 1:1 mix of BM from Ccr2DTR mice and either WT or Il10rb−/− mice. DT treatment was performed to deplete Ccr2DTR macrophages as described in Methods. (M) IL-10 (GFP) expression in SI LP one weeks after transfer from the mice in (L). FACS plots gated on Ly5.1+TCRβ+CD4+Foxp3mRFPneg transferred 7B8 CD4 T cells. Bar plots further gated on IL-17Katushka+ transferred 7B8 TH17 cells. Cumulative of two independent experiments, N=8–9 mice/group. (N) Quantitative PCR of Maf transcripts in FACS-purified transferred SI LP 7B8 TH17 cells (Ly5.1+TCRβ+CD4+Foxp3mRFPnegIL-17GFP+) from the mice in (L). Cumulative of two independent experiments, N=3 mice/group.

References

    1. Ivanov II, Tuganbaev T, Skelly AN, and Honda K (2022). T Cell Responses to the Microbiota. Annual review of immunology 40, 559–587. 10.1146/annurev-immunol-101320-011829. - DOI - PMC - PubMed
    1. Hooper LV, Littman DR, and Macpherson AJ (2012). Interactions between the microbiota and the immune system. Science 336, 1268–1273. 10.1126/science.1223490. - DOI - PMC - PubMed
    1. Lathrop SK, Bloom SM, Rao SM, Nutsch K, Lio CW, Santacruz N, Peterson DA, Stappenbeck TS, and Hsieh CS (2011). Peripheral education of the immune system by colonic commensal microbiota. Nature 478, 250–254. 10.1038/nature10434. - DOI - PMC - PubMed
    1. Atarashi K, Tanoue T, Oshima K, Suda W, Nagano Y, Nishikawa H, Fukuda S, Saito T, Narushima S, Hase K, et al. (2013). Treg induction by a rationally selected mixture of Clostridia strains from the human microbiota. Nature 500, 232–236. 10.1038/nature12331. - DOI - PubMed
    1. Nutsch KM, and Hsieh CS (2012). T cell tolerance and immunity to commensal bacteria. Current opinion in immunology 24, 385–391. 10.1016/j.coi.2012.04.009. - DOI - PMC - PubMed

Publication types