. 2023 Dec 1;11(12):e007447.
doi: 10.1136/jitc-2023-007447.

Targeting integrin α5 in fibroblasts potentiates colorectal cancer response to PD-L1 blockade by affecting extracellular-matrix deposition

Affiliations

Targeting integrin α5 in fibroblasts potentiates colorectal cancer response to PD-L1 blockade by affecting extracellular-matrix deposition

Ling Lu et al. J Immunother Cancer. .

Abstract

Background: One reason patients with cancer cannot benefit from immunotherapy is the lack of immune cell infiltration in tumor tissues. Cancer-associated fibroblasts (CAFs) are emerging as central players in immune regulation that shapes tumor microenvironment (TME). Earlier we reported that integrin α5 was enriched in CAFs in colorectal cancer (CRC), however, its role in TME and cancer immunotherapy remains unclear. Here, we aimed to investigate the role for integrin α5 in fibroblasts in modulating antitumor immunity and therapeutic efficacy combined with checkpoint blockade in CRC.

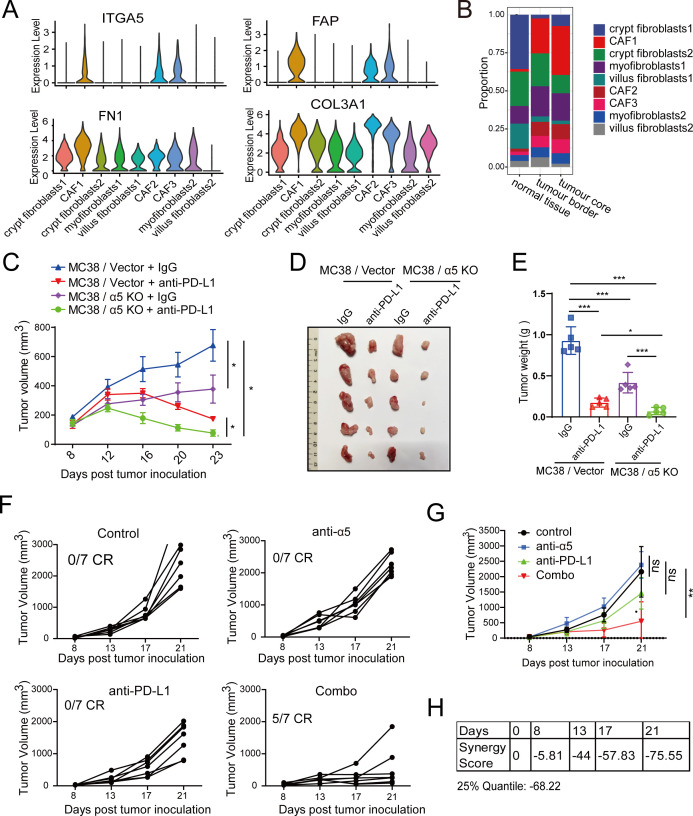
Methods: We analyzed the CRC single-cell RNA sequencing (scRNA-seq) database to define the expression of ITGA5 in CRC tumor stroma. Experimentally, we carried out in vivo mouse tumor xenograft models to confirm the targeting efficacy of combined α5β1 inhibition and anti-Programmed death ligand 1 (PD-L1) blockade and in vitro cell-co-culture assay to investigate the role of α5 in fibroblasts in affecting T-cell activity. Clinically, we analyzed the association between α5 expression and infiltrating T cells and evaluated their correlation with patient survival and immunotherapy prognosis in CRC.

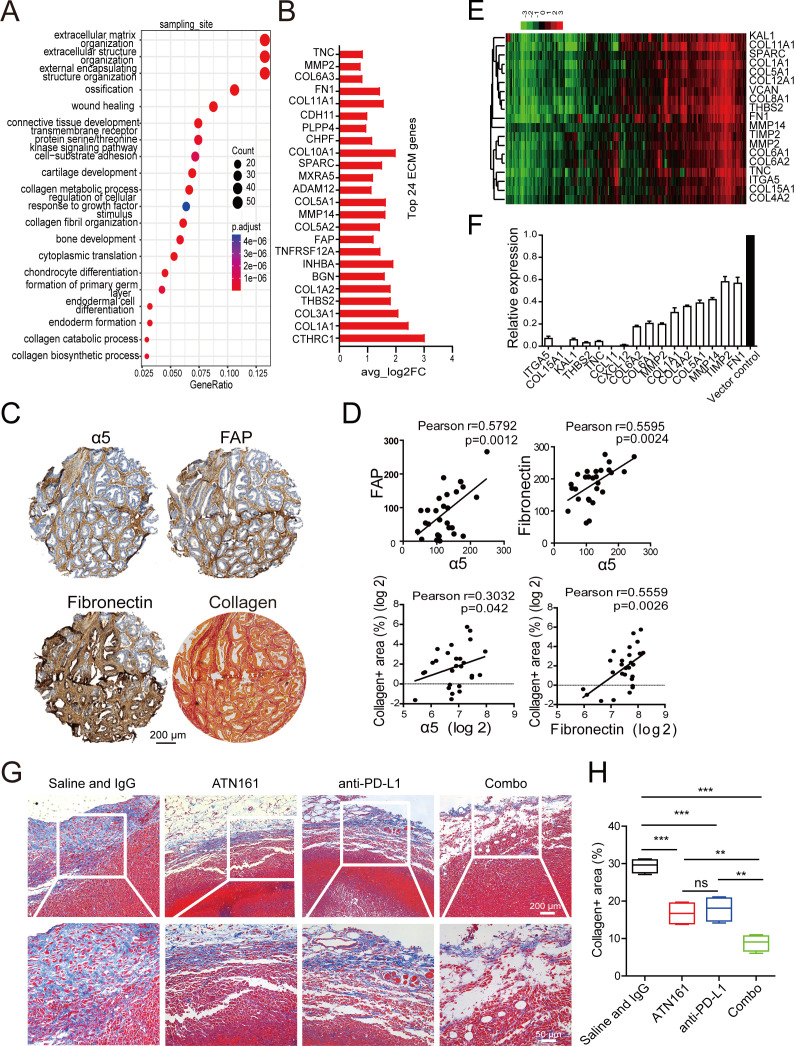
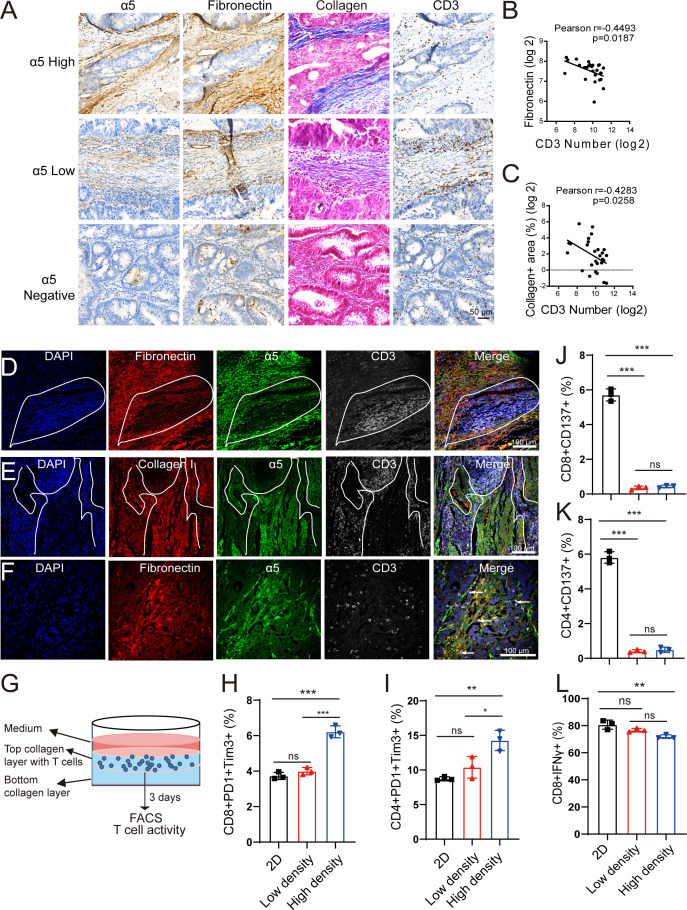
Results: We revealed that ITGA5 was enriched in FAP-CAFs. Both ITGA5 knockout fibroblasts and therapeutic targeting of α5 improved response to anti-PD-L1 treatment in mouse subcutaneous tumor models. Mechanistically, these treatments led to increased tumor-infiltrating CD8+ T cells. Furthermore, we found that α5 in fibroblasts correlated with extracellular matrix (ECM)-related genes and affected ECM deposition in CRC tumor stroma. Both in vivo analysis and in vitro culture and cell killing experiment showed that ECM proteins and α5 expression in fibroblasts influence T-cell infiltration and activity. Clinically, we confirmed that high α5 expression was associated with fewer CD3+ T and CD8+ T cells, and tissues with low α5 and high CD3+ T levels correlated with better patient survival and immunotherapy response in a CRC cohort with 29 patients.

Conclusions: Our study identified a role for integrin α5 in fibroblasts in modulating antitumor immunity by affecting ECM deposition and showed therapeutic efficacy for combined α5β1 inhibition and PD-L1 blockade in CRC.

Keywords: Biomarkers, Tumor; CD8-Positive T-Lymphocytes; Immunomodulation; Immunotherapy; Tumor Microenvironment.


Conflict of interest statement

Competing interests: None declared.

Figures

Figure 1
Figure 1
Targeting integrin α5 in fibroblasts potentiates colorectal cancer response to PD-L1 blockade. (A) Violin plots showing ITGA5 expression levels in CAF subclusters of fibroblasts in colorectal cancer scRNA-seq database. (B) Proportions of different fibroblast populations in normal tissues, tumor border and tumor core. (C–E) α5 deletion in fibroblasts enhances responsiveness to anti-PD-L1 treatment. Mouse MC38 cells were co-transplanted with mouse fibroblasts (vector control or α5 KO) subcutaneously into C57BL/6 mice on day 0, anti-PD-L1 antibody or isotype IgG were administrated four times every 4 days starting from day 8, followed by examining tumor growth. (C) Average tumor growth curves (n=5 mice per group; *p<0.05, two-way ANOVA with Bonferroni’s post-tests). The x axis represents days after implantation. (D) Photographs of dissected tumor samples, and (E) tumor weight on day 23 after implantation. n=5 mice per group. Error bars, mean±SEM; *p<0.05, **p<0.01, ***p<0.001; ns, not significant; one-way ANOVA. (F, G, H) Tumor regression following therapeutic anti-α5 and anti-PD-L1 treatment in CT26.WT tumors. CT26.WT cells were injected subcutaneously, and tumor volume was monitored two times a week. Mice were grouped when the tumor volume reached approximately ~100 mm3, anti-PD-L1 and anti-α5 were administered intraperitoneally two times a week from day 8 to day 21. (F) Tumor growth curves (n=7 per each group). (G) Average tumor growth curves (n=7 mice each group; mean±SEM; ns, not significant; **p<0.01; two-way ANOVA with Bonferroni’s post-tests). (H) Analysis using SynergyFinder V.3.0 showed synergistic combinations of anti-PD-L1 and anti-α5 on day 21. ANOVA, analysis of variance; CAFs, cancer-associated fibroblasts; CR, complete response; PD-L1, programmed death ligand 1; scRNA-seq, single-cell RNA sequencing.
Figure 2
Figure 2
Targeting integrin α5 in fibroblasts combine with anti-PD-L1 treatment enriched CD8+ T cells in subcutaneous tumors. Flow cytometry quantification of (A) the frequency of CD3+, (B) CD8+IFN-γ+ and (C) CD4+Foxp3+of total CD45+ cells, and (D) ratio of effector CD8/Treg in tumor tissues. (E, F) Representative IHC staining of CD3 and Masson’s trichrome staining of collagen in tumor periphery (E) and tumor center (F). Scale bar: 100 µm. (G) Quantification of tumor-infiltrating CD3+ T lymphocytes localization by IHC. (H) Quantification of per cent collagen area per field of tumor tissues by Masson’s trichrome staining. n=5 mice per group. Error bars, mean±SEM; *p<0.05, **p<0.01, ***p<0.001; ns, not significant; one-way ANOVA. (I–K) Flow cytometry quantification of the frequency of (I) CD8+IFN-γ+, (J) CD4+Foxp3+ and ratio of (K) effector CD8/Treg in tumor tissues following therapeutic anti-α5 and anti-PD-L1 treatment in CT26.WT tumors. n=7 mice each group. Error bars, mean±SEM; **p<0.01, **p<0.001; ns, not significant; one-way ANOVA. ANOVA, analysis of variance; IFN, interferon; IHC, immunohistochemistry; PD-L1, programmed death ligand 1;Treg, regulatory T cell.
Figure 3
Figure 3
α5 in fibroblasts affects the levels of ECM proteins deposition in CRC stroma. (A) Top biological processes of GO analysis with the upregulated gene clustered in ITGA5+CAFs compared with that of non-CAFs in CRC scRNA-seq database. (B) Top significant ECM genes in ITGA5+CAFs population. (C) Representative IHC staining of α5 and CAFs markers in colorectal adenocarcinoma tissues. Scale bar: 200 µm. (D) Pearson’s correlation between the expressions of α5 and CAFs or ECM markers in 29 colorectal adenocarcinoma tissues evaluated by IHC. (E) Heatmap showing association of mRNA expression in 517 colorectal adenocarcinomas extracted from TCGA database between ITGA5 and 18 ECM genes that are statistically significant (p<0.05) by Pearson’s correlation. (F) Differential mRNA expression of ECM genes in CCD-18Co cells after ITGA5 depletion evaluated by qPCR in triplicate. Each gene expression was relative to vector control (set at 1.0), statistically significant (p<0.05) by Student’s t-test. (G) Representative Masson’s trichrome staining of collagen in tumor tissues approaching tumor border following therapeutic anti-α5 and anti-PD-L1 treatment in CT26.WT tumors. Scale bar: 200 µm. (H) Quantification of per cent collagen area per field of tumor tissues using Masson’s trichrome staining. n=7 mice per group. Error bars, mean±SEM; *p<0.05, **p<0.01; ***p<0.001; ns, not significant; one-way analysis of variance. CAFs, cancer-associated fibroblasts; CRC, colorectal cancer; ECM, extracellular matrix; GO analysis, gene ontology analysis; IHC, immunohistochemistry; mRNA, messenger RNA; PD-L1, programmed death ligand 1; scRNA-seq, single-cell RNA sequencing. TCGA,
Figure 4
Figure 4
ECM deposition affects the tissue localization and activity of T cells. (A) Representative of IHC and Masson’s trichrome staining of α5, fibronectin, CD3 and collagen in human colorectal adenocarcinoma tissues. Scale bar: 50 µm. (B) Pearson’s correlation between the level of fibronectin and CD3+ T-cell count in 29 colorectal adenocarcinoma tissues evaluated by IHC. (C) Pearson’s correlation between the level of collagen and CD3+ T-cell count in 29 colorectal adenocarcinoma tissues. Quantification of collagen deposition using Masson’s trichrome staining, quantification of CD3 positive cells number per field by IHC. Data were analyzed using log2 values. (D, E, F) Distribution of T cells in relation to α5 expression and ECM fibers in human colorectal adenocarcinoma tissues. Representative immunofluorescence staining of human colorectal adenocarcinoma sections with fibronectin (D) or collagen (E) (red), CD3 (T cells, white) and α5 (cancer-associated fibroblasts, green), with white dashed lines showing more aggregation of T cells in areas with sparse fibronectin/collagen fibrils, with white arrows showing T cells were directly in contact with α5 expression cells and fibronectin fibers (F). Scale bar: 100 µm. (G) Schematic model of the collagen matrix culture system. (H–L) Flow cytometry quantification of the percentage of CD8+ PD-1+ Tim-3+ (H) CD4+ PD-1+ Tim-3+ (I) CD8+ CD137+ (J) CD4+ CD137+ (K) CD8+IFN-γ+ (L) of CD3+ T cells harvested from 2D culture or collagen matrix. Error bars, mean±SEM; *p<0.05, **p<0.01, ***p<0.001; ns, not significant; one-way analysis of variance. 2D, two-dimensional; DAPI, 4′,6-diamidino-2-phenylindole; ECM, extracellular matrix; FACS,flow cytometry analysis; IFN, interferon; IHC, immunohistochemistry; PD-1, programmed cell death protein 1; Tim-3, T-cell immunoglobulin and mucin domain 3.
Figure 5
Figure 5
α5 KO impairs the protumor growth effect of fibroblasts in organoids and affects the killing function of T cells. (A) Representative image of human organoid and co-cultures in the presence of fibroblasts CCD-18Co cells at day 14. Scale bars: top row, 200 µm; bottom row: 100 µm. (B) Diameters of human organoids cultured with or without fibroblasts (n=5; 10 organoids for each well randomly were measured). (C, D) Quantification of the tumor organoid killing assay. (C) Flow cytometry showing tumor cell activity after 72 hours incubation with CD3+ T-cell populations, in the presence or absence of fibroblast CCD-18Co. Live tumor cells were assessed as the percentage of cells defined as Organoids cells-CellTracker Red+; Zombie-NIR-A. Gating strategy is shown. (D) Flow cytometry quantification of the percentage of live tumor cells. Organoids cells, single tumor cells digested from organoids; (E) schematic model of fibroblasts and CD3+ T cells co-culture system and human cancer cell killing assay. (F–G) Flow cytometry quantification of the frequency of CD4+CD137+ (F) and CD8+CD137+(G) of CD3+ T cells after 4 days culture alone or with fibroblasts-CCD-18Co. (H) Flow cytometry quantification of the percentage of live cancer cells. (I–K) Flow cytometry quantification of the frequency of CD8+IFN-γ+ (I) CD8+ PD-1+ Tim-3+ (J) CD4+ PD-1+ Tim-3+ (K) of CD3+ T cells harvested from co-cultures with HTC116. Vector ctrl, CCD-18Co cells transfected with plasmid vector control; α5 KO, CCD-18Co cells with α5 knockout. Error bars, mean±SEM; *p<0.05, **p<0.01, ***p<0.001; ns, not significant; one-way analysis of variance.FACS, flow cytometry analysis; IFN, interferon; PD-1, programmed cell death protein 1; Tim-3, T-cell immunoglobulin and mucin domain 3.
Figure 6
Figure 6
α5 expression is significantly correlated with T-cell infiltration in colorectal cancer (CRC) and associated with immunotherapy prognosis. (A) Pearson’s correlation of α5 expression with immune infiltration level in CRC evaluated by IHC. Data were analyzed using log2 values. (B, C) Overall survival analysis of patients with CRC (n=237). (D) Tumor progression-free survival analysis of patients with CRC after PD-1 blockade therapy (n=29). Survive curves were analyzed using the Kaplan-Meier method and compared among groups using the log-rank test. *p<0.05, **p<0.01. ns, not significant. (E) Rate of response to anti-PD-1 treatment in α5 low/CD3 high group and the others in the CRC cohort (n=26). Patients without signs of progression within 4 months after PD-1 blockade treatment were defined as responders, while patients who progressed within 4 months after PD-1 blockade treatment were defined as non-responders. α5 low/ CD3 high group (5 responders and 1 non-responders), the others (7 responders and 13 non-responders). Data were analyzed by a two-sided Fisher’s exact test. FITC, fluorescein; FACS, flow cytometry analysis; IFN, interferon; PD-1, programmed cell death protein 1.

References

    1. Beauchemin N. The colorectal tumor Microenvironment: the next decade. Cancer Microenviron 2011;4:181–5. 10.1007/s12307-011-0074-7 - DOI - PMC - PubMed
    1. Bahrami A, Khazaei M, Hassanian SM, et al. . Targeting the tumor Microenvironment as a potential therapeutic approach in colorectal cancer: rational and progress. J Cell Physiol 2018;233:2928–36. 10.1002/jcp.26041 - DOI - PubMed
    1. Tosolini M, Kirilovsky A, Mlecnik B, et al. . Clinical impact of different classes of infiltrating T cytotoxic and helper cells (Th1, Th2, Treg, Th17) in patients with colorectal cancer. Cancer Res 2011;71:1263–71. 10.1158/0008-5472.CAN-10-2907 - DOI - PubMed
    1. Tada K, Kitano S, Shoji H, et al. . Pretreatment immune status correlates with progression-free survival in chemotherapy-treated metastatic colorectal cancer patients. Cancer Immunol Res 2016;4:592–9. 10.1158/2326-6066.CIR-15-0298 - DOI - PubMed
    1. Pagès F, Berger A, Camus M, et al. . Effector memory T cells, early metastasis, and survival in colorectal cancer. N Engl J Med 2005;353:2654–66. 10.1056/NEJMoa051424 - DOI - PubMed

Publication types