. 2023 Dec 1;14(1):7945.
doi: 10.1038/s41467-023-43522-6.

Haplotype-based inference of recent effective population size in modern and ancient DNA samples

Affiliations

Haplotype-based inference of recent effective population size in modern and ancient DNA samples

Romain Fournier et al. Nat Commun. .

Abstract

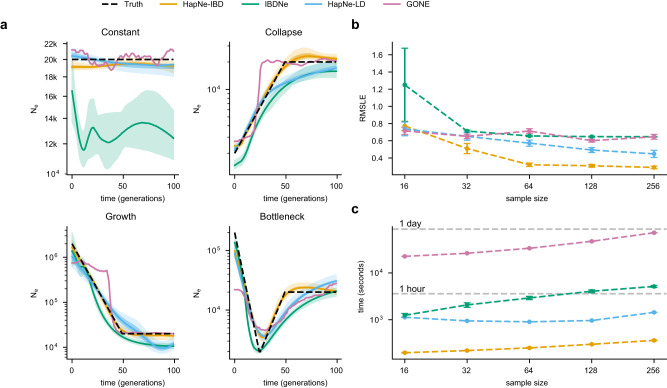
Individuals sharing recent ancestors are likely to co-inherit large identical-by-descent (IBD) genomic regions. The distribution of these IBD segments in a population may be used to reconstruct past demographic events such as effective population size variation, but accurate IBD detection is difficult in ancient DNA data and in underrepresented populations with limited reference data. In this work, we introduce an accurate method for inferring effective population size variation during the past ~2000 years in both modern and ancient DNA data, called HapNe. HapNe infers recent population size fluctuations using either IBD sharing (HapNe-IBD) or linkage disequilibrium (HapNe-LD), which does not require phasing and can be computed in low coverage data, including data sets with heterogeneous sampling times. HapNe shows improved accuracy in a range of simulated demographic scenarios compared to currently available methods for IBD-based and LD-based inference of recent effective population size, while requiring fewer computational resources. We apply HapNe to several modern populations from the 1,000 Genomes Project, the UK Biobank, the Allen Ancient DNA Resource, and recently published samples from Iron Age Britain, detecting multiple instances of recent effective population size variation across these groups.


Conflict of interest statement

The authors declare no competing interests.

Figures

Fig. 1
Fig. 1. Benchmarks in simulated modern populations.
a Ne estimates obtained from HapNe-IBD, IBDNe, HapNe-LD, and GONE on simulated SNP-array data (256 individuals) for four different demographic scenarios. The light and dark-shaded areas correspond to 95% and 50% confidence intervals estimated using bootstrap quantiles. b Accuracy of the different methods on the “Bottleneck" demographic model as a function of sample size. c Total running time for each method (including IBD segment detection and within-chromosome LD estimation, see Methods). In (b and c), we report the mean value across ten independent simulations as well as error bars representing 1.96 × s.e.m.
Fig. 2
Fig. 2. Effects of phasing, genotyping error, and population structure on population size inference.
These show inference results for computationally phased genotypes from 256 simulated diploid samples N, using genotyping error rates of 0% in (a), 0.1% in (b), and 1% in (c). LD-based inference remained more robust across different demographic models and error rates. Inferred models for IBD-based methods were shifted up compared to simulations with no error (see Fig. 1). d This shows a demographic model used in simulations involving recent admixture. The dataset contains 100 diploid individuals sampled from a population that originates from an admixture event at time Tadm between two populations separating at time Tsplit (see Methods). The global effective population size (defined in Supplementary Note, Section 1.1.8) is shown using dashed black lines. Inference results for Tadm = 25 and different values of the fixation index Fst between populations A and B is shown in (e) and (f). The light and dark-shaded areas correspond to 95% and 50% confidence intervals estimated using bootstrap quantiles.
Fig. 3
Fig. 3. Results in simulated aDNA data.
a HapNe-LD inference results for simulated aDNA-like data under the “Bottleneck" demographic scenario (dashed lines) where the number s of simulated samples and fraction m of missing SNPs, or equivalently the coverage C, are varied (see Methods). b RMSLE over the first 50 generations for different coverage levels. c Comparison of the accuracy of HapNe-LD based on two sequencing strategies. The orange line reports RMSLE for high coverage data (m = 0, C = 30) with varying sample size s. The blue line reports RMSLE for fixed s = 256 and varying coverage. d HapNe-LD and GONE inference results for a simulation where individuals from a population of constant size of Ne = 20,000 are uniformly sampled over an interval ΔT = 10 generations (gray shaded area). In panels a and d, the light and dark-shaded areas correspond to 95% and 50% confidence intervals estimated using bootstrap quantiles. In (b, c), we report the mean value across ten independent simulations as well as error bars representing 1.96 × s.e.m.
Fig. 4
Fig. 4. HapNe-IBD and HapNe-LD estimates of recent effective population sizes in modern populations.
a Inference results for three postcodes: Glasgow (G), s = 14,724; Edinburgh (EH), s = 9981; and Llandudno (LL), s = 2089 from the UK Biobank data set. The vertical dashed line corresponds to the estimated date of the Black Death in the UK (1348, ref. ). HapNe results are converted to years assuming 29 years per generation. The shaded gray area depicts how the placement of the Black Death would shift with respect to the inferred demographic models if values between 23 and 35 years per generation were assumed. b Inference results for three populations (Finnish, European, FIN, s = 99; Kinh in Ho Chi Minh City, Vietnam, South Asian, KHV, s = 99; Yoruba in Ibadan, Nigeria, African, YRI, s = 108) from the 1000 Genomes Project. The light and dark-shaded areas correspond to 95% and 50% confidence intervals estimated using bootstrap quantiles.
Fig. 5
Fig. 5. HapNe-LD estimates of recent effective population sizes in ancient populations.
a Analysis of 49 Middle to Late Iron Age individuals from South England, compared to a subset of 14 individuals from Hampshire, and to 24 individuals related to the Arras culture near Yorkshire. b Inference based on 22 Viking samples found in modern Norway (blue) and 28 found in Gotland, a Swedish island (red). c Effective population size inference based on 71 unrelated individuals from the Caribbean Ceramic clade and 18 from the Dominican South-East coast subclade. The dark-gray shaded area corresponds to the estimated date for the transition from the Archaic to Ceramic culture in the region. The light and dark-colored shaded areas correspond to 95% and 50% confidence intervals estimated using bootstrap quantiles. The light gray-shaded area depicts how the placement of this transition would shift with respect to the inferred demographic models if values between 25 and 35 years per generation were assumed. The dots on the maps represent the location of the samples. The figure was made with Natural Earth. Free vector and raster map data @ naturalearthdata.com.

References

    1. Charlesworth, B. Effective population size and patterns of molecular evolution and variation. Nat. Rev. Genet.10, 195–205 (2009). - PubMed
    1. Wright, S. Evolution in Mendelian populations. Genetics16, 97–159 (1931). - PMC - PubMed
    1. Wright, S. Inbreeding and homozygosis. Proc. Natl Acad. Sci.19, 411–420 (1933). - PMC - PubMed
    1. Pickrell, J. K. & Reich, D. Toward a new history and geography of human genes informed by ancient DNA. Trends Genet.30, 377–389 (2014). - PMC - PubMed
    1. Nielsen, R. et al. Tracing the people of the world through genomics. Nature541, 302–310 (2017). - PMC - PubMed

Publication types