

Accurate and efficient estimation of local heritability using summary statistics and the linkage disequilibrium matrix
- PMID: 38040712
- PMCID: PMC10692177
- DOI: 10.1038/s41467-023-43565-9
Accurate and efficient estimation of local heritability using summary statistics and the linkage disequilibrium matrix
Abstract
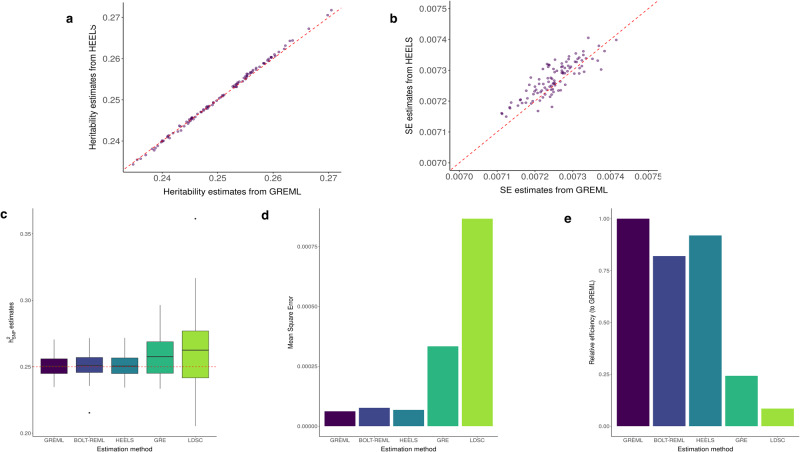
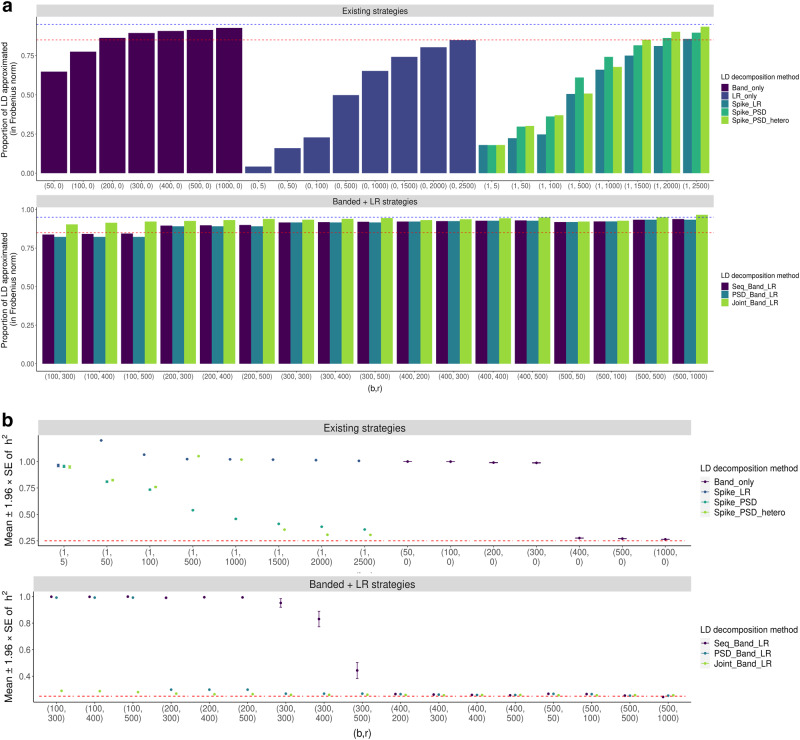
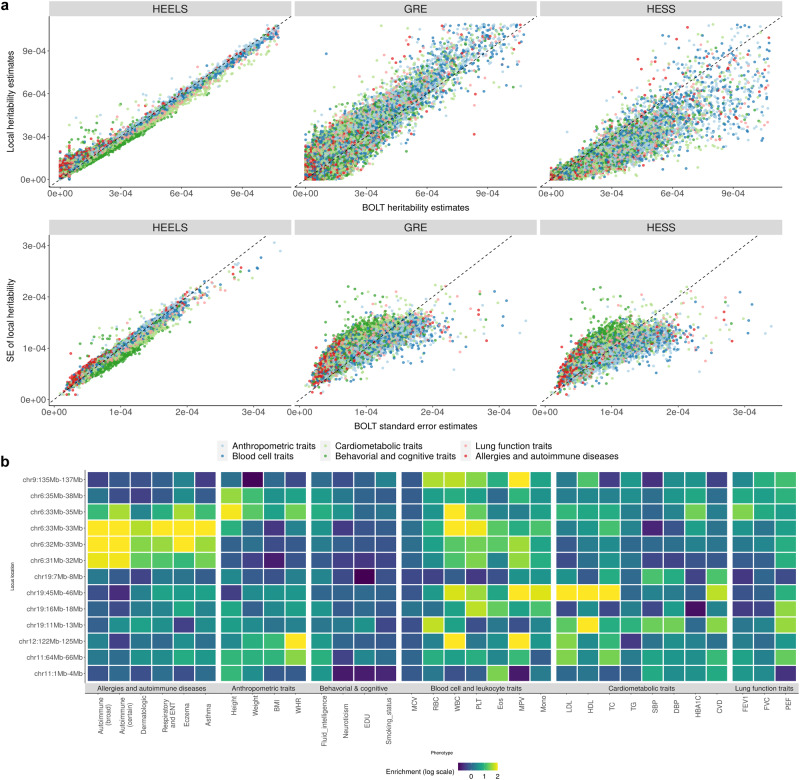
Existing SNP-heritability estimators that leverage summary statistics from genome-wide association studies (GWAS) are much less efficient (i.e., have larger standard errors) than the restricted maximum likelihood (REML) estimators which require access to individual-level data. We introduce a new method for local heritability estimation-Heritability Estimation with high Efficiency using LD and association Summary Statistics (HEELS)-that significantly improves the statistical efficiency of summary-statistics-based heritability estimator and attains comparable statistical efficiency as REML (with a relative statistical efficiency >92%). Moreover, we propose representing the empirical LD matrix as the sum of a low-rank matrix and a banded matrix. We show that this way of modeling the LD can not only reduce the storage and memory cost, but also improve the computational efficiency of heritability estimation. We demonstrate the statistical efficiency of HEELS and the advantages of our proposed LD approximation strategies both in simulations and through empirical analyses of the UK Biobank data.
© 2023. The Author(s).
Conflict of interest statement
X.L. is a consultant of AbbVie Pharmaceuticals and Verily Life Sciences. The remaining authors declare no competing interests.
Figures
Update of
-
Accurate and Efficient Estimation of Local Heritability using Summary Statistics and LD Matrix.bioRxiv [Preprint]. 2023 Mar 22:2023.02.08.527759. doi: 10.1101/2023.02.08.527759. bioRxiv. 2023. Update in: Nat Commun. 2023 Dec 2;14(1):7954. doi: 10.1038/s41467-023-43565-9. PMID: 36798290 Free PMC article. Updated. Preprint.
Similar articles
-
Accurate and Efficient Estimation of Local Heritability using Summary Statistics and LD Matrix.bioRxiv [Preprint]. 2023 Mar 22:2023.02.08.527759. doi: 10.1101/2023.02.08.527759. bioRxiv. 2023. Update in: Nat Commun. 2023 Dec 2;14(1):7954. doi: 10.1038/s41467-023-43565-9. PMID: 36798290 Free PMC article. Updated. Preprint.
-
Leveraging LD eigenvalue regression to improve the estimation of SNP heritability and confounding inflation.Am J Hum Genet. 2022 May 5;109(5):802-811. doi: 10.1016/j.ajhg.2022.03.013. Epub 2022 Apr 13. Am J Hum Genet. 2022. PMID: 35421325 Free PMC article.
-
PRED-LD: efficient imputation of GWAS summary statistics.BMC Bioinformatics. 2025 Apr 16;26(1):107. doi: 10.1186/s12859-025-06119-y. BMC Bioinformatics. 2025. PMID: 40240925 Free PMC article.
-
A review of SNP heritability estimation methods.Brief Bioinform. 2022 May 13;23(3):bbac067. doi: 10.1093/bib/bbac067. Brief Bioinform. 2022. PMID: 35289357 Review.
-
Heritability Estimation Approaches Utilizing Genome-Wide Data.Curr Protoc. 2023 Apr;3(4):e734. doi: 10.1002/cpz1.734. Curr Protoc. 2023. PMID: 37068172 Free PMC article. Review.
Cited by
-
Unravelling the genetic architecture of cerebral small vessel disease in the context of stroke.J Cereb Blood Flow Metab. 2025 Aug 6:271678X251362977. doi: 10.1177/0271678X251362977. Online ahead of print. J Cereb Blood Flow Metab. 2025. PMID: 40770913 Free PMC article. Review.
-
The goldmine of GWAS summary statistics: a systematic review of methods and tools.BioData Min. 2024 Sep 5;17(1):31. doi: 10.1186/s13040-024-00385-x. BioData Min. 2024. PMID: 39238044 Free PMC article.
-
Genome-wide association analysis of fleece traits in Northwest Xizang white cashmere goat.Front Vet Sci. 2024 May 30;11:1409084. doi: 10.3389/fvets.2024.1409084. eCollection 2024. Front Vet Sci. 2024. PMID: 38872797 Free PMC article.
-
A polygenic risk score model for psoriasis based on the protein interactions of psoriasis susceptibility loci.Front Genet. 2024 Nov 6;15:1451679. doi: 10.3389/fgene.2024.1451679. eCollection 2024. Front Genet. 2024. PMID: 39568675 Free PMC article.
-
Local genetic correlation via knockoffs reduces confounding due to cross-trait assortative mating.Am J Hum Genet. 2024 Dec 5;111(12):2839-2848. doi: 10.1016/j.ajhg.2024.10.012. Epub 2024 Nov 14. Am J Hum Genet. 2024. PMID: 39547235 Free PMC article.
References
Publication types
MeSH terms
Grants and funding
LinkOut - more resources
Full Text Sources
Research Materials
