. 2023 Dec 1;14(1):7953.
doi: 10.1038/s41467-023-43734-w.

All-fiber frequency agile triple-frequency comb light source

Affiliations

All-fiber frequency agile triple-frequency comb light source

Eve-Line Bancel et al. Nat Commun. .

Abstract

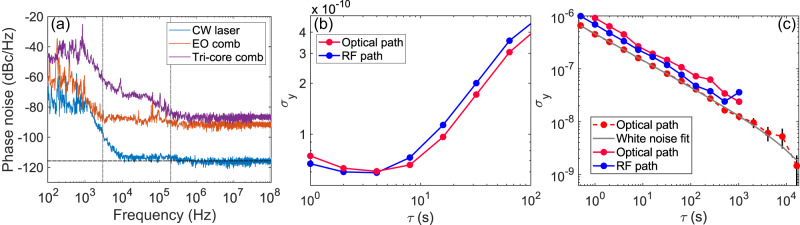
Tricomb spectroscopy unveils a new dimension to standard linear and nonlinear spectroscopic analysis, offering the possibility to reveal the almost real-time evolution of complex systems with unprecedented accuracy. Current triple comb configurations are based on the use of mode-locked lasers, which impose constraints on the comb parameters, and require complex electronic synchronization, thus limiting potential applications. In this paper, we present the experimental demonstration of a new type of all-fiber, self-phase-locked, frequency-agile tri-comb light source. It is based on the nonlinear spectral broadening of three electro-optic modulator-based frequency combs in a three-core fiber. The exploitation of spatial multiplexing of light in optical fibers offers new possibilities to generate broadband-frequency combs that are highly coherent with each other. After characterizing the stability of the source and performing several dual-comb test measurements, we revealed the high mutual coherence between the three combs through the demonstration of a 2-D pump-probe four-wave mixing spectroscopy experiment.


Conflict of interest statement

The authors declare no competing interests.

Figures

Fig. 1
Fig. 1. Experimental set-up.
a Simplified sketch of the experimental setup. b Scanning electron microscope image of the tri-core fiber. c)Measured tri-core input spectrum with a high-resolution optical spectrum analyzer (20 MHz resolution). d Tri-core input temporal shape measured with an optical sampling oscilloscope (700 GHz bandwidth). eg Output spectra for each core. Insets show a zoom on the spectra. CW continuous wave, MOD intensity modulators, AOM Acousto-optic modulator.
Fig. 2
Fig. 2. Frequency stability of Comb2.
a Uncorrelated phase noise. Measured SSB phase noise at 500 MHz carrier frequency wave, at different stages of the setup. At the CW laser output (blue curve), at the tri-core fiber input (orange curve), and at the output (purple curve). The gray dotted lines delimit the different noise regions. The horizontal black dash-line indicates the thermal noise threshold of the photo-detection. b Allan deviation of frep at 500 MHz for τ0 = 1 s for the RF output (blue curve) and the optical output (red curve). c Allan deviation of δfrep at 50 kHz between Comb1 and Comb 3 for τ0 = 100 ms and τend = 1 h for the RF output (blue curve) and the optical output (red curve). A longer measurement (τend = 12 h) is depicted in red dotted line, with the 1-σ error bars at each point and the corresponding τ−1/2 characteristic white noise fit in gray. SSB single sideband.
Fig. 3
Fig. 3. Dual-comb measurements.
a Multi-period interferogram between Combs 2 and 3 with δfrep = 50 kHz. Inset: Zoom on a single interferogram trace. b Dual-comb spectrum calculated over n = 5 interferograms averaged N = 20,000 times. c Zoom in on the comb structure with n = 50 and N = 2000. d Evolution of the SNR of the RF spectrum as a function of the number of averaged sets (N) at the tri-core fiber input (orange line and dots) and at the output (blue line and dots). e Phase profile at the dual-comb at the output of a standard SMF-28 fiber of 20 cm (green dots) and its quadratic fit (blue line). f Relative coherence between two combs (1 & 2) at the tri-core fiber output (blue curve) and using two separate fiber wounded on the same spools (pink curve).
Fig. 4
Fig. 4. FWM tri-comb interferometry.
a, b Scheme of principle. Comb1 (orange) and Comb2 (green) at frep1 = 1.25 GHz generate FWM (purple) in a nonlinear fiber, used as the replica of a nonlinear spectroscopic medium. Comb3 (blue) at frep3 = frep1 + δfrep down-converts the resulting spectrum in the RF domain. c RF spectrum of a set of n = 5 interferograms averaged over N = 800 times, with zero-delay between the pumps. The inset is a zoom-in of the FWM spectrum around 300 MHz, with n = 10 and N = 80. d Spectrogram of the down-converted FWM. Parameters: fAOM1 = 100 MHz and fAOM2 = 200 MHz, δfrep = 100 kHz, frep = 1.25 GHz and Fsampling = 5 GHz. FWM Four-Wave Mixing.

References

    1. Hänsch TW. Nobel lecture: passion for precision. Rev. Mod. Phys. 2006;78:1297–1309. doi: 10.1103/RevModPhys.78.1297. - DOI
    1. Fortier T, Baumann E. 20 years of developments in optical frequency comb technology and applications. Commun. Phys. 2019;2:1–16. doi: 10.1038/s42005-019-0249-y. - DOI
    1. Diddams SA, Vahala K, Udem T. Optical frequency combs: coherently uniting the electromagnetic spectrum. Science. 2020;369:3676. doi: 10.1126/science.aay3676. - DOI - PubMed
    1. Coddington I, Newbury N, Swann W. Dual-comb spectroscopy. Optica. 2016;3:414. doi: 10.1364/OPTICA.3.000414. - DOI - PMC - PubMed
    1. Picqué N, Hänsch TW. Frequency comb spectroscopy. Nat. Photonics. 2019;13:146–157. doi: 10.1038/s41566-018-0347-5. - DOI