. 2023 Dec 1;14(1):7942.
doi: 10.1038/s41467-023-43744-8.

Early warning signals have limited applicability to empirical lake data

Affiliations

Early warning signals have limited applicability to empirical lake data

Duncan A O'Brien et al. Nat Commun. .

Abstract

Research aimed at identifying indicators of persistent abrupt shifts in ecological communities, a.k.a regime shifts, has led to the development of a suite of early warning signals (EWSs). As these often perform inaccurately when applied to real-world observational data, it remains unclear whether critical transitions are the dominant mechanism of regime shifts and, if so, which EWS methods can predict them. Here, using multi-trophic planktonic data on multiple lakes from around the world, we classify both lake dynamics and the reliability of classic and second generation EWSs methods to predict whole-ecosystem change. We find few instances of critical transitions, with different trophic levels often expressing different forms of abrupt change. The ability to predict this change is highly processing dependant, with most indicators not performing better than chance, multivariate EWSs being weakly superior to univariate, and a recent machine learning model performing poorly. Our results suggest that predictive ecology should start to move away from the concept of critical transitions, developing methods suitable for predicting resilience loss not limited to the strict bounds of bifurcation theory.


Conflict of interest statement

The authors declare no competing interests.

Figures

Fig. 1
Fig. 1. Classification tree relating the primary transition types and system dynamics relevant to early warning signals (EWSs) and regime shift detection.
Terms are colour coded by their expectation to exhibit critical slowing down (the phenomenon quantified by EWSs). Whether a classification is made using the time series or the phase space (i.e. state against the control parameter/driver) is indicated. Distinct classifications are labelled (AE) for crossreferencing with the main text.
Fig. 2
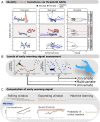
Fig. 2. Hypothesised behaviour of possible system dynamics under three complementary analyses used to classify the fate of a time series.
These analyses fulfil the criteria of Scheffer and Carpenter, Andersen et al. , and Bestelmeyer et al. . for identifying alternative stable states in empirical data through (i) time series shifts, (ii) a hysteresis response to the control parameter and (iii) multimodal distributions. We have assumed here that the control parameter/environmental driver is increasing through time. Analyses (i) and (ii) are performed using threshold generalised additive models (TGAMs) of plankton density against time and environmental driver respectively. Thresholds/breakpoints are only permitted to occur between adjacent time points. Analysis (iii) identifies unimodal vs bimodal distributions of plankton density across the entire time series. We expand these analyses over,, to identify other forms of transition and provide a qualitative description for each transitions expected behaviour in the three analyses. In the first two columns, thick lines represent median TGAM fit with shaded regions the confidence interval. Dotted lines are discontinuities between breakpoints. In the third column, lines represent the density of observations. TGAMs are limited by classifying system dynamics solely upon observational data and, therefore will not guarantee classification without knowledge of the underlying system equations. Those equations can only be determined through experiments and differential equation modelling, but TGAMs provide a ‘best-guess’ using the limited data typically available to system managers.
Fig. 3
Fig. 3. Geographical locations of lakes assessed in this study and an indication of their size.
Map coordinates are projected in WGS 84.
Fig. 4
Fig. 4. Overview of generalised additive model (GAM) and early warning signal (EWS) techniques applied in this study, with selected examples from the lake plankton dataset.
A Application of the classification approaches introduced in Fig. 2 in the yearly lake plankton data. Points represent the observed data, with curved lines and shaded regions the GAM fits and 95% confidence intervals, respectively. Asterisks in the kernel density plot indicate significant bimodality coefficients, with dashed lines the estimated modalities. An example of an abrupt, non-bifurcation shift (Lake Washington’s zooplankton), a critical transition (Lake Kinneret’s phytoplankton) and a non-transition (Windermere’s phytoplankton) are presented. Plankton densities have been scaled to mean zero and unit variance to improve plotting clarity. B Two forms of EWS are then performed on the plankton data: univariate EWSs, which consider one time series at a time, and multivariate, which combine information from multiple sources. The former can only give a representation of the community’s state as assessment occurs at the species level, whereas the latter assesses at the community level. Here, yearly cyclopoid and daphnid densities from Lake Kasumigaura are presented. C The three computation techniques for calculating EWSs and ‘warnings’. Rolling windows are the classical form of EWS and sequentially exploit a set proportion of the time series to calculate trends in the EWS—a strong positive correlation with time indicates an oncoming transition. Expanding windows incrementally introduce new data, with the rolling average of the EWS only signalling a warning if a threshold is transgressed. And machine learning models which predict the probability of a transition based upon its knowledge of its training data. The machine learning model used here (EWSNet) is limited to univariate time series whereas the other computation methods can be applied to univariate or multivariate EWSs.
Fig. 5
Fig. 5. Prediction success of lake plankton fate according to early warning signal computation method displayed as density plots of posterior distributions for time series level estimates of prediction ability grouped by computation method.
Computation methods are ranked by their mean ability across monthly and yearly data. The dashed vertical line shows the zero-slope—i.e., 50–50 chance of correct prediction—and each density plot represents 1000 samples from the posterior distribution of the parameter estimates. The reported values are the posterior density median values (circles), with 50% (thickest bars), 80% and 95% (thinnest bars) credible intervals back transformed from log odds to probabilities. Densities are therefore asymmetrical due to the sigmoidal relationship between log odds and probability.
Fig. 6
Fig. 6. Prediction success of lake plankton fate according to individual early warning signal indicators (abbreviations are defined in Table S2) displayed as density plots of posterior distributions for time series level estimates of prediction ability.
Estimates have been segregated into estimates made upon (A) transitioning data and (B) non-transitioning data. These models, therefore, represent indicator true positive prediction ability and true negative prediction ability, respectively. The dashed vertical line shows the zero-slope—i.e., 50–50 chance of correct prediction—and each density plot represents 1000 samples from the posterior distribution of the parameter estimates. The reported values are the posterior density median values (circles), with 50% (thickest bars), 80% and 95% (thinnest bars) credible intervals back transformed from log odds to probabilities. Densities are, therefore, asymmetrical due to the sigmoidal relationship between log odds and probability. Colour has been used to categorise the early warning signal computation technique (i.e., rolling window, expanding window, machine learning). Note—single estimates are reported for the univariate indicators ar1 + SD, ar1 + SD + skew, ar1 + skew, and SD + skew as these are only calculable via univariate expanding windows. All other indicators are calculable using both rolling and expanding windows.

References

    1. Dakos V, Carpenter SR, van Nes EH, Scheffer M. Resilience indicators: prospects and limitations for early warnings of regime shifts. Philos. Trans. R. Soc. B Biol. Sci. 2015;370:20130263. doi: 10.1098/rstb.2013.0263. - DOI
    1. Brothers SM, et al. A regime shift from macrophyte to phytoplankton dominance enhances carbon burial in a shallow, eutrophic lake. Ecosphere. 2013;4:art137. doi: 10.1890/ES13-00247.1. - DOI
    1. Sguotti, C. & Cormon, X. Regime shifts—A global challenge for the sustainable use of our marine resources. In YOUMARES 8—Oceans bcross Boundaries: Learning from each other (eds Jungblut, S., Liebich, V. & Bode, M.) 155–166 (Springer International Publishing, 2018).
    1. Crépin A-S, Biggs R, Polasky S, Troell M, de Zeeuw A. Regime shifts and management. Ecol. Econ. 2012;84:15–22. doi: 10.1016/j.ecolecon.2012.09.003. - DOI
    1. Cooper GS, Willcock S, Dearing JA. Regime shifts occur disproportionately faster in larger ecosystems. Nat. Commun. 2020;11:1175. doi: 10.1038/s41467-020-15029-x. - DOI - PMC - PubMed

Publication types