. 2023 Dec 1;13(1):21241.
doi: 10.1038/s41598-023-48131-3.

A 1D model characterizing the role of spatiotemporal contraction distributions on lymph transport

Affiliations

A 1D model characterizing the role of spatiotemporal contraction distributions on lymph transport

Farbod Sedaghati et al. Sci Rep. .

Abstract

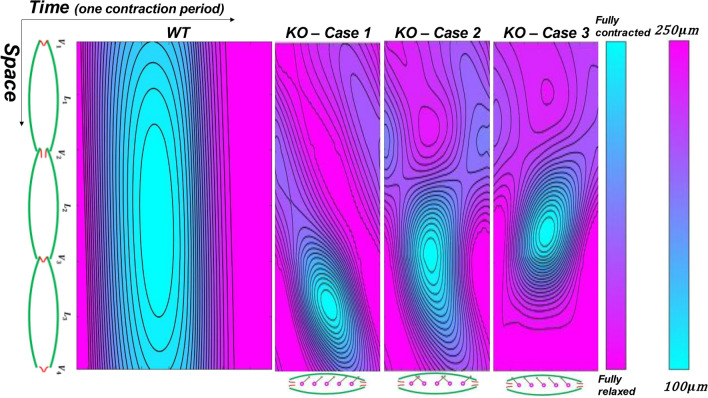
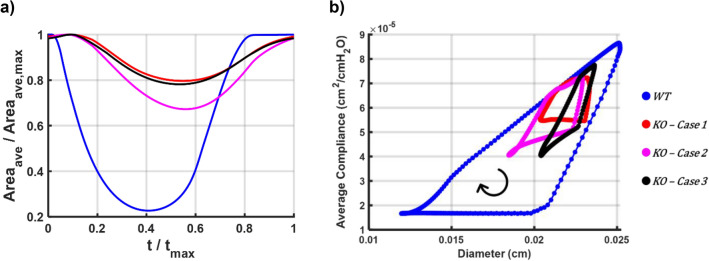
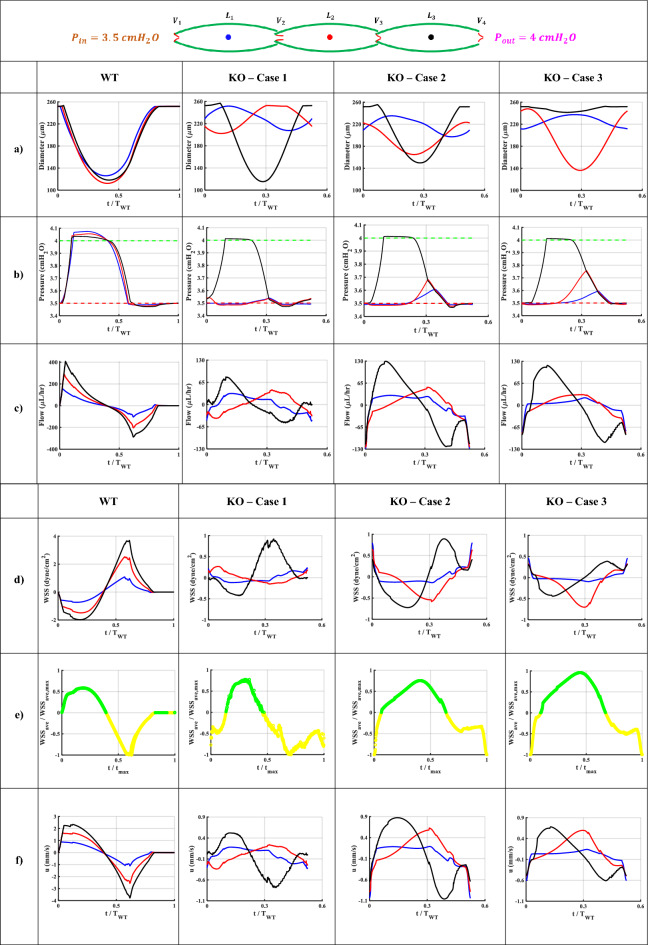
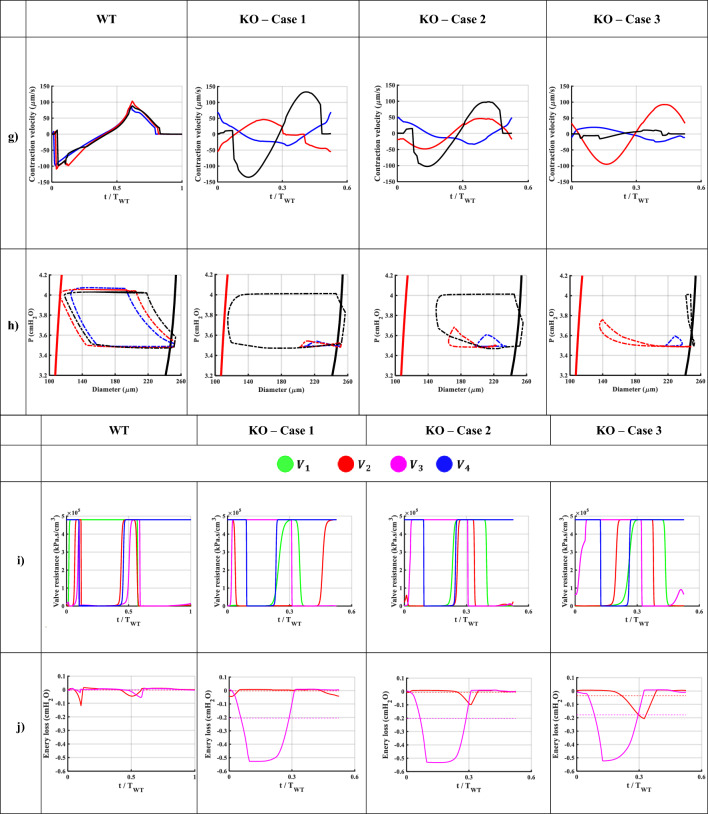
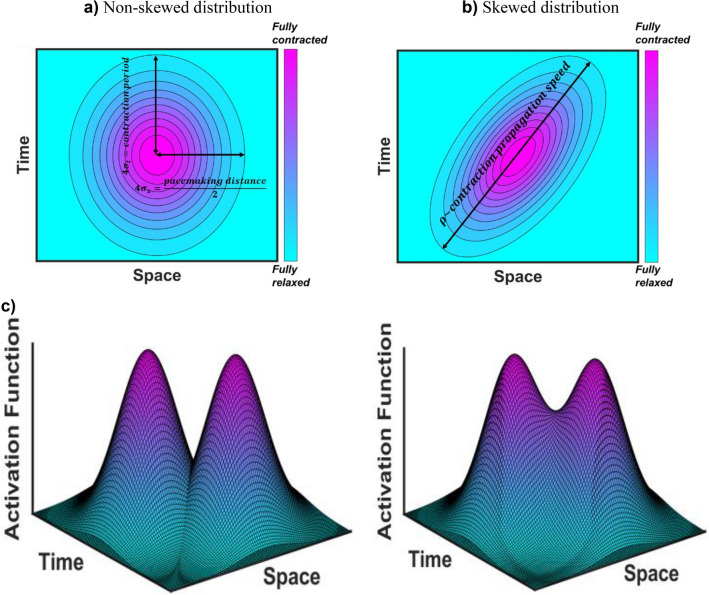
Lymphedema is a condition in which lymph transport is compromised. The factors that govern the timing of lymphatic contractions are largely unknown; however, these factors likely play a central role in lymphatic health. Computational models have proven useful in quantifying changes in lymph transport; nevertheless, there is still much unknown regarding the regulation of contractions. The purpose of this paper is to utilize computational modeling to examine the role of pacemaking activity in lymph transport. A 1D fluid-solid modeling framework was utilized to describe the interaction between the contracting vessel and the lymph flow. The distribution of contractions along a three-lymphangion chain in time and space was determined by specifying the pacemaking sites and parameters obtained from experimentation. The model effectively replicates the contractility patterns in experiments. Quantitatively, the flow rates were measured at 5.44 and 2.29 [Formula: see text], and the EF values were 78% and less than 33% in the WT and KO models, respectively, which are consistent with the literature. Applying pacemaking parameters in this modeling framework effectively captures lymphatic contractile wave propagations and their relation to lymph transport. It can serve as a motivation for conducting novel studies to evaluate lymphatic pumping function during the development of lymphedema.


Conflict of interest statement

The authors declare no competing interests.

Figures

Figure 1
Figure 1
Time–space mapping of contractions of the lymphatic network during a contraction cycle. Contraction cycle of the WT and the KO models are different due to the frequency discrepancy. Contraction patterns of three cases in the KO model are different due to directionality of pacemaking signals. Cyan represents fully contracted state/activated, and purple represents non-contracted state/relaxed.
Figure 2
Figure 2
Lumen reduction pattern and compliance-diameter patterns. (a) Normalized average area reduction vs. normalized contraction period. Blue corresponds to the WT model showing significant area reduction followed by a relaxation period. Red/purple/black correspond to the KO model showing less remarkable area reduction and missing relaxation period. (b) Average compliance vs. diameter pattern during a contraction cycle. Not area reduction and less decrease in the compliance manifests less constriction and stiffening of the lymphatic wall during systole in the KO models.
Figure 3
Figure 3
Illustrative simulations of the WT and KO models during a contraction cycle. Results belong to the middle node of the first (blue), second (red), and third (black) lymphangion. (a) Diameter patterns represent how contraction waves propagate along the network. (b) Pressure pulses and the inlet (red dashed line) and outlet (green dashed line) pressure profiles. (c) Lymph axial flow profiles during a contraction cycle. (d) Wall shear stress (WSS) patterns exerted on the lymph flow at the wall boundary. (e) The normalized average wall shear stress vs. the normalized contraction frequency. Green and yellow show positive and negative values, respectively. (f) Lymph flow velocity profiles. (g) Radial contraction velocity of the lymphatic vessel. (h) Pressure-diameter patterns during a contraction cycle. Dashed black and red lines correspond to the pre- and peak-twitch constitutive data. (i) Resistance of the four valves during a contraction cycle. (j) The total mechanical energy loss at the middle valves 2 (red) and 3 (purple). The dashed lines represent the mean of each curve. A remarkable energy loss happens in the KO models.
Figure 3
Figure 3
Illustrative simulations of the WT and KO models during a contraction cycle. Results belong to the middle node of the first (blue), second (red), and third (black) lymphangion. (a) Diameter patterns represent how contraction waves propagate along the network. (b) Pressure pulses and the inlet (red dashed line) and outlet (green dashed line) pressure profiles. (c) Lymph axial flow profiles during a contraction cycle. (d) Wall shear stress (WSS) patterns exerted on the lymph flow at the wall boundary. (e) The normalized average wall shear stress vs. the normalized contraction frequency. Green and yellow show positive and negative values, respectively. (f) Lymph flow velocity profiles. (g) Radial contraction velocity of the lymphatic vessel. (h) Pressure-diameter patterns during a contraction cycle. Dashed black and red lines correspond to the pre- and peak-twitch constitutive data. (i) Resistance of the four valves during a contraction cycle. (j) The total mechanical energy loss at the middle valves 2 (red) and 3 (purple). The dashed lines represent the mean of each curve. A remarkable energy loss happens in the KO models.
Figure 4
Figure 4
Model representation and constitutive data. (a) Schematic representation of the lymphatic network including three lymphangions and four secondary valves. (b) Pressure-diameter data of the mesentric lymphatic vessel from male Sprague–Dawley rats. Black and Red represent pre- and peak-twitch data in a inflation test. dpre and dpeak correspond to pressure from the previous time step. (c) Sigmoidal curve of secondary valve resistance vs. pressure difference.
Figure 5
Figure 5
Schematic representation of standard deviations of Gaussian function and “summation” concept. (a) Spatial and temporal standard deviations are correlated to the pacemaking distance and contraction frequency, respectively. Zero correlation results in a symmetric Gaussian distribution or non-skewedness which happens in high contraction propagation speed. (b) Low contraction propagation speed results in a significant correlation and skewedness of the Gaussian distribution. (c) Using the concept of “summation” to generate the overall activation function based upon individual Gaussian distributions at pacemakers.

References

    1. Bazigou E, Wilson JT, Moore JE., Jr Primary and secondary lymphatic valve development: molecular, functional and mechanical insights. Microvasc. Res. 2014;96:38–45. doi: 10.1016/j.mvr.2014.07.008. - DOI - PMC - PubMed
    1. Razavi MS, Leonard-Duke J, Hardie B, Dixon JB, Gleason RL., Jr Axial stretch regulates rat tail collecting lymphatic vessel contractions. Sci. Rep. 2020;10:5918. doi: 10.1038/s41598-020-62799-x. - DOI - PMC - PubMed
    1. Hald BO, Castorena-Gonzalez JA, Zawieja SD, Gui P, Davis MJ. Electrical communication in lymphangions. Biophys. J. 2018;115:936–949. doi: 10.1016/j.bpj.2018.07.033. - DOI - PMC - PubMed
    1. Behringer EJ, et al. Calcium and electrical dynamics in lymphatic endothelium. J. Physiol. 2017;595:7347–7368. doi: 10.1113/JP274842. - DOI - PMC - PubMed
    1. To KHT, et al. T-type, but not L-type, voltage-gated calcium channels are dispensable for lymphatic pacemaking and spontaneous contractions. Sci. Rep. 2020;10:70. doi: 10.1038/s41598-019-56953-3. - DOI - PMC - PubMed