. 2023 Dec 1;14(1):7930.
doi: 10.1038/s41467-023-43600-9.

Spatial transcriptomics deconvolution at single-cell resolution using Redeconve

Affiliations

Spatial transcriptomics deconvolution at single-cell resolution using Redeconve

Zixiang Zhou et al. Nat Commun. .

Abstract

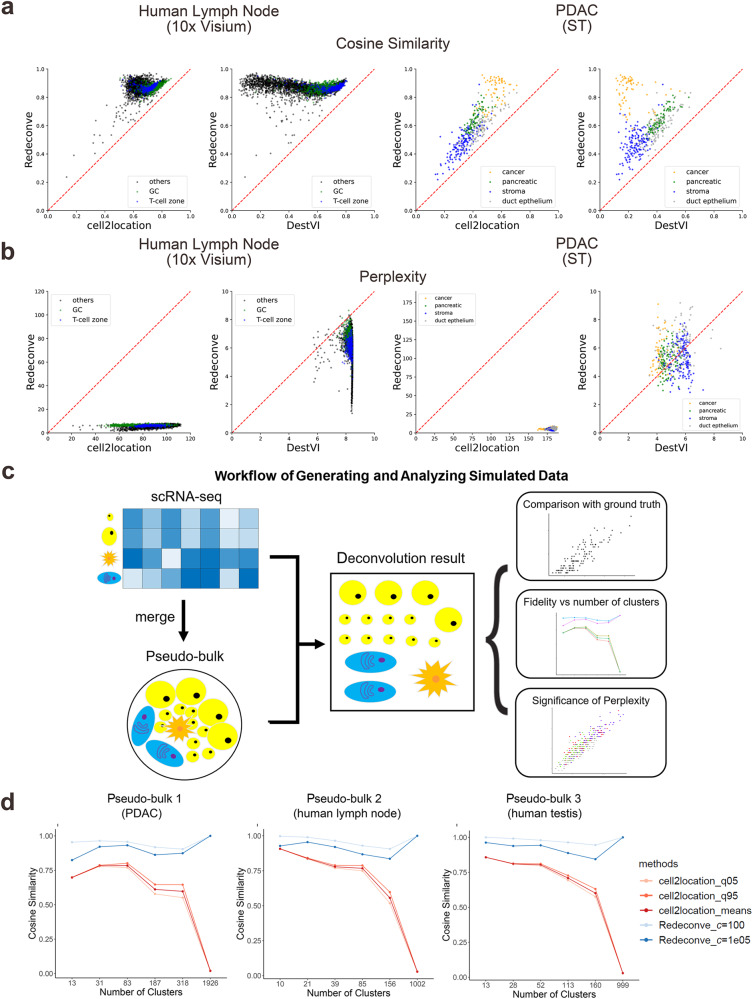
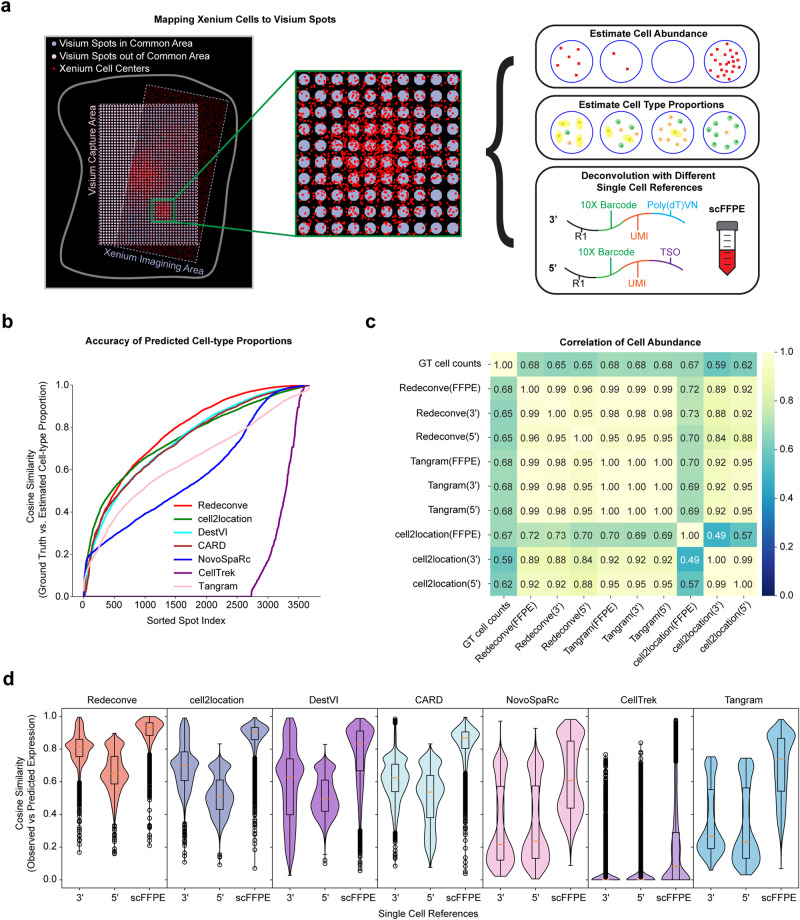
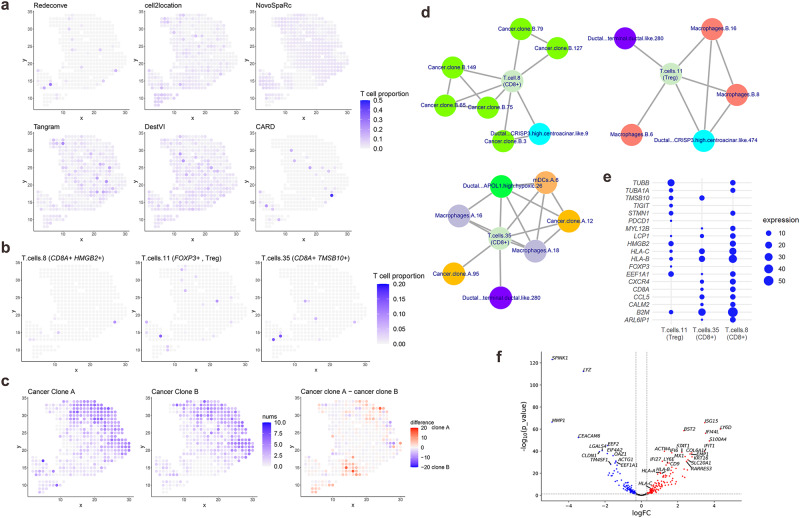
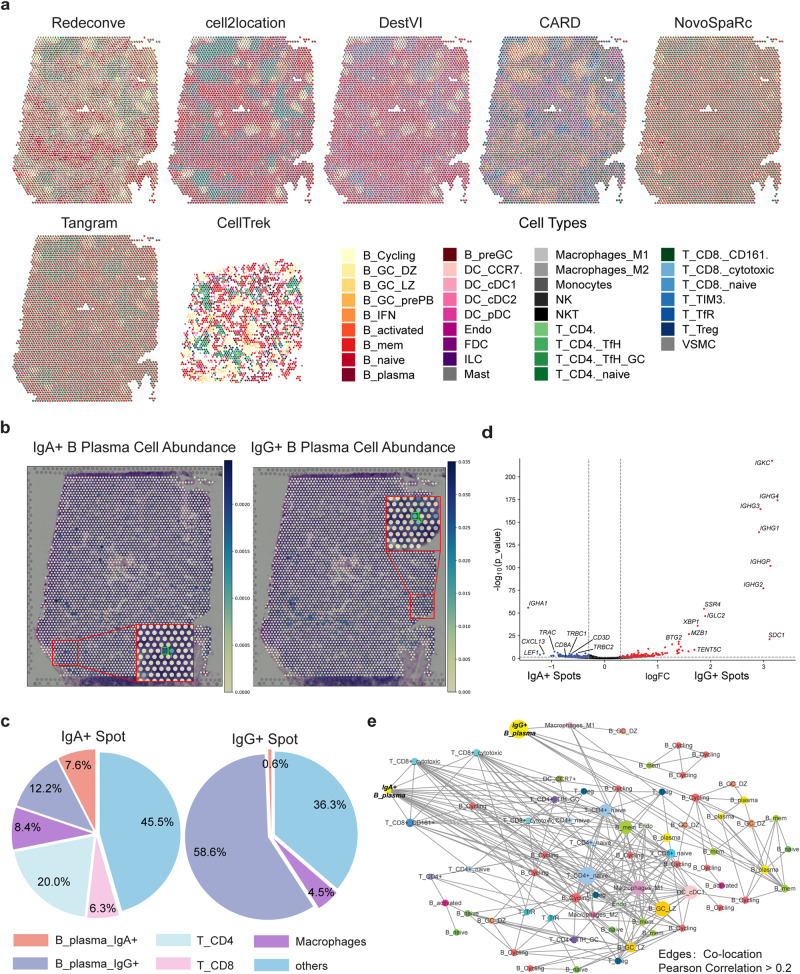
Computational deconvolution with single-cell RNA sequencing data as reference is pivotal to interpreting spatial transcriptomics data, but the current methods are limited to cell-type resolution. Here we present Redeconve, an algorithm to deconvolute spatial transcriptomics data at single-cell resolution, enabling interpretation of spatial transcriptomics data with thousands of nuanced cell states. We benchmark Redeconve with the state-of-the-art algorithms on diverse spatial transcriptomics platforms and datasets and demonstrate the superiority of Redeconve in terms of accuracy, resolution, robustness, and speed. Application to a human pancreatic cancer dataset reveals cancer-clone-specific T cell infiltration, and application to lymph node samples identifies differential cytotoxic T cells between IgA+ and IgG+ spots, providing novel insights into tumor immunology and the regulatory mechanisms underlying antibody class switch.


Conflict of interest statement

The authors declare no competing interests.

Figures

Fig. 1
Fig. 1. Overview of the Redeconve algorithm and benchmark analysis.
a overview of Redeconve workflow for deconvoluting spatial transcriptomics data. Redeconve requires sc/snRNA-seq data together with spatial transcriptomics data as input and performs deconvolution by solving a regularized non-negative least regression model with the aims to estimate cellular composition across spots at single-cell resolution. b heatmap illustrated median spot-level Spearman’s correlation of cell type proportions among different algorithms on a human breast cancer dataset. c Sankey diagram demonstrated the cell-type and single-cell resolutions of Redeconve results on human breast cancer and mouse cerebellum datasets, respectively. The bar height of cell types or single cells refer to their estimated abundance after deconvolution. d line chart of cosine similarities between observed and reconstructed expression profiles per spot based on six ST datasets. N = 4039, 2426, 428, 36550, 2987 and 39431 spots for human lymph nodes, human breast cancer, PDAC (pancreatic ductal adenocarcinoma), human testis, mouse brain and mouse cerebellum respaectively. Spots were sorted by an ascending order of the cosine similarities. e Pearson correlation of cell abundances between Redeconve and the cell counts per spot based on a mouse brain dataset. The ground truth cell counts per spot was obtained by nucleus counting of cell segmentation image. f computational efficiency of different deconvolution-based and mapping-based algorithms on a human lymph nodes dataset. Source data of 1c-e are provided as a Source Data file.
Fig. 2
Fig. 2. Performance benchmarking with single-cell inputs and simulated datasets.
Redeconve, cell2location and DestVI are currently the only three deconvolution-based tools with the ability to handle thousands of cell states. a cosine similarity between true and reconstructed spatial expression profiles based on Redeconve, cell2location and DestVI with 1000 single cells as input. Each dot represents a spot of the ST data. b the number of different cell states within each spot estimated by the perplexity of cell state composition per spot for results of Redeconve, cell2location and DestVI with 1000 single cells as input (See Methods for details). c workflow of generating simulation data. ScRNA-seq data were aggregated to a pseudo-bulk, which was then used for deconvolution analysis and the results were used for downstream analyses in (d). d cosine similarity between true and reconstructed spatial expression profiles vs. number of clusters on simulated pseudo-bulk. PDAC, pancreatic ductal adenocarcinoma. Source data of 2a, b and d are provided as a Source Data file.
Fig. 3
Fig. 3. Benchmarking Redeconve performance on a human breast cancer Xenium dataset.
a Left: Overlapped Xenium cells and Visium spots were illustrated on H&E image. Right: the overlapped region was employed for benchmarking Redeconve performance by introducing different single-cell references to predict expression profiles, cell type proportions, and cell abundances. b line chart of cosine similarities of cell type proportions between ground truths and algorithm-based predictions per spot. N = 3906 spots for the dataset and spots were sorted by an ascending order of the cosine similarities. c Heatmap illustrating the pairwise Pearson’s correlation of cell abundances among the ground truth, Redeconve, cell2location and Tangram based on various single cell references. d violin and box plot of cosine similarities between observed and reconstructed expression profiles for Redeconve and alternative approaches with different single cell references (3’, 5’ and scFFPE-seq). The number of independent single cells in the references are 5527, 13,808 and 28,180 respectively. The center line and the bounds of box refer to median, Q1 and Q3 of scores and the whisker equal to 1.5*(Q3–Q1). The minimum and maximum scores refer to Q1-whisker and Q3+whisker. GT, ground truth. scFFPE-seq, single-cell Formalin Fixed Paraffin Embedded sequencing. Source data of 3b-d are provided as a Source Data file. Display items in this figure were manually generated in Inkscape by the authors.
Fig. 4
Fig. 4. Single-cell deconvolution of a human PDAC (pancreatic ductal adenocarcinoma) ST dataset.
a four regions were annotated by histological analysis of the original paper: pancreatic, ductal, cancer and stroma regions. b spatial distribution of the cosine similarity between true and reconstructed expression profiles per spot by different computational methods. c pie charts displaying the spatial distribution of the estimated cell type proportion per spot by different computational methods. RBC red blood cell. mDC myeloid dendritic cell. pDC plasmacytoid dendritic cell. Source data are provided as a Source Data file.
Fig. 5
Fig. 5. Cancer-clone-specific CD8 + T cell infiltration revealed by Redeconve in human pancreatic cancer.
a abundance of T cells per spot estimated by different methods. b single-cell identity of infiltrated T cells revealed by Redeconve. The three T cells are indexed as “T.cells.8”, “T.cells.11”, “T.cells.35” separately. c single-cell identity of different cancer clone cells revealed by Redeconve, together with their abundance difference. d co-localization of the three T cell states with other cellular states. Nodes represent single cells and edges represent co-localization (Pearson correlation of cell abundance >0.4). Cancer clone-specific CD8 + T cell infiltration was revealed. e dot plot displaying characteristics genes among the three T cell states with different spatial preference with cancer clones A and B. f volcano plot displaying differentially expressed genes between the two cancer clones. The blue and red points refer to up-regulated genes in clones A and B-enriched spots, respectively. Vertical dashed line shows the cutoff of log fold change (±0.3). Horizontal dashed line shows the threshold of -lg p (1.301). T cell response-related genes including interferon-stimulating genes and human leukocyte antigens were up-regulated in clone B-enriched cells. The two-side exact test was applied in edgeR for the statistical test and the p-values were calculated without adjustments. Treg, T regulatory. Source data are provided as a Source Data file.
Fig. 6
Fig. 6. Single-cell deconvolution of a human secondary lymphoid organ ST dataset by Redeconve revealed differences between IgA+ and IgG+ spots regarding cellular composition.
a pie chart displaying the spatial distribution of the estimated cell type proportion by different methods. b spatial distribution of IgA+ and IgG+ B plasma cells revealed by Redeconve. c comparison of the cell proportion of two selected spots (the IgA+ and IgG+ spots in Fig. 6a with green squares). d volcano plots showing the differential gene expression between IgA+ and IgG+ spots. The red and blue point refer to up-regulated genes in IgG+ and IgA+ spots respectively. Vertical dashed line shows the cutoff of log fold change (±0.3). Horizontal dashed line shows the threshold of -lg(p), namely 1.301. The two-side exact test was applied in edgeR for the statistical test and the p-values were calculated without adjustments. e co-localization network of IgA+ and IgG+ B plasma cells within the ST data. Nodes represent single cells and edges represent co-located single cells (Pearson correlation of cell abundance >0.2). Abbreviations: GC germinal center, DZ dark zone, LZ light zone, prePB preplasmablast, mem memory, cDC classical dendritic cell, Endo endothelial, FDC follicular dendritic cell, ILC innate lymphoid cell, NK natural killer, NKT natural killer T, TfH T follicular helper, Treg T regulatory, VSMC vascular smooth muscle cell. Source data of 6a-d are provided as a Source Data file.

References

    1. Stickels RR, et al. Highly sensitive spatial transcriptomics at near-cellular resolution with Slide-seqV2. Nat. Biotechnol. 2021;39:313–319. doi: 10.1038/s41587-020-0739-1. - DOI - PMC - PubMed
    1. Eng CL, et al. Transcriptome-scale super-resolved imaging in tissues by RNA seqFISH. Nature. 2019;568:235–239. doi: 10.1038/s41586-019-1049-y. - DOI - PMC - PubMed
    1. Chen KH, Boettiger AN, Moffitt JR, Wang S, Zhuang X. RNA imaging. Spatially resolved, highly multiplexed RNA profiling in single cells. Science. 2015;348:aaa6090. doi: 10.1126/science.aaa6090. - DOI - PMC - PubMed
    1. Janesick, A. et al. High resolution mapping of the breast cancer tumor microenvironment using integrated single cell, spatial and in situ analysis of FFPE tissue. bioRxiv, 2022.2010.2006.510405, 10.1101/2022.10.06.510405 (2022).
    1. He, S. et al. High-plex imaging of RNA and proteins at subcellular resolution in fixed tissue by spatial molecular imaging. Nat Biotechnol40, 1794–1806 (2022). - PubMed

Publication types

Substances

Associated data