. 2023 Dec 1;14(1):7927.
doi: 10.1038/s41467-023-43737-7.

Opposing brain signatures of sleep in task-based and resting-state conditions

Affiliations

Opposing brain signatures of sleep in task-based and resting-state conditions

Mohamed Abdelhack et al. Nat Commun. .

Abstract

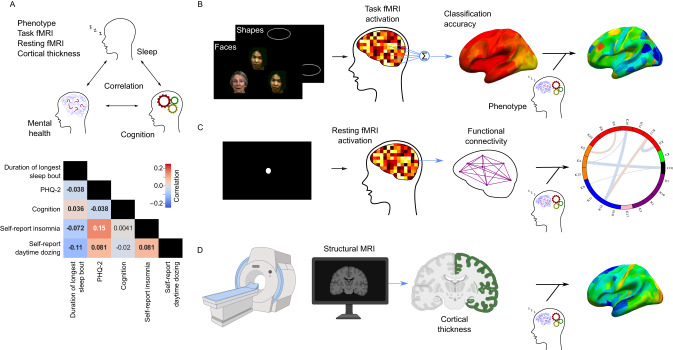
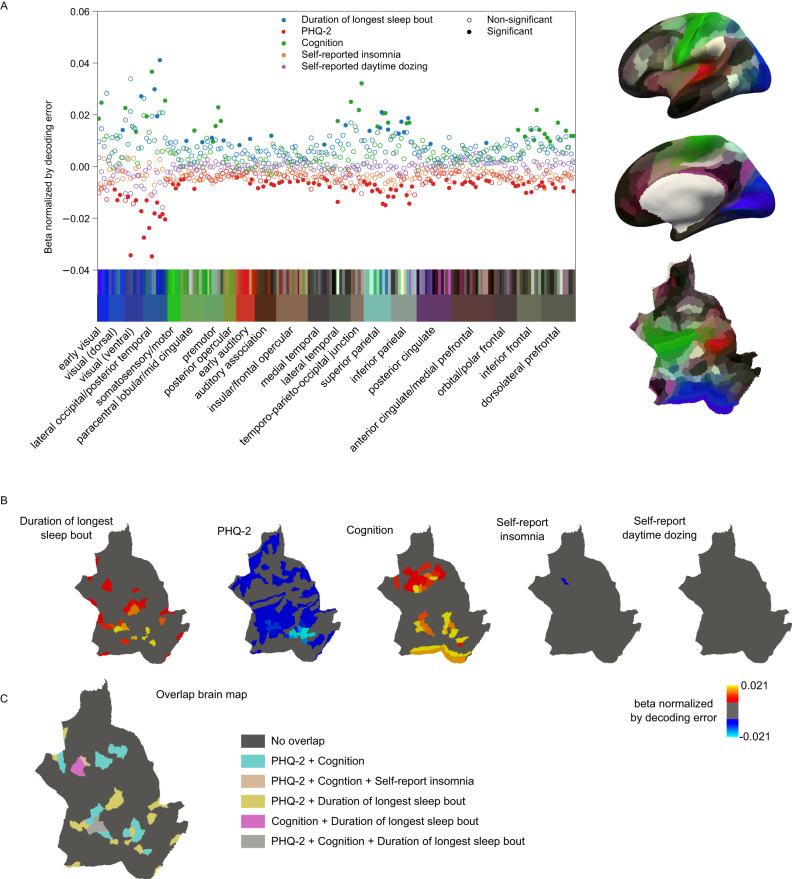
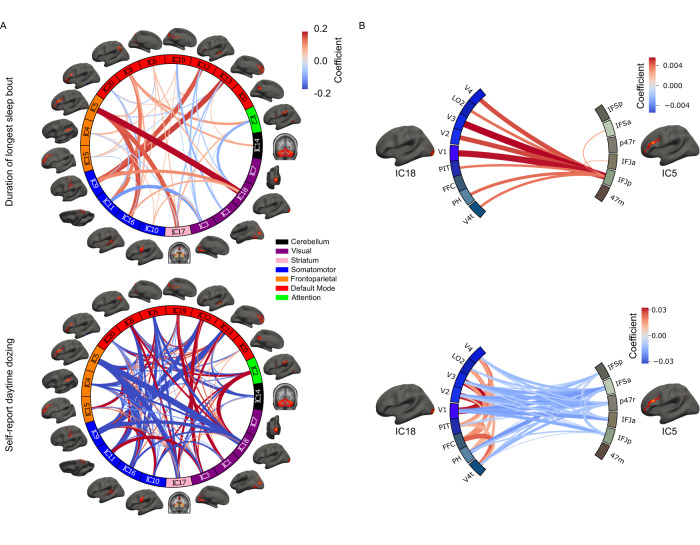
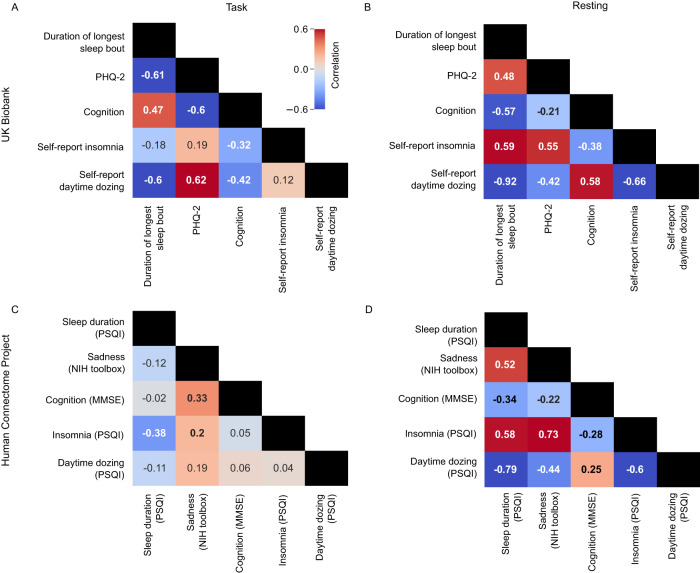
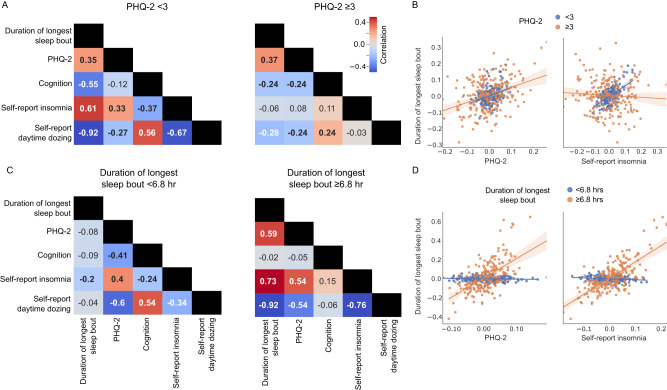
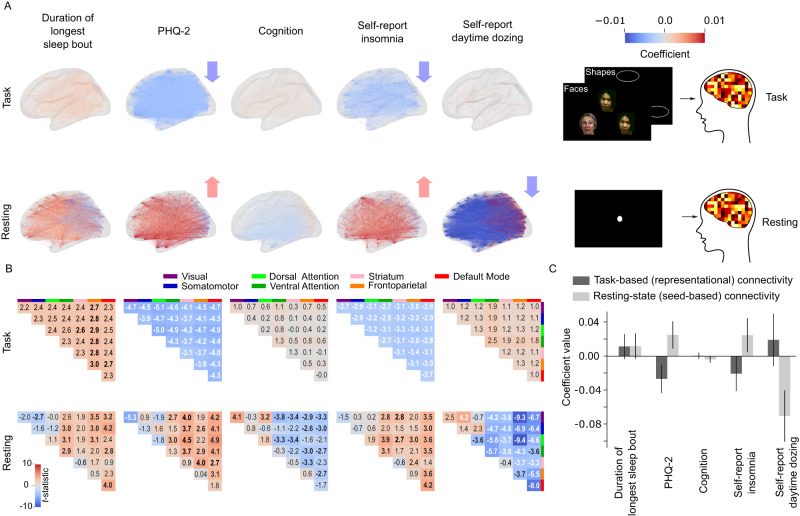
Sleep and depression have a complex, bidirectional relationship, with sleep-associated alterations in brain dynamics and structure impacting a range of symptoms and cognitive abilities. Previous work describing these relationships has provided an incomplete picture by investigating only one or two types of sleep measures, depression, or neuroimaging modalities in parallel. We analyze the correlations between brainwide neural signatures of sleep, cognition, and depression in task and resting-state data from over 30,000 individuals from the UK Biobank and Human Connectome Project. Neural signatures of insomnia and depression are negatively correlated with those of sleep duration measured by accelerometer in the task condition but positively correlated in the resting-state condition. Our results show that resting-state neural signatures of insomnia and depression resemble that of rested wakefulness. This is further supported by our finding of hypoconnectivity in task but hyperconnectivity in resting-state data in association with insomnia and depression. These observations dispute conventional assumptions about the neurofunctional manifestations of hyper- and hypo-somnia, and may explain inconsistent findings in the literature.


Conflict of interest statement

The authors declare no competing interests.

Figures

Fig. 1
Fig. 1. Study Summary.
A shows the partial correlation map between the tested phenotypes of sleep (duration of longest sleep bout, self-reported insomnia, and self-reported daytime dozing), depressive symptoms (PHQ-2 score), and cognition (bolded numbers are correlations significantly different from zero; p < 0.05/5). Source data are provided as a Source Data file. B shows a summary of the task fMRI experiment, multivariate pattern analysis, and subsequent linear modeling of classification accuracy with selected phenotypes to build cortical maps of associations (stimulus images obtained with permission from Prof. Deanna Barch). C shows a summary of the resting-state fMRI data collection protocol, the calculation of functional connectivity, and the linear modeling to produce a connectivity association map. D shows the process for obtaining cortical thickness from structural MRI and linear modeling with phenotypes to generate brain maps similar to those shown in (B). Leftmost three figures created with Biorender.com.
Fig. 2
Fig. 2. Results of the associations from the task-based fMRI data.
A summarizes the overall beta values of the models normalized by decoding accuracy. The regions are organized and color-coded according to their groupings in the human connectome project where the region color maps are shown on the right. B shows the brain region maps with significant associations (pFDR < 0.05/5) color-coded by the beta values normalized by decoding accuracy for each of the phenotype models. C shows the overlap between regions that showed significant associations with more than one phenotype. Source data are provided as a Source Data file.
Fig. 3
Fig. 3. Resting-state connectivity associations results with the sleep phenotypes.
A shows the functional connectivity associations for the accelerometer-measured duration of longest sleep bout and self-reported daytime dozing. The different independent components (IC) are grouped and color-coded based on the Yeo 7 Networks. B zooms in on the associations between the different brain regions of IC5 and IC18 showing seed-based correlation associations between different regions belonging to the components of interest. Source data are provided as a Source Data file.
Fig. 4
Fig. 4. Task and resting conditions show a discrepancy in neural association correlations of sleep, cognition, and depression across two datasets.
A shows the pairwise correlation values between coefficients from each phenotype model of task-based activations across all brain regions in the UK Biobank. B shows the pairwise correlation values between coefficients from each phenotype model of resting-state activations across all brain regions of the UK Biobank. C shows the task-based pairwise correlations similar to A but for the HCP dataset. D shows the resting state pairwise correlations similar to B but for the HCP dataset. Bolded values are statistically significant (p < 0.05/5; Bonferroni’s correction for five phenotypes). Statistical testing is based on an adaptation of a two-sided student t-test for Pearson’s correlation values using beta distributions. Source data are provided as a Source Data file.
Fig. 5
Fig. 5. Correlation values of the coefficients of the linear models of functional connectivity values split by PHQ-2 scores and duration of longest sleep bout.
A shows the pairwise correlation values for the coefficients of the models split by the PHQ-2 score representing depressed and non-depressed groups. B shows a scatter plot with the line of fit between the coefficients of the models for two pairs of phenotypes (duration of longest sleep bout and PHQ-2; duration of longest sleep bout and self-reported insomnia). Error band represent 95% confidence intervals before correcting for multiple comparisons. C shows the pairwise correlation values for the coefficients of the models split by the duration of longest sleep bout. Bolded values are statistically significant (p < 0.05/5; Bonferroni’s correction for five phenotypes). Statistical testing is based on an adaptation of a two-sided student t-test for Pearson’s correlation values using beta distributions. D shows a scatter plot with the line of fit between the coefficients of the models for two pairs of phenotypes (duration of longest sleep bout and PHQ-2; duration of longest sleep bout and self-reported insomnia). Error band represent 95% confidence intervals before correcting for multiple comparisons. Source data are provided as a Source Data file.
Fig. 6
Fig. 6. Brain regions are hyperconnected with PHQ-2 and insomnia in resting condition but hypoconnected in task condition.
A shows the significant brain representational and functional connectivity associations with the five phenotypes for each connection between HCP180 regions (p < 0.05/5; Bonferroni’s correction for five phenotypes). Statistical testing is based on a two-sided student t test. B Network-wise representational (upper) and functional (lower) connectivity associations (model t statistic) with the different phenotypes. Bolded associations are statistically significant. Statistical testing is based on an adaptation of a two-sided student t test for Pearson’s correlation values using beta distributions. C Global mean connectivity (of n = 16,110 connectivity values) associations with the five phenotypes. Error bars represent 95% confidence intervals after correcting for multiple comparisons over five measures. Source data are provided as a Source Data file.

References

    1. Nutt D, Wilson S, Paterson L. Sleep disorders as core symptoms of depression. Dialogues Clin. Neurosci. 2008;10:329–336. doi: 10.31887/DCNS.2008.10.3/dnutt. - DOI - PMC - PubMed
    1. Boland EM, et al. Meta-analysis of the antidepressant effects of acute sleep deprivation. J. Clin. Psychiatry. 2017;78:893. doi: 10.4088/JCP.16r11332. - DOI - PubMed
    1. Lauderdale DS, Knutson KL, Yan LL, Liu K, Rathouz PJ. Self-reported and measured sleep duration: how similar are they? Epidemiology. 2008;19:838–845. doi: 10.1097/EDE.0b013e318187a7b0. - DOI - PMC - PubMed
    1. Biddle DJ, Robillard R, Hermens DF, Hickie IB, Glozier N. Accuracy of self-reported sleep parameters compared with actigraphy in young people with mental ill-health. Sleep. Health. 2015;1:214–220. doi: 10.1016/j.sleh.2015.07.006. - DOI - PubMed
    1. Perini G, et al. Cognitive impairment in depression: recent advances and novel treatments. Neuropsychiatr. Dis. Treat. 2019;15:1249–1258. doi: 10.2147/NDT.S199746. - DOI - PMC - PubMed

Publication types