. 2023 Dec 1;6(1):1219.
doi: 10.1038/s42003-023-05604-5.

A two-kinesin mechanism controls neurogenesis in the developing brain

Affiliations

A two-kinesin mechanism controls neurogenesis in the developing brain

Paige Helmer et al. Commun Biol. .

Abstract

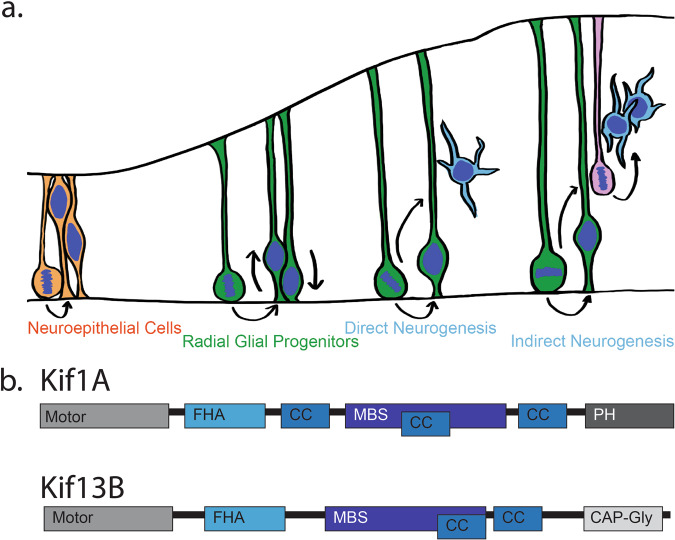
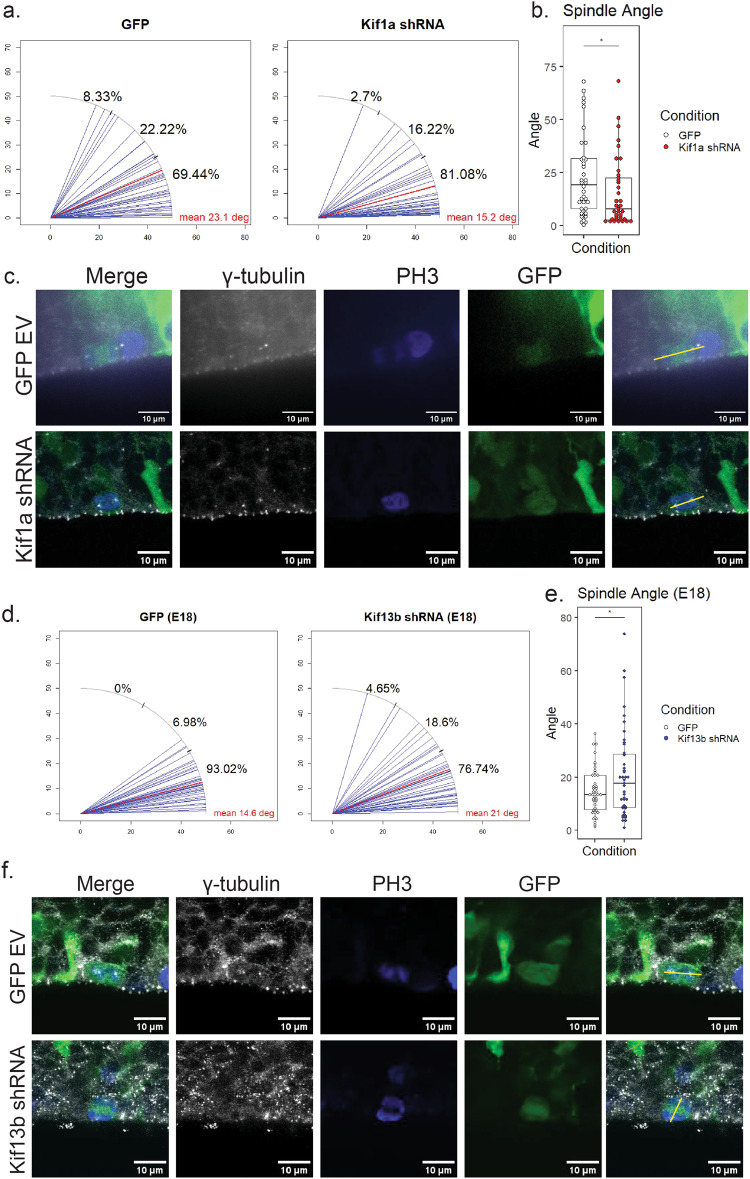
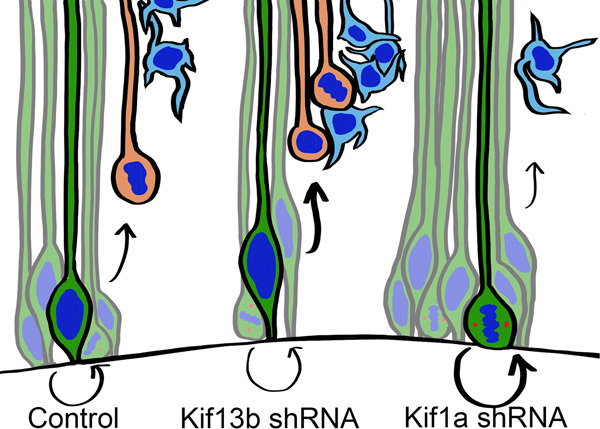
During the course of brain development, Radial Glial Progenitor (RGP) cells give rise to most of the neurons required for a functional cortex. RGPs can undergo symmetric divisions, which result in RGP duplication, or asymmetric divisions, which result in one RGP as well as one to four neurons. The control of this balance is not fully understood, but must be closely regulated to produce the cells required for a functioning cortex, and to maintain the stem cell pool. In this study, we show that the balance between symmetric and asymmetric RGP divisions is in part regulated by the actions of two kinesins, Kif1A and Kif13B, which we find have opposing roles in neurogenesis through their action on the mitotic spindle in dividing RGPs. We find that Kif1A promotes neurogenesis, whereas Kif13B promotes symmetric, non-neurogenic divisions. Interestingly, the two kinesins are closely related in structure, and members of the same kinesin-3 subfamily, thus their opposing effects on spindle orientation appear to represent a novel mechanism for the regulation of neurogenesis.


Conflict of interest statement

The authors declare no competing interests.

Figures

Fig. 1
Fig. 1. Brain development and kinesins.
a Diagrammatic representation of rodent brain cortical development. Neuroepithelial cells (orange) divide symmetrically, increasing their numbers. These cells develop into radial glial progenitor cells (RGPs, green). These cells divide symmetrically to expand their pool, or asymmetrically to produce neurons (blue). Neurogenesis can occur directly, or indirectly through intermediate progenitors (IPs, pink). b Domain maps of Kif1A and Kif13B, showing their structural similarities and differences, notably, the presence of a lipid binding PH domain in Kif1A and a microtubule plus-end binding CAP-Gly domain in Kif13B.
Fig. 2
Fig. 2. Kif13b and Kif1a shRNA have opposing effects on neurogenesis.
Percent of cells in CP, IZ, SVZ, or VZ of the cortex at (a) E18, (b) E19, and (c) E20. At E18, Intermediate zone and sub-ventricular zone are combined into one region (IZ/SVZ). Data plotted as interquartile range with 5–95% whisker range. (****p < 0.0001, ***p < 0.001, *p < 0.05. Analyzed using two sided unpaired t-test. Total GFP control brains: E18 = 7, E19 = 19, E20 = 3. Total Kif13b shRNA brains: E18 = 7, E19 = 9, E20 = 9. Total Kif1a shRNA brains: E18 = 4, E19 = 6, E20 = 3. At least 118 cells from each brain were included). Representative images of GFP control, Kif13b shRNA, and Kif1a shRNA-expressing rat brains at (d) E18, (e) E19, and (f) E20. White dashed line indicates the border between cortical regions. Scale bar = 100 µm.
Fig. 3
Fig. 3. Kif13b shRNA disrupts the distribution of neurons within the cortical plate.
a Representative images of the cortical plate in E20 rat brain expressing GFP control or Kif13b shRNA. Scale bar = 100 µm. b Distribution of GFP or Kif13b shRNA-expressing rat brain in E20 brain. The percent of cells in each of two equal-sized horizontal bins was determined. Data plotted as interquartile range with 5–95% whisker range. (****p < 0.0001. Analyzed using two sided unpaired t-test. Total GFP brains = 3, Kif13b shRNA brains = 9. At least 142 cells from each brain were included).
Fig. 4
Fig. 4. Kif13b and Kif1a shRNA have opposite effects on IP cell number.
a Quantification of PH3 positive cells dividing away from the ventricular surface. Intermediate progenitor (IP) percentage was calculated as number of GFP+/PH3+ cells observed with no contact with the ventricular surface divided by total number of GFP+/PH3+ cells. Data plotted as interquartile range with 5–95% whisker range. (**p < 0.01, *p < 0.05. Analyzed using two sided unpaired t-test. Total brains for GFP control = 8, Kif13b shRNA = 4, Kif1a shRNA = 4. At least 21 PH3+ cells from each brain were included). b Representative image showing an IP cell (yellow arrow) and an AP cell (white arrow) in a Kif13b shRNA-expressing E19 brain. Scale bar = 10 µm. c Quantification of Pax6+ cells in E19 rat brain VZ. The percentage of Pax6+ cells was calculated as number of GFP+/Pax6+ cells divided by total GFP+ cells at the ventricular surface. Data plotted as interquartile range with 5–95% whisker range. (**p < 0.01, Analyzed using two sided unpaired t-test. Total brains for GFP control = 5, Kif13b shRNA = 3, Kif1a shRNA = 9. At least 81 cells from each brain were included). d Representative images of GFP, Kif13b shRNA, or Kif1a shRNA expression (green) and Pax6 staining (magenta). White arrows indicate GFP+/Pax6+ cells and yellow arrows indicate GFP+/Pax6− cells. Scale bar = 10 µm. e Quantification of TBR2+ cells in E19 rat brain VZ. Percentage of TBR2+ cells was calculated as number of GFP+/TBR2+ cells divided by total GFP+ cells at the ventricular surface. Data plotted as interquartile range with 5–95% whisker range. (*p < 0.05. Analyzed using two sided unpaired t-test. Total brains for GFP control = 6, Kif13b shRNA = 5, Kif1a shRNA = 5. At least 52 cells per brain were included). f Representative images GFP, Kif13b, or Kif1a shRNA (green) and TBR2 (magenta). White arrows indicate GFP+/TBR2+ cells and yellow arrows indicate GFP+/TBR2− cells. Scale bar = 10 µm.
Fig. 5
Fig. 5. Kif13b shRNA and Kif1a shRNA have opposite effects on spindle orientation.
a Plots of spindle angle in E19 rat brain in utero electroporated with GFP control (left) and Kif1a shRNA (right) conditions. Mean spindle angle relative to the ventricular surface for each condition is shown in red. Percentages shown in black show percent of cells with spindle angles in 0–30, 30–60, and 60–90 degree range. (Total cells from GFP control = 36 cells from 10 brains, Kif1a shRNA = 37 cells from 5 brains). b Plot of spindle angles in GFP (white) and Kif1a shRNA (red) conditions. Data plotted as interquartile range with 5–95% whisker range. (*p < 0.05, analyzed using one sided unpaired t-test.). c Representative image of GFP EV and Kif1a shRNA-expressing RGPs at E19. Gamma tubulin is shown in gray, PH3 in blue, and GFP construct in green. A yellow line indicates the spindle angle relative to the ventricular surface. Scale bar = 10 µm. d Plots of individual angles in E18 rat brains in GFP EV (left) and Kif13b shRNA (right) conditions. Mean spindle angle for each condition is shown in red. Percentages shown in black show proportion of cells with mitotic spindles angles relative to the ventricular surface within 0–30, 30–60, or 60–90 degree range. (Total cells from WT control = 43 cells from 9 brains, Kif13b shRNA = 43 cells from 11 brains). e Plot of spindle angles in GFP (white) and Kif13b shRNA (blue) conditions. Data plotted as interquartile range with 5–95% whisker range. (*p < 0.05, analyzed using one sided unpaired t-test). f Representative images of mitotic spindles in GFP EV and Kif13b shRNA mouse brains at E18. PH3 is shown in blue, gamma tubulin is shown in gray. A yellow line indicates the angle of each spindle. Scale bar = 10 µm.
Fig. 6
Fig. 6. Diagrammatic representation of the effect of kinesin shRNA on IP production and neurogenesis.
Under control conditions, the balance between asymmetric and symmetric divisions results in some production of IPs, while maintaining the RGP population. In Kif13b shRNA conditions, more randomized spindle angles result in overproduction of IPs early in development resulting in a burst of neurogenesis. In Kif1a shRNA conditions, a more strictly controlled spindle angle results in reduced IP production and decreased neurogenesis.

References

    1. Tsai J-W, Lian W-N, Kemal S, Kriegstein A, Vallee RB. An unconventional kinesin and cytoplasmic dynein are responsible for interkinetic nuclear migration in neural stem cells. Nat. Neurosci. 2010;13:1463–1471. doi: 10.1038/nn.2665. - DOI - PMC - PubMed
    1. Liu JS, et al. Molecular basis for specific regulation of neuronal kinesin-3 motors by doublecortin family proteins. Mol. Cell. 2012;47:707–721. doi: 10.1016/j.molcel.2012.06.025. - DOI - PMC - PubMed
    1. Huttner WB, Kosodo Y. Symmetric versus asymmetric cell division during neurogenesis in the developing vertebrate central nervous system. Curr. Opin. Cell Biol. 2005;17:648–657. doi: 10.1016/j.ceb.2005.10.005. - DOI - PubMed
    1. Shitamukai A, Konno D, Matsuzaki F. Oblique radial glial divisions in the developing mouse neocortex induce self-renewing progenitors outside the germinal zone that resemble primate outer subventricular zone progenitors. J. Neurosci. 2011;31:3683–3695. doi: 10.1523/JNEUROSCI.4773-10.2011. - DOI - PMC - PubMed
    1. Carabalona A, Hu DJ-K, Vallee RB. KIF1A inhibition immortalizes brain stem cells but blocks BDNF-mediated neuronal migration. Nat. Neurosci. 2016;19:253–262. doi: 10.1038/nn.4213. - DOI - PMC - PubMed

LinkOut - more resources