. 2023 Dec 1;13(1):222.
doi: 10.1186/s13578-023-01150-z.

A rapid and stable spontaneous reprogramming system of Spermatogonial stem cells to Pluripotent State

Affiliations

A rapid and stable spontaneous reprogramming system of Spermatogonial stem cells to Pluripotent State

Rui Wei et al. Cell Biosci. .

Abstract

Background: The scarcity of pluripotent stem cells poses a major challenge to the clinical application, given ethical and biosafety considerations. While germline stem cells commit to gamete differentiation throughout life, studies demonstrated the spontaneous acquisition of pluripotency by spermatogonial stem cells (SSCs) from neonatal testes at a low frequency (1 in 1.5 × 10⁷). Notably, this process occurs without exogenous oncogenes or chemical supplementation. However, while knockout of the p53 gene accelerates the transformation of SSCs, it also increases risk and hampers their clinical use.

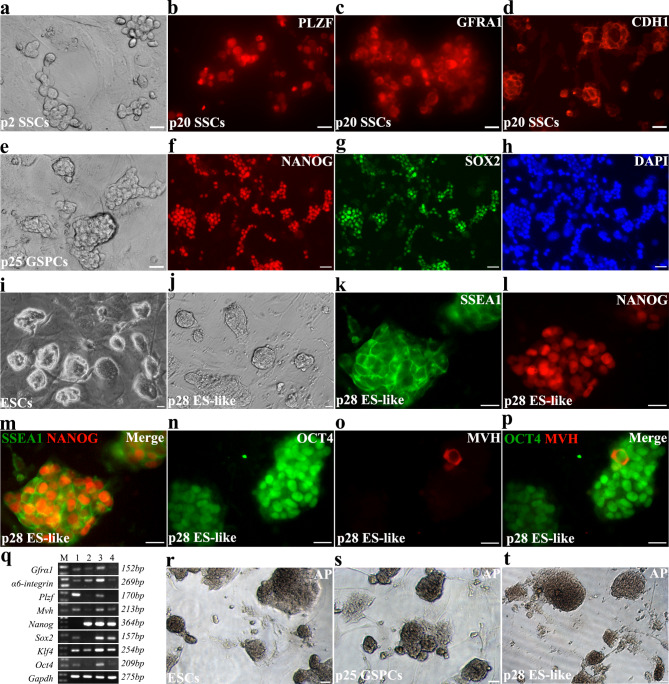
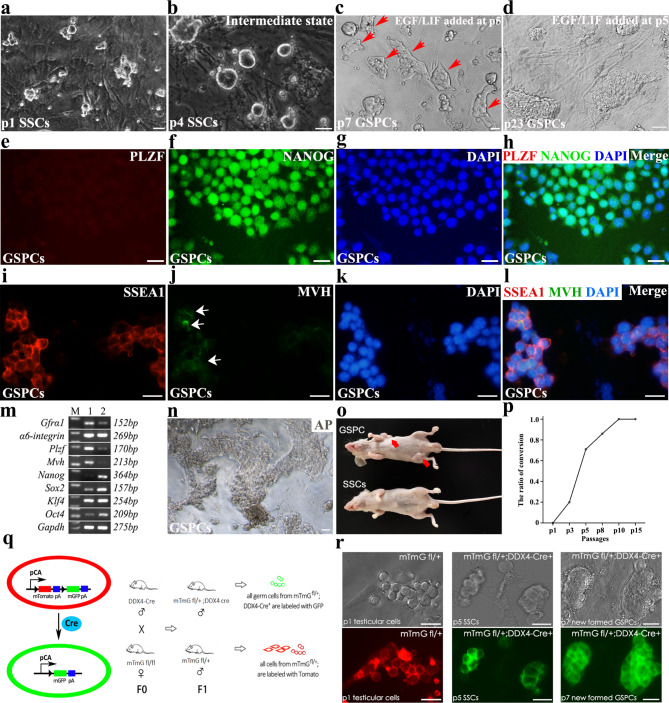
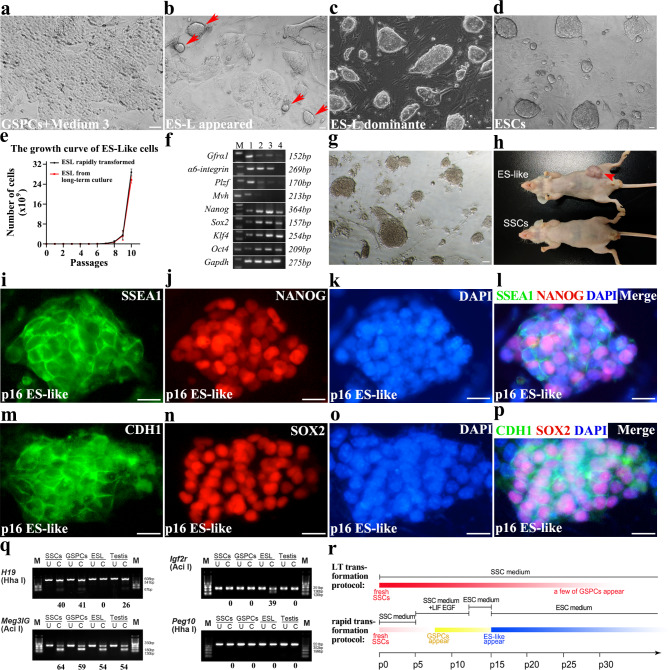
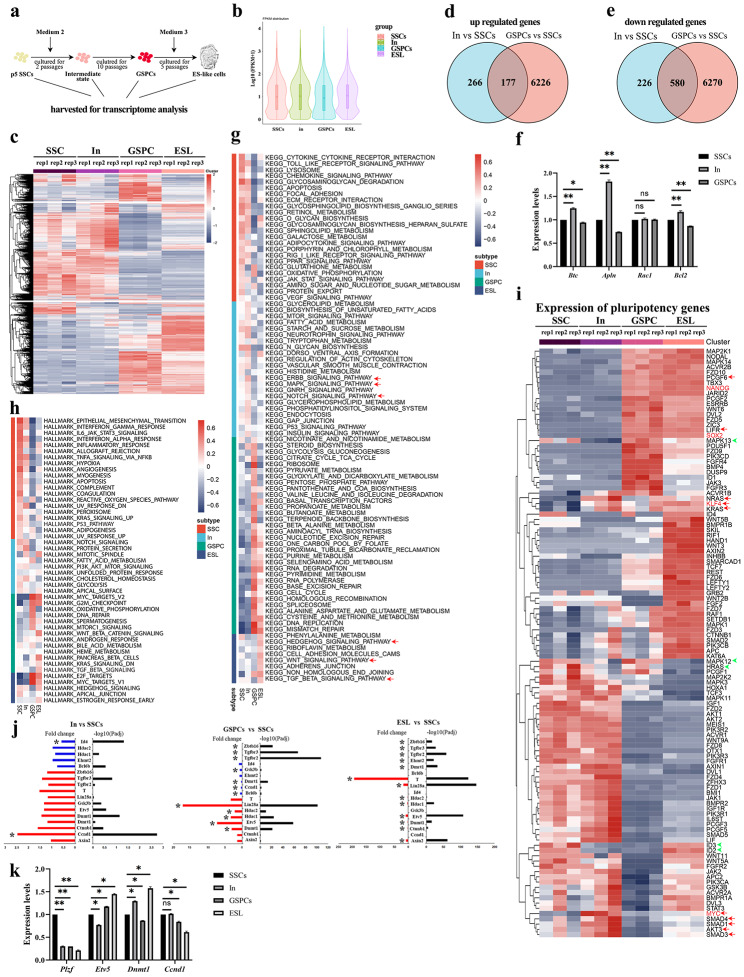
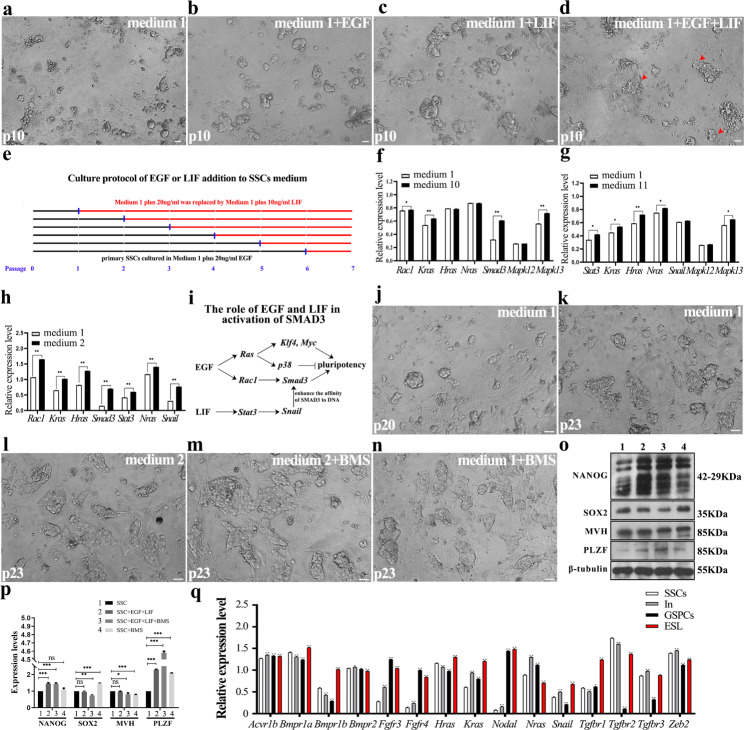
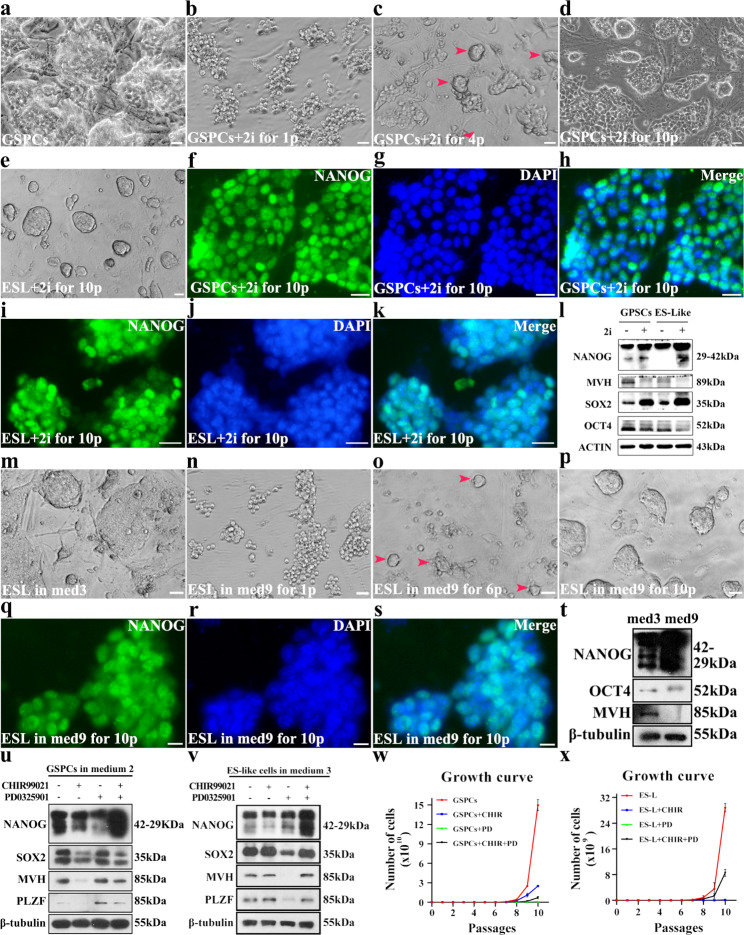
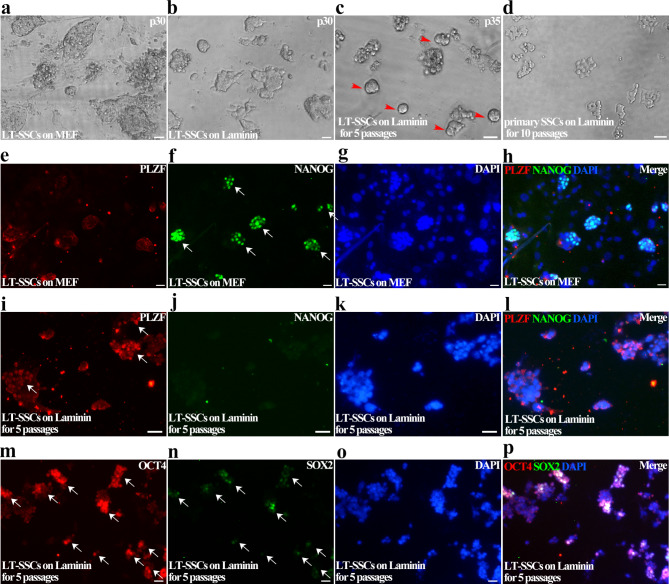
Results: We report a transformation system that efficiently and stably convert SSCs into pluripotent stem cells around 10 passages with the morphology similar to that of epiblast stem cells, which convert to embryonic stem (ES) cell-like colonies after change with ES medium. Epidermal growth factor (EGF), leukemia inhibitory factor (LIF) and fresh mouse embryonic fibroblast feeder (MEF) are essential for transformation, and addition of 2i (CHIR99021 and PD0325901) further enhanced the pluripotency. Transcriptome analysis revealed that EGF activated the RAS signaling pathway and inhibited p38 to initiate transformation, and synergically cooperated with LIF to promote the transformation.

Conclusion: This system established an efficient and safe resource of pluripotent cells from autologous germline, and provide new avenues for regenerative medicine and animal cloning.

Keywords: Cell fate; Feeder layer; Germline; Pluripotency; Reprogramming.


Conflict of interest statement

The authors declare that they have no conflict of interest.

Figures

Fig. 1
Fig. 1
Newly isolated SSCs transformed into pluripotent state during long-term culture. a-d Newly isolated SSCs were purified and plated on MEF feeder (a), and were identified with IF staining using antibodies against PLZF (b), GFRA1 (c) and CDH1 (d). e Typical colonies of transformed cells from long-term cultured SSCs were exhibited. f-h Identification of transformed pluripotent cells using dual IF staining of OCT4 (f), SOX2 (g) and DAPI (h). i-j The morphology of ESCs (i) and ES-like cells derived from transformed pluripotent cells (j) on MEF feeder were exhibited. k-p The expression of pluripotent and germline markers (k. SSEA1, l. NANOG, m. merge; n. OCT4, o. MVH, p. merge) in ES-like cells were detected using IF staining. q The expression of germline and pluripotent markers were determined using RT-PCR (M. marker, 1. newly isolated SSCs, 2. GSPCs derived from long-term culture, 3. ES-like cells derived from GSPCs, 4. H2O). r-t The alkaline phosphatase activity was detected in ESCs (r), GSPCs (s) and ES-like cells (t). Scale bar = 20 μm
Fig. 2
Fig. 2
Addition of EGF and LIF effectively accelerated SSCs transformation. a The morphology of newly isolated SSCs maintained on MEF feeder with medium1 after 1 passage was exhibited. b, SSCs colonies on MEF feeder with medium 1 for 4 passages, and medium 1 was replaced with medium 2, were exhibited. c After another 3 passages in medium 2, some GSPCs colonies appeared (red arrow heads). d The representative GSPCs colonies after long-term culture were exhibited. e-l The expression of NANOG, SSEA1 and MVH in stable GSPCs was detected using IF (e. PLZF, f. NANOG, g. DAPI, h. merge; i. SSEA1, j. MVH (arrows indicate a few MVH+ cells), k. DAPI, l. merge). m The expression levels of Gfrα1, α6-integrin, Plzf, Mvh, Nanog, Sox2, Klf4, Oct4 and Gapdh in SSCs and GSPCs were determined using RT-PCR (M. marker, 1. SSCs, 2. GSPCs). n Alkaline phosphatase activity of stable GSPCs derived from SSCs cultured in medium 2 was detected. o GSPCs derived in medium 2 induced teratoma in nude mice as early as 8–10 days, while SSCs cultured in medium 1 could not induce teratoma. p The conversion ratio of SSCs cultured in medium 1 was statistically analyzed. q The strategy to make germline specific GFP mice and isolate GFP labeled SSCs. r Tracing the formation of GFP labeled GSPCs under medium 2 condition. The total cells from mTmGfl/+ mice indiscriminately expressed tomato (left), while SSCs from mTmGfl/fl;Ddx4-Cre+ mice specifically expressed GFP (middle), and when they transformed in medium 2, GFP signal was only observed in GSPCs (right). Scale bar = 20 μm
Fig. 3
Fig. 3
ES medium induced GSPCs to transform into ES-like state. a The morphology of GSPCs cultured in medium 3 for 1 passage was exhibited. b ES-like colonies appeared in GSPCs cultured in medium 3 for 3–4 passages. c ES-like colonies became dominant after a few passages. d The typical ES colonies were exhibited. e The growth curve of ES-like cells was exhibited. f The expression levels of Gfrα1, α6-integrin, Plzf, Mvh, Nanog, Sox2, Klf4, Oct4 and Gapdh were determined using RT-PCR (M. marker, (1) SSCs, (2) GSPCs, (3) ES-like cells, (4) ESCs). g Alkaline phosphatase activity was determined in ES-like cells derived from GSPCs. h ES-like cells derived from GSPCs induced teratoma in nude mice, while SSCs cultured in medium 1 could not induce teratoma. i-p IF staining assays detected the expression of pluripotent markers in ES-like cells derived from GSPCs (i, SSEA1. j, NANOG. k, DAPI. l, merge; m, CDH1. n, SOX2. o, DAPI. p, merge). q COBRA demonstrated the parental imprinting characteristics of SSCs, GSPCs and ES-like cells. r The schematic procedure of SSCs transformation into GSPCs and ES-like was summarized. Scale bar = 20 μm
Fig. 4
Fig. 4
Analysis of transcriptomic characteristics of SSCs, intermediate state cells, GSPCs and ES-like cells. a The illustration of sample collection for RNA-sequencing. b-c Violin Plot (b) and heatmap (c) of DEGs identified from the SSCs, In, GSPCs and ES-like cells. d-e Venn diagrams summarized the up-regulated genes (d) and down-regulated genes (e) in In vs. SSCs and GSPCs vs. SSCs. f The relative expression levels of Btc, Apln, Rac1 and Bcl2 genes in SSCs, In state cells and GSPCs were determined using RT-PCR, and were statistically analyzed, *p < 0.05; **p < 0.01. g KEGG of differential genes in SSCs, In state cells, GSPCs, ES-like cells and shared by two datasets. h Hallmarks of differential genes in SSCs, In state cells, GSPCs and ES-like cells. i The relative expression levels of pluripotency associated genes in SSCs, In state cells, GSPCs and ES-like cells were exhibited. j Representative DEGs in SSCs, In, GSPCs and ES-like cells were selected. Left, fold change. Blue, downregulated genes; red, upregulated genes. Right, false discovery rate (FDR)-adjusted p values determined using DESeq2 (–log10-transformed). * represents a remarkable difference. k The relative expression levels of Plzf, Etv5, Dnmt1 and Ccnd1 genes in SSCs, In state cells, GSPCs and ES-like cells were determined using RT-PCR, and were statistically analyzed, *p < 0.05; **p < 0.01
Fig. 5
Fig. 5
Verification of the transformation mediated by RAS and p38 signaling pathways. a-d The morphology of SSCs after 5 passages were cultured in medium 1 (a), medium 10 (b), medium 11 (c) and medium 2 (d) for another 5 passages was exhibited. e The strategy to screen the key time point of SSCs transformation through culturing SSCs in medium 10, and replacing the medium with medium 11 at different passages. f-g The relative expression levels of Rac1, Hras, Kras, Snail and Gapdh in SSCs after addition of EGF into medium 1 (f), and expression of Stat3, Kras, Hras, Nras, Snail and Gapdh in SSCs after addition of LIF into medium 1 (g) were detected using RT-PCR. h The relative expression levels of Rac1, Hras, Kras, Smad3, Stat3, Nras, Snail and Gapdh in SSCs after EGF supplement into medium 2 were detected using RT-PCR. i A regulatory pattern of EGF and LIF on Klf4, Myc, p38, Snail and Smad3 was summarized. j-n The morphology of SSCs after 20 passages (j) were cultured in medium 1 (k), medium 2 (l), medium 2 plus BMS-582949 (m) and medium 1 plus BMS-582949 (n) for another 3 passages, respectively. o-p. Western blot determined the expression levels of NANOG, SOX2, MVH, PLZF and β-tubulin in SSCs of 20 passages after treatment of BMS-582949 (1. SSCs in medium 1, 2. SSCs in medium 2, 3. SSCs in medium 2 + BMS-582949, 4. SSCs in medium 1 + BMS-582949) (o), and the results were statistically analyzed (p). q The expression levels of Acvr1b, Bmpr1a, Bmpr1b, Bmpr2, Fgfr3, Fgfr4, Hras, Kras, Nodal, Nras, Rac1, Snail, Tgfr1, Tgfr2, Tgfr3 and Zeb2 in SSCs, In state cells, GSPCs and ES-like cells were detected using RT-PCR. Scale bar = 20 μm, data represent as mean ± SD *p < 0.05; **p < 0.01
Fig. 6
Fig. 6
CHIR99021 + PD0325901 enhanced pluripotency in GSPCs and ES-like cells. a-d The morphology of GSPCs cultured in medium 2 (a), or in medium 7 for 1 passage (b), 4 passages (c) and 10 passages (arrowheads indicate some recovered colonies with compact structure) (d) was exhibited. e The morphology of ES-like cells cultured in medium 8 for 10 passages was exhibited. f-k IF staining assays were used to detect the expression of NANOG in GSPCs cultured in medium 7 (f, NANOG. g, DAPI. h, Merge) and ES-like cells cultured in medium 8 for 10 passages (i, NANOG. j, DAPI. k, Merge). m-p The morphologies of ES-like cells cultured in medium 3 (m), or medium 9 for 1 passage (n), 6 passages (arrowheads indicate some recovered colonies with compact structure) (o) and 10 passages (p), were exhibited. q-s Expression of NANOG in ES-like cells cultured in medium 9 was detected (q, NANOG. r, DAPI. s, Merge). t Expression levels of NANOG, OCT4, MVH and β-tubulin in ES-like cells cultured in medium 3 or medium 9 for 10 passages were determined using Western blot. u-v Expression levels of NANOG, SOX2, MVH, PLZF and β-tubulin in GSPCs (u) and ES-like cells (v) cultured with CHIR99021, PD0325901 or CHIR99021 + PD0325901 were determined using Western blot. w-x Growth curves of GSPCs (w) and ES-like cells (x) cultured with CHIR99021, PD0325901 or CHIR99021 + PD0325901 were exhibited. Scale bar = 20 μm, data represent as mean ± SD *p < 0.05; **p < 0.01
Fig. 7
Fig. 7
Long-term cultured SSCs failed to transform on laminin. a-d The morphologies of SSCs after 30 passages grown on MEF feeder (a) were transferred to laminin for 1 passage (b) and another 5 passages (arrowheads indicate some newly formed colonies) (c), and primary SSCs cultured on laminin for 10 passages (d) were exhibited. e-h IF staining was used to detect PLZF (e), NANOG (f), DAPI (g) and merge (h) in SSCs of 30 passages cultured on MEF feeder layer. i-p IF staining was used to detect PLZF (i), NANOG (j), DAPI (i), DAPI (k), merge from i to k (l), OCT4 (m), SOX2 (n), DAPI (o) and merge of m to o (p) in SSCs of 30 passages cultured on MEF feeder and subsequently cultured on laminin for 5 passages (arrows indicate representative cell clusters exhibited by immunofluorescence). Scale bar = 20 μm

Similar articles

Cited by

References

    1. Phillips BT, Gassei K, Orwig KE. Spermatogonial stem cell regulation and spermatogenesis. Philos Trans R Soc Lond B Biol Sci. 2010;365(1546):1663–78. doi: 10.1098/rstb.2010.0026. - DOI - PMC - PubMed
    1. Stevens LC. Spontaneous and experimentally induced testicular teratomas in mice. Cell Differ. 1984;15(2–4):69–74. doi: 10.1016/0045-6039(84)90054-X. - DOI - PubMed
    1. Labosky PA, Barlow DP, Hogan BL. Mouse embryonic germ (EG) cell lines: transmission through the germline and differences in the methylation imprint of insulin-like growth factor 2 receptor (Igf2r) gene compared with embryonic stem (ES) cell lines. Development. 1994;120(11):3197–204. doi: 10.1242/dev.120.11.3197. - DOI - PubMed
    1. Pinto MT et al. Molecular Biology of Pediatric and Adult Male Germ Cell tumors. Cancers (Basel), 2021. 13(10). - PMC - PubMed
    1. Oosterhuis JW, Looijenga LH. Testicular germ-cell tumours in a broader perspective. Nat Rev Cancer. 2005;5(3):210–22. doi: 10.1038/nrc1568. - DOI - PubMed