Review
. 2024 May;22(5):1078-1100.
doi: 10.1111/pbi.14247. Epub 2023 Dec 2.

Molecular responses of agroinfiltrated Nicotiana benthamiana leaves expressing suppressor of silencing P19 and influenza virus-like particles

Affiliations
Review

Molecular responses of agroinfiltrated Nicotiana benthamiana leaves expressing suppressor of silencing P19 and influenza virus-like particles

Louis-Philippe Hamel et al. Plant Biotechnol J. 2024 May.

Abstract

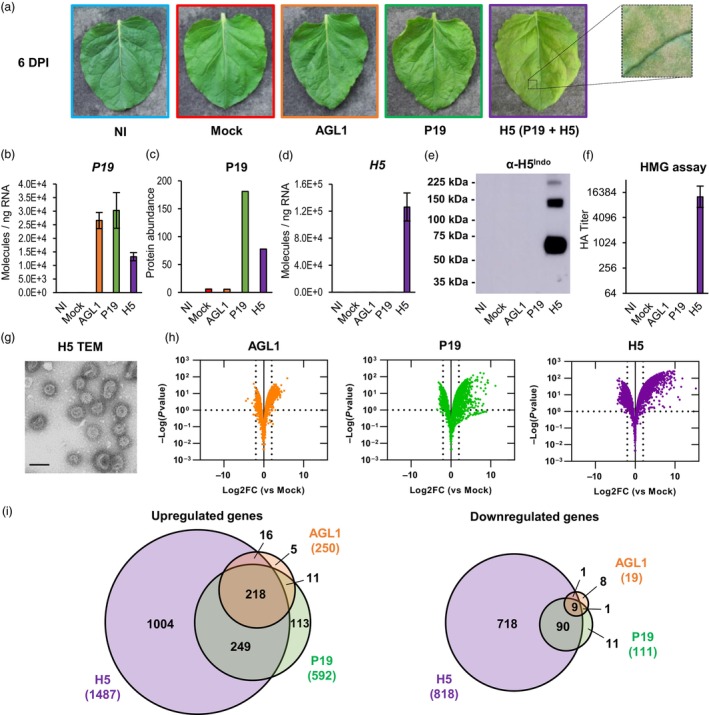
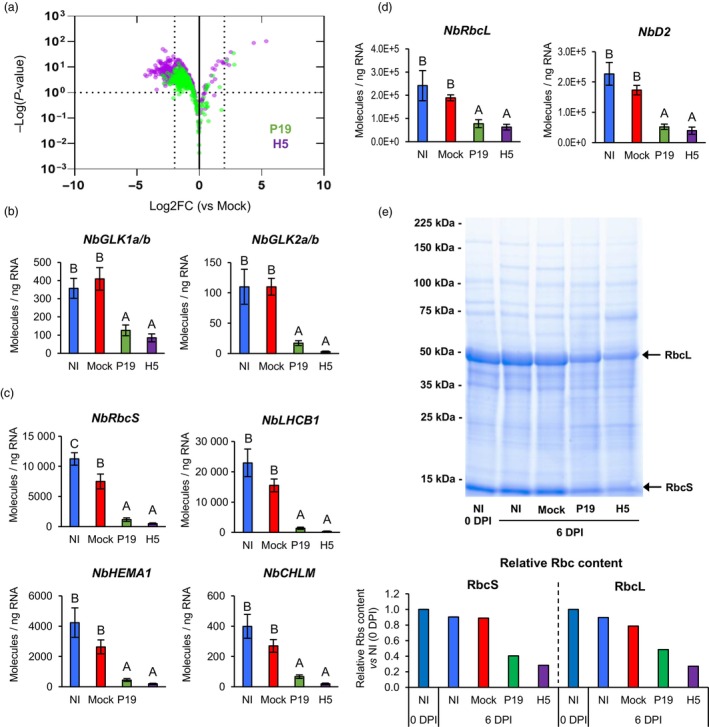
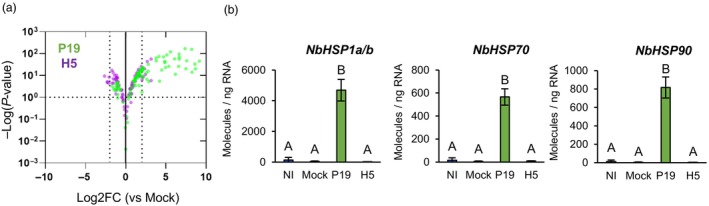
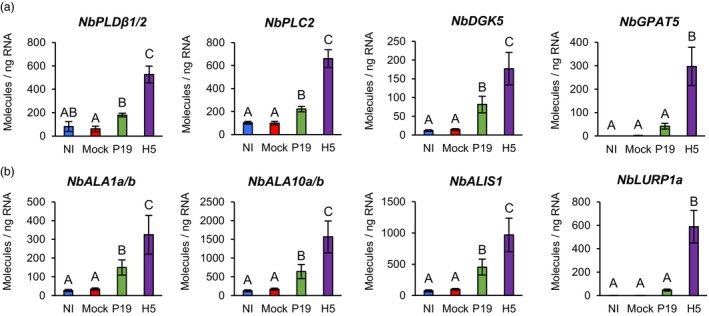
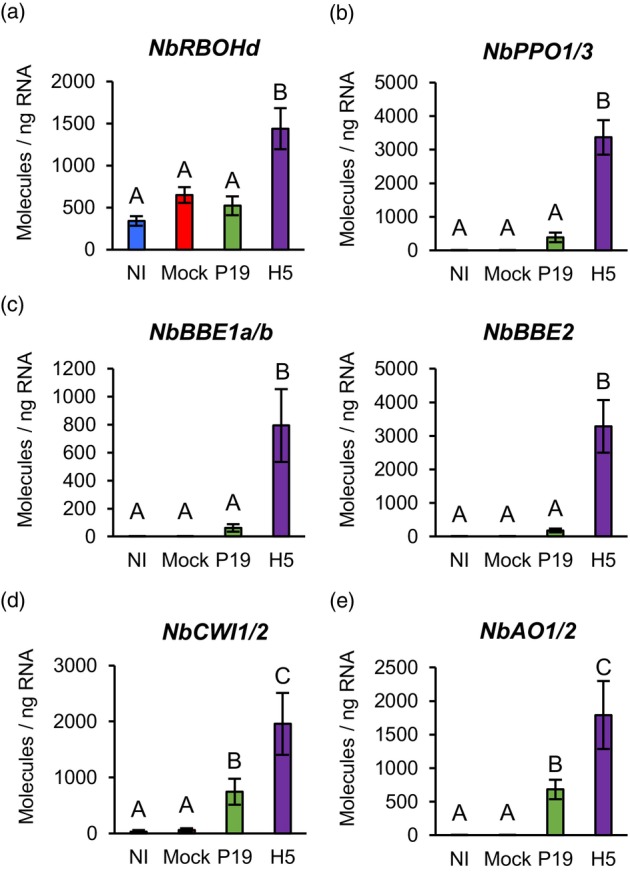
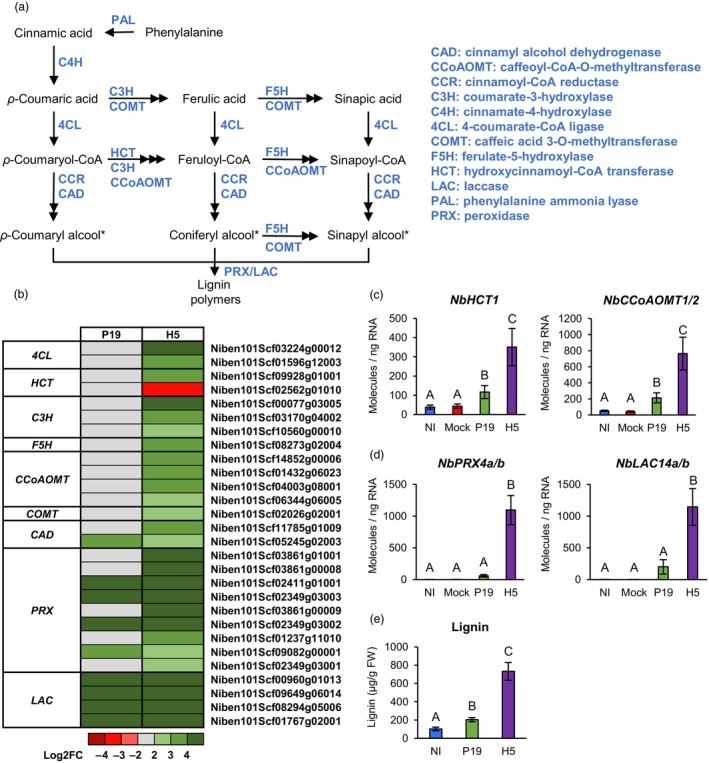
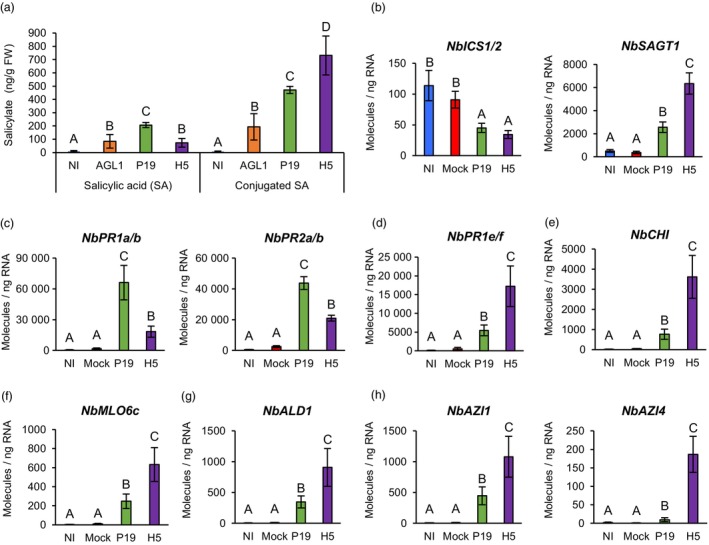
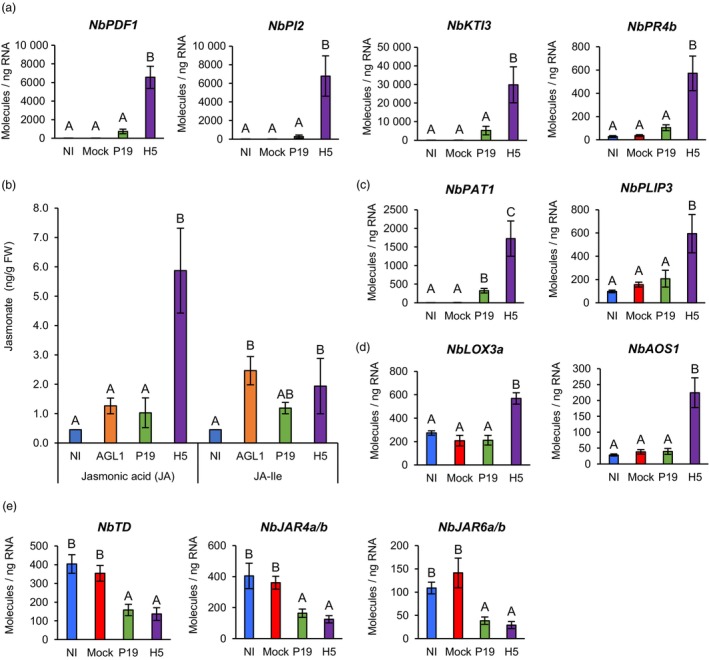
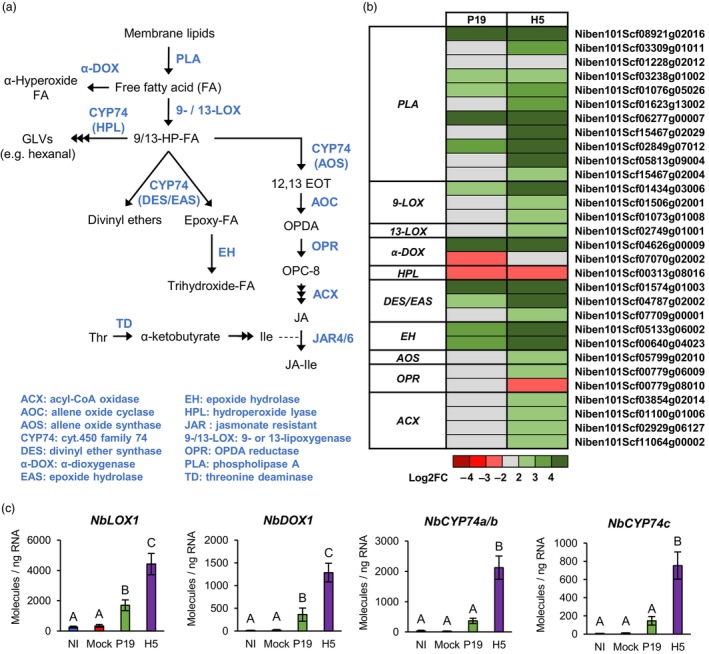
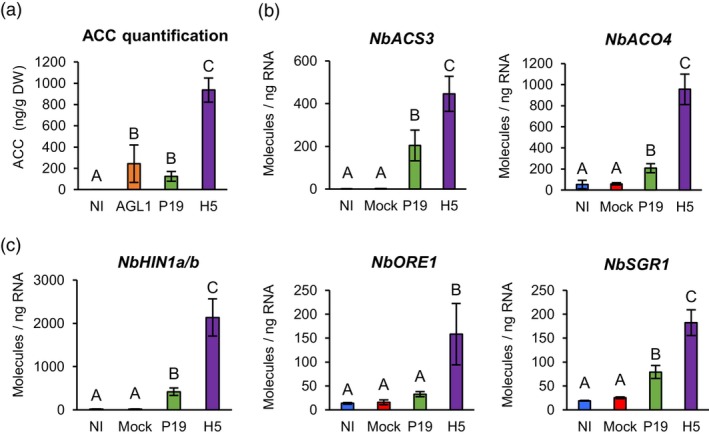
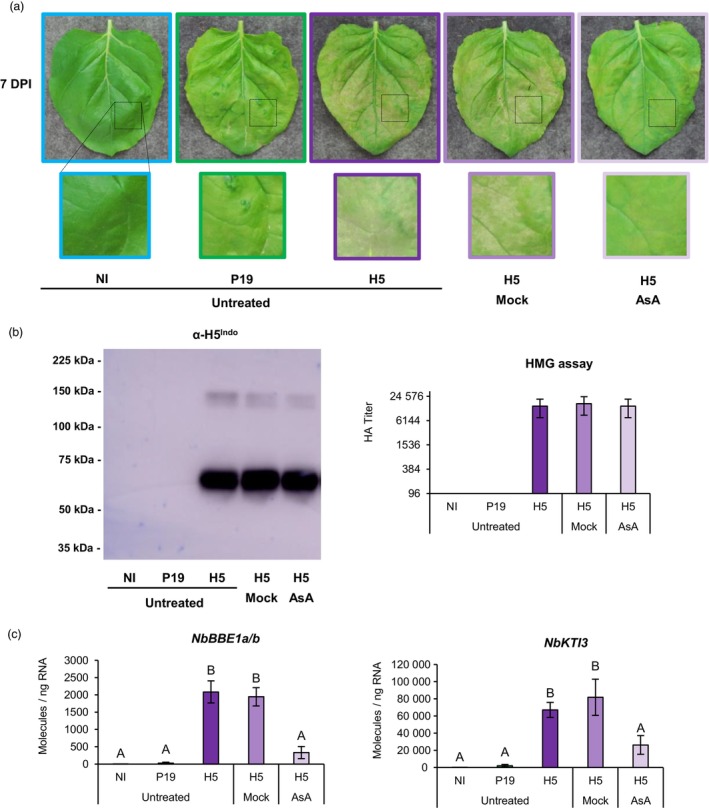
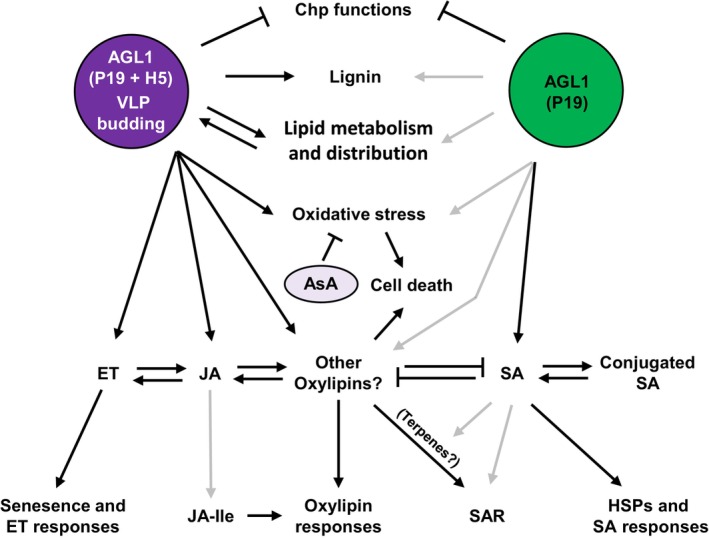
The production of influenza vaccines in plants is achieved through transient expression of viral hemagglutinins (HAs), a process mediated by the bacterial vector Agrobacterium tumefaciens. HA proteins are then produced and matured through the secretory pathway of plant cells, before being trafficked to the plasma membrane where they induce formation of virus-like particles (VLPs). Production of VLPs unavoidably impacts plant cells, as do viral suppressors of RNA silencing (VSRs) that are co-expressed to increase recombinant protein yields. However, little information is available on host molecular responses to foreign protein expression. This work provides a comprehensive overview of molecular changes occurring in Nicotiana benthamiana leaf cells transiently expressing the VSR P19, or co-expressing P19 and an influenza HA. Our data identifies general responses to Agrobacterium-mediated expression of foreign proteins, including shutdown of chloroplast gene expression, activation of oxidative stress responses and reinforcement of the plant cell wall through lignification. Our results also indicate that P19 expression promotes salicylic acid (SA) signalling, a process dampened by co-expression of the HA protein. While reducing P19 level, HA expression also induces specific signatures, with effects on lipid metabolism, lipid distribution within membranes and oxylipin-related signalling. When producing VLPs, dampening of P19 responses thus likely results from lower expression of the VSR, crosstalk between SA and oxylipin pathways, or a combination of both outcomes. Consistent with the upregulation of oxidative stress responses, we finally show that reduction of oxidative stress damage through exogenous application of ascorbic acid improves plant biomass quality during production of VLPs.

Keywords: Nicotiana benthamiana; Influenza hemagglutinin; Plant immunity; Plant molecular farming; Transient Agrobacterium‐mediated expression; Virus‐like particles.


Conflict of interest statement

At the time of this work, L.P.H., R.T., F.P.G., M.E.P., E.R., M.A.C., P.O.L and M.A.D. were employees of Medicago Inc. Other authors declare that the research was conducted in the absence of any commercial or financial relationships that could be construed as a potential conflict of interest.

Figures

Figure 1
Figure 1
Stress symptoms and analysis of biomass used for transcriptomics. (a) Stress symptoms observed on representative leaves from each condition harvested at 6 DPI. A magnified leaf section highlights necrotic flecking seen when expressing H5. (b) Expression of recombinant gene P19 as measured by RTqPCR at 6 DPI. Results are expressed in numbers of molecules per ng of RNA. (c) Abundance of the P19 protein as measured by iTRAQ proteomics. Results are expressed in total numbers of P19 peptides detected at 6 DPI. (d) Expression of recombinant gene H5 as measured by RTqPCR. (e) Western blot confirming H5 protein accumulation. (f) Hemagglutination (HMG) assay confirming HA protein activity (g) Transmission electron microscopy (TEM) confirming production of influenza VLPs. Scale bar equals 100 nm. (h) Volcano plots depicting global transcriptional changes at 6 DPI after AGL1 infiltration (left panel), P19 expression (middle panel) or P19 and H5 co‐expression (right panel). Dashed lines represent expression thresholds: Log2FC ≥ 2 or ≤−2 and padj <0.1. (i) Venn diagrams depicting up‐ and down‐regulated genes after pairwise comparisons: AGL1 versus Mock, P19 versus Mock and H5 versus Mock. Circle size is proportional to the number of significantly regulated genes. Genes specific to AGL1 samples are shown in orange. Genes specific to P19 samples are shown in green. Genes specific to H5 samples are shown in purple. Diagram intersects show genes common to more than one condition. Condition names are as follows: NI, non‐infiltrated leaves; Mock, leaves infiltrated with buffer only; AGL1, leaves infiltrated with Agrobacterium strain AGL1 that carry a binary vector control; P19, leaves infiltrated with AGL1 and expressing P19 only; H5, leaves infiltrated with AGL1 and co‐expressing P19 and H5.
Figure 2
Figure 2
Down‐regulation of chloroplast‐related genes and decreased RuBisCO content. (a) Volcano plot depicting impact of P19 expression (green) or P19 and H5 co‐expression (purple) on CRGs at 6 DPI. Comparisons of RNAseq data were made using the Mock treatment as a control. Dashed lines represent expression thresholds: Log2FC ≥ 2 or ≤−2 and padj <0.1. Expression of NbGLK genes (b), of nuclear genes encoding chloroplast‐localized proteins (c) and of genes located on the chloroplast genome (d) as measured by RTqPCR at 6 DPI. Results are expressed in numbers of molecules per ng of RNA. Groups that do not share the same letter are statistically different. (e) Total protein extracts from various conditions harvested at 0 or 6 DPI. Following SDS‐PAGE analysis, gel was stained with Coomassie blue. Arrows highlight RuBisCO small and large subunits (RbcS and RbcL, respectively). Underneath bar graph depict relative RbcS and RbcL content as measured by densitometry. Rbc subunit content from leaves harvested prior to infiltration (0 DPI) were arbitrarily set at one‐fold. Condition names are as follows: NI, non‐infiltrated leaves; Mock: leaves infiltrated with buffer only; P19, leaves infiltrated with AGL1 and expressing P19 only; H5, leaves infiltrated with AGL1 and co‐expressing P19 and H5.
Figure 3
Figure 3
Upregulation of HSP and chaperone genes by P19 expression. (a) Volcano plot depicting impact of P19 expression (green) or P19 and H5 co‐expression (purple) on HSP and chaperone genes at 6 DPI. Comparisons of RNAseq data were made using the Mock treatment as a control. Dashed lines represent expression thresholds: Log2FC ≥ 1 or ≤−1 and padj <0.1. (b) Expression of HSP genes as measured by RTqPCR. Results are expressed in numbers of molecules per ng of RNA. Groups that do not share the same letter are statistically different. Condition names are as follows: NI, non‐infiltrated leaves; Mock, leaves infiltrated with buffer only; P19, leaves infiltrated with AGL1 and expressing P19 only; H5, leaves infiltrated with AGL1 and co‐expressing P19 and H5.
Figure 4
Figure 4
Expression of lipid‐related genes. Expression of genes involved in lipid metabolism and signalling (a), or in distribution of lipids within membranes (b) as measured by RTqPCR at 6 DPI. Results are expressed in numbers of molecules per ng of RNA. Groups that do not share the same letter are statistically different. Condition names are as follows: NI, non‐infiltrated leaves; Mock, leaves infiltrated with buffer only; P19, leaves infiltrated with AGL1 and expressing P19 only; H5, leaves infiltrated with AGL1 and co‐expressing P19 and H5.
Figure 5
Figure 5
Expression of genes linked to the activation of oxidative stress. Expression of genes encoding NADPH oxidase (a), PPOs (b), secreted carbohydrate oxidases of the BBE family (c), CWIs (d) or secreted AOs (e) as measured by RTqPCR at 6 DPI. Results are expressed in numbers of molecules per ng of RNA. Groups that do not share the same letter are statistically different. Condition names are as follows: NI, non‐infiltrated leaves; Mock, leaves infiltrated with buffer only; P19, leaves infiltrated with AGL1 and expressing P19 only; H5, leaves infiltrated with AGL1 and co‐expressing P19 and H5.
Figure 6
Figure 6
Expression of lignin‐related genes and lignin quantification. (a) Overview of the lignin biosynthesis pathway. Metabolites are shown in black, while enzymes are shown in blue. Monolignol precursors of lignin are marked with an asterisk. (b) Heat‐map depicting expression of genes involved in monolignol precursor synthesis or lignin polymerization in the cell wall at 6 DPI. Each line represents a gene shown in the Table S7. Grey indicates genes that are not differentially expressed. Green are red coloured gradients, respectively reflect extent of gene up‐ and down‐regulation, as indicated. At 6 DPI, RTqPCR confirms upregulation of monolignol synthesis genes (c), as well as genes involved in lignin polymerization (d). Results are expressed in numbers of molecules per ng of RNA. (e) Lignin accumulation at 6 DPI. Results are expressed in ug of lignin per g of biomass fresh weight (FW). Groups that do not share the same letter are statistically different. Condition names are as follows: NI, non‐infiltrated leaves; Mock, leaves infiltrated with buffer only; P19, leaves infiltrated with AGL1 and expressing P19 only; H5, leaves infiltrated with AGL1 and co‐expressing P19 and H5.
Figure 7
Figure 7
Salicylate accumulation and expression of SA‐ and SAR‐related genes. (a) Accumulation of SA and conjugated SA at 6 DPI. Results are expressed in ng of salicylate per g of biomass fresh weight (FW). RTqPCR confirms that salicylate accumulation is coupled to the expression of SA regulatory genes (b) and of SA response genes (c). RTqPCR was also performed to assess expression of different SAR response genes (d, e and f) and of SAR regulatory genes (g and h). RTqPCR results are expressed in numbers of molecules per ng of RNA. Groups that do not share the same letter are statistically different. Condition names are as follows: NI, non‐infiltrated leaves; Mock, leaves infiltrated with buffer only; AGL1, leaves infiltrated with Agrobacterium strain AGL1 that carry a binary vector control; P19, leaves infiltrated with AGL1 and expressing P19 only; H5, leaves infiltrated with AGL1 and co‐expressing P19 and H5.
Figure 8
Figure 8
Jasmonate accumulation and expression of oxylipin‐related genes. (a) Expression of oxylipin response genes as measured by RTqPCR at 6 DPI. (b) Accumulation of JA and JA‐Ile at 6 DPI. Results are expressed in ng of jasmonate per g of biomass fresh weight (FW). RTqPCR was also performed on genes encoding PLAs (c), as well as on genes involved in JA (d) and JA‐Ile (e) biosynthesis. RTqPCR results are expressed in numbers of molecules per ng of RNA. Groups that do not share the same letter are statistically different. Condition names are as follows: NI, non‐infiltrated leaves; Mock, leaves infiltrated with buffer only; AGL1, leaves infiltrated with Agrobacterium strain AGL1 that carry a binary vector control; P19, leaves infiltrated with AGL1 and expressing P19 only; H5, leaves infiltrated with AGL1 and co‐expressing P19 and H5.
Figure 9
Figure 9
Expression of additional oxylipin regulatory genes. (a) Overview of the octadecanoid pathway. Metabolic intermediates are shown in black while enzymes are shown in blue. (b) Heat‐map depicting expression of genes involved in oxylipin metabolism at 6 DPI. Each line represents a gene shown in the Table S9. Grey indicates genes that are not differentially expressed. Green are red coloured gradients respectively reflect extent of gene up‐ and down‐regulation, as indicated. (c) Expression of genes involved in the synthesis of oxylipins other than JA as measured by RTqPCR at 6 DPI. Results are expressed in numbers of molecules per ng of RNA. Groups that do not share the same letter are statistically different. Condition names are as follows: NI, non‐infiltrated leaves; Mock, leaves infiltrated with buffer only; P19, leaves infiltrated with AGL1 and expressing P19 only; H5, leaves infiltrated with AGL1 and co‐expressing P19 and H5.
Figure 10
Figure 10
ACC accumulation and expression of ET/senescence‐related genes. (a) Accumulation of ET precursor ACC at 6 DPI. Results are expressed in ng of ACC per g of biomass dry weight (DW). RTqPCR confirms that ACC accumulation is coupled to the expression of genes involved in ET synthesis (b). RTqPCR was also performed on senescence‐related genes (c). RTqPCR results are expressed in numbers of molecules per ng of RNA. Groups that do not share the same letter are statistically different. Condition names are as follows: NI: non‐infiltrated leaves; Mock, leaves infiltrated with buffer only; AGL1, leaves infiltrated with Agrobacterium strain AGL1 that carry a binary vector control; P19, leaves infiltrated with AGL1 and expressing P19 only; H5, leaves infiltrated with AGL1 and co‐expressing P19 and H5.
Figure 11
Figure 11
Ascorbic acid reduces H5‐induced defences and stress symptoms. (a) Stress symptoms observed on representative leaves from each condition harvested at 7 DPI. Underneath each leaf picture, a magnified leaf section highlights differences in intensity of the observed symptoms. (b) Western blot depicting H5 protein accumulation (left panel). Hemagglutination (HMG) assay also highlights HA protein activity (right panel). (c) Expression of H5‐induced genes NbBBE1a/b and NbKTI3 as measured by RTqPCR at 7 DPI. Results are expressed in numbers of molecules per ng of RNA. Groups that do not share the same letter are statistically different. Condition names are as follows: NI: non‐infiltrated leaves; P19: leaves infiltrated with AGL1 and expressing P19 only; H5: leaves infiltrated with AGL1 and co‐expressing P19 and H5; H5 Mock: H5‐expressing leaves sprayed at 48 h intervals with a Mock solution; H5 AsA: H5‐expressing leaves sprayed at 48 h intervals with a 10 mm solution of ascorbic acid (AsA).
Figure 12
Figure 12
Model of plant responses to P19 and VLP expression. In response to foreign protein expression, some plant responses are shared between conditions, while others are specific to either expression of P19 only (green) or co‐expression of P19 and H5 proteins (purple; see text for details). Black and grey arrows indicate strong or weak activation, respectively. AsA, ascorbic acid; Chp, chloroplast; ET, ethylene; HA, hemagglutinin; HSP, heat shock protein; JA, jasmonic acid; JA‐Ile, jasmonic acid isoleucine conjugate; SA, salicylic acid; SAR, systemic acquired resistance; VLP, virus‐like particle.

References

    1. Anand, A. , Uppalapati, S.R. , Ryu, C.M. , Allen, S.N. , Kang, L. , Tang, Y. and Mysore, K.S. (2008) Salicylic acid and systemic acquired resistance play a role in attenuating crown gall disease caused by Agrobacterium tumefaciens . Plant Physiol. 146, 703–715. - PMC - PubMed
    1. Banerjee, A. and Hamberger, B. (2018) P450s controlling metabolic bifurcations in plant terpene specialized metabolism. Phytochem. Rev. 17, 81–111. - PMC - PubMed
    1. Bateman, A. , Finn, R.D. , Sims, P.J. , Wiedmer, T. , Biegert, A. and Soding, J. (2009) Phospholipid scramblases and Tubby‐like proteins belong to a new superfamily of membrane tethered transcription factors. Bioinformatics 25, 159–162. - PMC - PubMed
    1. Binder, B.M. (2020) Ethylene signaling in plants. J. Biol. Chem. 295, 7710–7725. - PMC - PubMed
    1. Bosch, M. , Wright, L.P. , Gershenzon, J. , Wasternack, C. , Hause, B. , Schaller, A. and Stintzi, A. (2014) Jasmonic acid and its precursor 12‐oxophytodienoic acid control different aspects of constitutive and induced herbivore defenses in tomato. Plant Physiol. 166, 396–410. - PMC - PubMed