

The impact of water exchange on estimates of myocardial extracellular volume calculated using contrast enhanced T1 measurements: A preliminary analysis in patients with severe aortic stenosis
- PMID: 38041477
- PMCID: PMC10872615
- DOI: 10.1002/mrm.29956
The impact of water exchange on estimates of myocardial extracellular volume calculated using contrast enhanced T1 measurements: A preliminary analysis in patients with severe aortic stenosis
Abstract
Purpose: Guidelines recommend measuring myocardial extracellular volume (ECV) using T1 -mapping before and 10-30 min after contrast agent administration. Data are then analyzed using a linear model (LM), which assumes fast water exchange (WX) between the ECV and cardiomyocytes. We investigated whether limited WX influences ECV measurements in patients with severe aortic stenosis (AS).
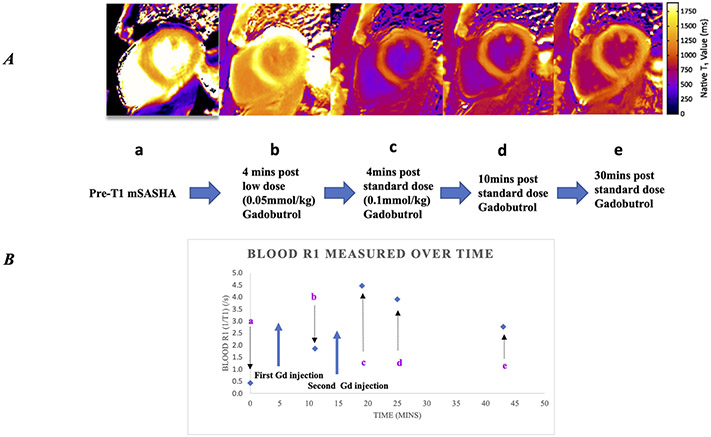
Methods: Twenty-five patients with severe AS and 5 healthy controls were recruited. T1 measurements were made on a 3 T Siemens system using a multiparametric saturation-recovery single-shot acquisition (a) before contrast; (b) 4 min post 0.05 mmol/kg gadobutrol; and (c) 4 min, (d) 10 min, and (e) 30 min after an additional gadobutrol dose (0.1 mmol/kg). Three LM-based ECV estimates, made using paired T1 measurements (a and b), (a and d), and (a and e), were compared to ECV estimates made using all 5 T1 measurements and a two-site exchange model (2SXM) accounting for WX.
Results: Median (range) ECV estimated using the 2SXM model was 25% (21%-39%) for patients and 26% (22%-29%) for controls. ECV estimated in patients using the LM at 10 min following a cumulative contrast dose of 0.15 mmol/kg was 21% (17%-32%) and increased significantly to 22% (19%-35%) at 30 min (p = 0.0001). ECV estimated using the LM was highest following low dose gadobutrol, 25% (19%-38%).
Conclusion: Current guidelines on contrast agent dose for ECV measurements may lead to underestimated ECV in patients with severe AS because of limited WX. Use of a lower contrast agent dose may mitigate this effect.
Keywords: T1; aortic stenosis; extracellular volume; water exchange.
© 2023 The Authors. Magnetic Resonance in Medicine published by Wiley Periodicals LLC on behalf of International Society for Magnetic Resonance in Medicine.
Figures


References
-
- Messroghli DR, Moon JC, Ferreira VM, et al. Clinical recommendations for cardiovascular magnetic resonance mapping of T1, T2, T2* and extracellular volume: A consensus statement by the Society for Cardiovascular Magnetic Resonance (SCMR) endorsed by the European Association for Cardiovascular Imaging (EACVI). J Cardiovasc Magn Reson. 2017;19(1):75. - PMC - PubMed
-
- Landis CS, Li X, Telang FW, et al. Determination of the MRI contrast agent concentration time course in vivo following bolus injection: effect of equilibrium transcytolemmal water exchange. Magn Reson Med. 2000;44(4):563–574. - PubMed
-
- Landis CS, Li X, Telang FW, et al. Equilibrium transcytolemmal water-exchange kinetics in skeletal muscle in vivo. Magn Reson Med. 1999;42(3):467–478. - PubMed
MeSH terms
Substances
Grants and funding
LinkOut - more resources
Full Text Sources
Research Materials
