. 2024 May;20(5):1147-1158.
doi: 10.1080/15548627.2023.2286414. Epub 2023 Dec 2.

Basal activity of PINK1 and PRKN in cell models and rodent brain

Affiliations

Basal activity of PINK1 and PRKN in cell models and rodent brain

Jens O Watzlawik et al. Autophagy. 2024 May.

Abstract

The ubiquitin kinase-ligase pair PINK1-PRKN recognizes and transiently labels damaged mitochondria with ubiquitin phosphorylated at Ser65 (p-S65-Ub) to mediate their selective degradation (mitophagy). Complete loss of PINK1 or PRKN function unequivocally leads to early-onset Parkinson disease, but it is debated whether impairments in mitophagy contribute to disease later in life. While the pathway has been extensively studied in cell culture upon acute and massive mitochondrial stress, basal levels of activation under endogenous conditions and especially in vivo in the brain remain undetermined. Using rodent samples, patient-derived cells, and isogenic neurons, we here identified age-dependent, brain region-, and cell type-specific effects and determined expression levels and extent of basal and maximal activation of PINK1 and PRKN. Our work highlights the importance of defining critical risk and therapeutically relevant levels of PINK1-PRKN signaling which will further improve diagnosis and prognosis and will lead to better stratification of patients for future clinical trials.

Keywords: Mitophagy; PINK1; PRKN; Parkinson disease; parkin; ubiquitin.


Conflict of interest statement

Mayo Clinic, F.C.F., and W.S. have filed a patent related to PRKN activators. Additional funding sources to disclose but not pertinent to the current study include a grant from Amazentis SA (to W.S.). Z.K.W. serves as PI or Co-PI on projects/grants from Biohaven Pharmaceuticals, Inc., Neuraly, Inc., and Vigil Neuroscience, Inc., and is an external advisory board member for Vigil Neuroscience, Inc., and a consultant on neurodegenerative medical research for Eli Lilly & Company. All other authors declare they have no competing interests. This research was conducted in compliance with Mayo Clinic conflict of interest policies.

Figures

Figure 1.
Figure 1.
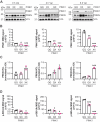
Complete loss of PINK1 in mouse brain stabilizes PRKN protein while partial loss dampens p-S65-Ub levels. PRKN and p-S65-Ub levels were determined at basal conditions in hemibrain lysates from mice with the following genotypes: WT (n = 29), heterozygous Prkn+/- (n = 23), homozygous prkn-/- (n = 29), heterozygous Pink1+/- (n = 15), homozygous pink1-/- (n = 22). For better comparison, mice were grouped and analyzed by genotype: WT, prkn-/-, pink1-/- (left); WT, Prkn+/-, prkn-/- (middle); and WT, Pink1+/-, pink1-/- (right). (A) Representative western blots obtained with three different anti-PRKN antibodies (Prk8, 2132, and 5C3) are shown together with the loading control GAPDH. An open arrowhead labels the truncated PRKN-EGFP fusion protein produced in the prkn-/- samples. (B) PRKN (Prk8) protein levels were assessed by densitometry with data points shown as ratio PRKN divided by GAPDH (median ± interquartile range [IQR]). Quantification of PRKN protein using the other two antibodies can be found in Fig. S1A and B. (C) p-S65-Ub levels were quantified by sandwich ELISA with data points shown as median ± IQR. Data was analyzed by using a Kruskal-Wallis test combined with Dunn’s multiple comparison test (***, p < 0.0005; *, p < 0.05). Comparisons to the WT are shown on top of data points, while comparisons between other genotypes are indicated by brackets.
Figure 2.
Figure 2.
PINK1 gene dosage affects p-S65-Ub and PRKN levels in PD patients’ cells. Primary skin fibroblasts from related individuals without (QQ; n = 2), with one (QX; n = 3) or with two (XX; n = 2) mutant PINK1 Q456X alleles were either left untreated (0 h, left) or were treated for 2 h (middle) or 8 h (right) with 1 µM valinomycin (Val). Data is arranged by treatment groups (i.e., time points). (A) Cell lysates were analyzed by western blot using antibodies against PINK1, PRKN, and the loading control VCL (vinculin). (B) Protein levels of PINK1 were quantified by sandwich ELISA. (C) PRKN protein levels were derived by densitometry of the western blots and data points shown as a ratio of PRKN divided by VCL and normalized to PINK1XX. (D) p-S65-Ub levels were also quantified by sandwich ELISA. Data is shown as the mean ± standard error of the mean of biological replicates, grouped by allele count of the Q456X mutation, and analyzed by one-way ANOVA with Tukey’s multiple comparison test (***, p < 0.0005; **, p < 0.005; *, p < 0.05). For untreated the mean of 4 technical repeats per biological sample is shown. Asterisks on top of data points indicate individual comparison to WT controls without PINK1 mutation.
Figure 3.
Figure 3.
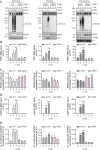
Cell type-specific expression of PINK1 and PRKN in fibroblasts, iPSCs, and midbrain DA neurons drive p-S65-Ub levels. Primary skin fibroblasts from either a control or patient with PINK1I368N mutation, and undifferentiated iPS cells that were generated from the same PINK1I368N patient cells and their gene-corrected counterparts (isogenic WT), as well as DA neurons generated from the same iPSC set were treated with 1 µM valinomycin (Val) for the indicated times and harvested. (A) Representative western blots show levels of PINK1, PRKN, p-S65-Ub and MFN2 for all three cell lines. VCL (vinculin) and DA neuronal markers, TUBB3/βIII-tubulin and TH (tyrosine hydroxylase), were used as loading controls. (B) Quantification of PINK1 protein levels by sandwich ELISA. (C) Densitometric analysis of PRKN western blots shown under (A) and data points displayed as PRKN divided by VCL or PRKN divided by DA neuronal markers. (D) Quantification of p-S65-Ub levels measured by sandwich ELISA. (E) Densitometric analysis of MFN2. Relative modification of MFN2 was calculated as the ratio of upper (ubiquitinated) to lower (unmodified) MFN2 band. The mean of three independent experiments for each cell type ± SD is shown. Statistical analysis was performed by one-way ANOVA followed by Bonferroni correction. (***, p < 0.0005; **, p < 0.005; *, p < 0.05). Asterisks on top of data points indicate individual comparison to respective WT controls without PINK1 mutation.

References

    1. Truban D, Hou X, Caulfield TR, et al. PINK1, Parkin, and mitochondrial quality control: what can we learn about Parkinson’s disease pathobiology? J Parkinsons Dis. 2017;7(1):13–29. doi: 10.3233/JPD-160989 - DOI - PMC - PubMed
    1. Geisler S, Holmstrom KM, Skujat D, et al. PINK1/Parkin-mediated mitophagy is dependent on VDAC1 and p62/SQSTM1. Nat Cell Biol. 2010. Feb;12(2):119–131. doi: 10.1038/ncb2012 - DOI - PubMed
    1. Matsuda N, Sato S, Shiba K, et al. PINK1 stabilized by mitochondrial depolarization recruits Parkin to damaged mitochondria and activates latent Parkin for mitophagy. J Cell Bio. 2010. Apr 19;189(2):211–221. doi: 10.1083/jcb.200910140 - DOI - PMC - PubMed
    1. Narendra DP, Jin SM, Tanaka A, et al. PINK1 is selectively stabilized on impaired mitochondria to activate Parkin. PLoS Biol. 2010. Jan 26;8(1):e1000298. doi: 10.1371/journal.pbio.1000298 - DOI - PMC - PubMed
    1. Vives-Bauza C, Zhou C, Huang Y, et al. PINK1-dependent recruitment of Parkin to mitochondria in mitophagy. Proc Natl Acad Sci U S A. 2010. Jan 5;107(1):378–383. doi: 10.1073/pnas.0911187107 - DOI - PMC - PubMed

Publication types