. 2024 Feb 26;36(3):746-763.
doi: 10.1093/plcell/koad300.

The m6A reader ECT1 drives mRNA sequestration to dampen salicylic acid-dependent stress responses in Arabidopsis

Affiliations

The m6A reader ECT1 drives mRNA sequestration to dampen salicylic acid-dependent stress responses in Arabidopsis

Keun Pyo Lee et al. Plant Cell. .

Abstract

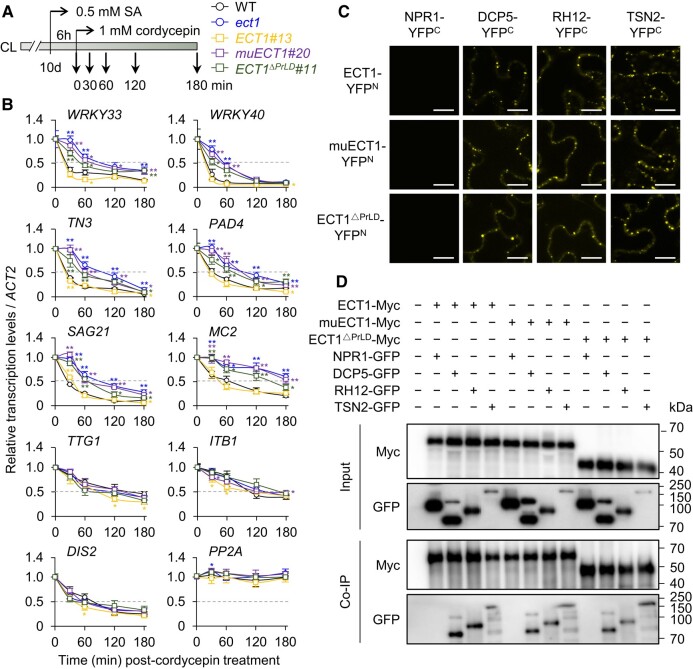
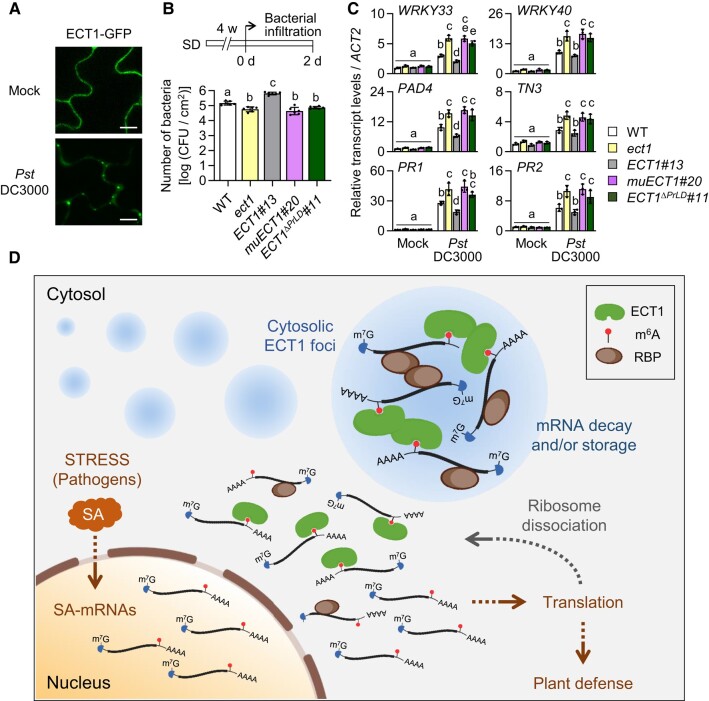
N 6-methyladenosine (m6A) is a common epitranscriptional mRNA modification in eukaryotes. Thirteen putative m6A readers, mostly annotated as EVOLUTIONARILY CONSERVED C-TERMINAL REGION (ECT) proteins, have been identified in Arabidopsis (Arabidopsis thaliana), but few have been characterized. Here, we show that the Arabidopsis m6A reader ECT1 modulates salicylic acid (SA)-mediated plant stress responses. ECT1 undergoes liquid-liquid phase separation in vitro, and its N-terminal prion-like domain is critical for forming in vivo cytosolic biomolecular condensates in response to SA or bacterial pathogens. Fluorescence-activated particle sorting coupled with quantitative PCR analyses unveiled that ECT1 sequesters SA-induced m6A modification-prone mRNAs through its conserved aromatic cage to facilitate their decay in cytosolic condensates, thereby dampening SA-mediated stress responses. Consistent with this finding, ECT1 overexpression promotes bacterial multiplication in plants. Collectively, our findings unequivocally link ECT1-associated cytosolic condensates to SA-dependent plant stress responses, advancing the current understanding of m6A readers and the SA signaling network.


Conflict of interest statement

Conflict of interest statement. None declared.

Figures

Figure 1.
Figure 1.
Multiple YTH family proteins interact with LSD1, and ect1 and ect2 mutant plants are hypersensitive to SA. A) LSD1 interaction with individual YTH family proteins was examined by BiFC assay. The N-terminal part of YFP fused with LSD1 (LSD1-YFPN) was transiently coexpressed with individual YTH family proteins fused with the C-terminal part of the YFP (YFPC) in N. benthamiana leaves. Results were reproduced in at least 2 independent experiments using 3 or more N. benthamiana leaves in each experiment, and representative confocal images are shown at the same scale (scale bars: 20 µm). BF, bright field. B) Fourteen-d-old Arabidopsis plants of WT and single mutants lacking each YTH family protein, initially grown on MS medium under CL, were transferred to MS medium in the absence (mock) or presence (+ SA) of 0.1 mM SA and incubated for 16 d under the same conditions. The representative foliar phenotype of each genotype is shown at the same scale (scale bars: 1 cm). C) The histogram shows the mean plant size per genotype. For measuring plant size, 10 plants per genotype were used. Error bars represent ± Sd (n = 10). D) Fourteen-d-old plants grown on MS medium under CL were sprayed with either a 0.5 mM SA solution (+ SA) or a mock solution, and foliar tissues were harvested 6 h after the treatment. The relative expression levels of SARGs (PR1 and PR2) were examined by RT-qPCR. Data are represented as mean ± Sd of 3 independent biological replicates. Asterisks in C) and D) indicate significant differences (**P < 0.01, 1-way ANOVA with Dunnett's multiple comparisons test) compared with WT at each mock or SA treatment. Experiments in B) to D) were repeated thrice with similar results.
Figure 2.
Figure 2.
LLPS of ECT1 and SA-driven ECT1 relocalization into cytosolic condensates. A) Subcellular localization of the ECT1-GFP in N. benthamiana leaves treated with either mock or 1 mM SA for 40 min. The right panels show the enlarged area (dashed square boxes) in the left panels (scale bars: 10 µm). B) 3D images of the subcellular ECT1-GFP localization shown in A). Representative Z-stack images taken by confocal microscopy were reconstructed into a 3D image (scale bars: 20 µm). C) Colocalization of ECT1-GFP with SG (UBP1B-RFP) or PB (DCP5-RFP) marker proteins following treatment with 1 mM SA. ECT1-GFP was transiently coexpressed with either UBP1B-RFP or DCP5-RFP in N. benthamiana leaves. The right panels show the enlarged area (dashed square boxes) in the left panels (scale bars: 10 µm). D) Frequency (%) of colocalization of ECT1-GFP foci with UBP1B-RFP or DCP5-RFP. The number of ECT1-GFP foci overlapping with or without DCP5-RFP or UBP1B-RFP within the same area was quantified using at least 10 confocal images, as shown in C). The data are presented as mean ± Sd (n = 10). Asterisk indicates statistically significant difference between mean values (**P < 0.001, Student's t test). E) In vitro LLPS of recombinant GFP-tagged ECT1 proteins (ECT1-GFP). Representative images of GFP and ECT1-GFP proteins in the droplet-promoting buffer containing a crowding agent (10% PEG-8000) (scale bars: 50 µm). The square boxes inside the mages indicate the enlarged areas (scale bars: 5 µm). F) Fluorescence time-lapse microscopy images of ECT1-GFP showing the dynamic fusion of 2 droplets (scale bars: 2 µm). G) Images are representative of ECT1-GFP from FRAP (scale bars: 2 µm). H) Plot shows the quantification of the intensity of recovered fluorescence in the bleached region of ECT1-GFP droplets as shown in G). Data are presented as mean ± Se (n = 21). I) Top: diagrams show intact ECT1 protein-containing PrLD and YTH domain and its domain-deleted variants used for in vivo localization assay in J). Bottom: PrLD and IDRs were predicted using “Prion-Like Amino Acid Composition” (PLAAC; htttp://plaac.wi.mit.edu/) and “Predictor of Natural Disordered Regions” (PONDR; http://pondr.com) algorithms, respectively. J and K) Subcellular localization of PrLD- or YTH domain-deleted ECT1-GFP in N. benthamiana leaves after 1 mM SA treatment (J). The bottom panels show the enlarged area (dashed square boxes) in the top panels (scale bars: 10 µm). The number of CF in the same area (50 µm × 50 µm) is counted using at least 6 confocal images taken from 3 leaves treated with SA (K). Data are presented as mean ± Sd (n = 10). Lowercase letters indicate statistically significant differences between mean values (P < 0.001, 1-way ANOVA with Tukey’s multiple comparisons test). Experiments in A), C), D), J), and K) were repeated thrice with similar results.
Figure 3.
Figure 3.
m6A-binding ability and PrLD-driven cytosolic condensation of ECT1 are required to modulate SA-triggered stress responses. A) RIP coupled with dot blot assay. Three-wk-old ect1 transgenic plants expressing ECT1-GFP (ect1ECT1-GFP#13; ECT1#13), mutated ECT1 (muECT1; ECT1W267A,W324A,W329A)-GFP (ect1muECT1-GFP#20; muECT1#20), or PrLD-deleted ECT1 (ECT1ΔPrLD)-GFP (ect1ECT1ΔPrLD-GFP#11; ECT1ΔPrLD#11) under the control of the CaMV 35S promoter were treated with mock or 1 mM SA (+ SA) for 40 min for the RIP-dot blot assay. RNAs bound to ECT1-GFP, muECT1-GFP, or ECT1ΔPrLD-GFP were immunoprecipitated using GFP-trap beads. Serially diluted RNAs from inputs and eluates were dotted onto the membrane as indicated, and the m6A signals were detected with an m6A antibody. WT plants were used as a negative control. B) RIP-RT-qPCR assays for the inputs and eluates from SA-treated samples (A) were performed to examine ECT1 binding to SA-m6A-mRNAs (WRKY33, WRKY40, WRKY53, PAD4, TN3, MC2, and SAG21) or m6A-prone non-SARGs (TTG1, ITB1, and DIS2). PP2AA3 without m6A modification was used as a negative control. The enrichment value was normalized to the input, presenting as means ± Sd of 3 independent biological replicates. C) Fourteen-d-old plants of WT and ect1 and 2 independent transgenic ect1ECT1-GFP (ECT1#13 and #16), ect1muECT1-GFP (muECT1#20 and #23), and ect1ECT1ΔPrLD-GFP (ECT1ΔPrLD#2 and #11) plants initially grown on MS medium under CL were transferred to MS medium in the absence (mock) or presence (+ SA) of 0.1 mM SA and kept for 16 d under the same condition. The representative foliar phenotype of each genotype is shown at the same scale (scale bars: 1 cm). D) Size of plants as shown in C) was quantified, and the data represent mean ± Sd (n = 10). E) Three-wk-old plants of indicated genotypes were treated with mock or 1 mM SA (+ SA) for 40 min. The relative expression levels of SARGs, including WRKY33, WRKY40, PAD4, TN3, PR1, and PR2, were examined by RT-qPCR. Data represent mean ± Sd of 3 independent biological replicates. Lowercase letters in B), D), and E) indicate statistically significant differences between mean values (P < 0.05, 1-way ANOVA with Tukey’s multiple comparison test). Experiments in A) to E) were repeated thrice with similar results.
Figure 4.
Figure 4.
The ECT1 interacts with SA-m6A-mRNAs in cytosolic condensates. A) Enrichment procedure of SA-induced condensates, including PBs and SGs, and subsequent isolation using FAPS. Arabidopsis WT, ect1, and transgenic lines expressing ECT1-GFP (ECT1#13), muECT1-GFP (muECT1#20), or ECT1ΔPrLD-GFP (ECT1ΔPrLD#11) in the ect1 mutant background and GFP (GFP) or UBP1B-RFP (UBP1B-RFP) in the WT background were treated with 1 mM SA for 40 min to induce the cytosolic condensates. After isolating CF from cell lysates through 4 sequential centrifugation steps, the CF fractions were further purified to obtain EEF by FAPS. B) The accumulation of ECT1-GFP, muECT1-GFP, ECT1ΔPrLD-GFP, and the SG marker protein UBP1B-RFP in CF from indicated genotypes was analyzed by immunoblot analyses using anti-GFP and anti-RFP antibodies. Antibodies against nuclear histone H3 and cytosolic UGPase were used to examine the purity of the foci fractions. C) RT-qPCR results represent the relative abundance of SA-m6A-mRNAs (WRKY33, WRKY40, PAD4, TN3, SAG21, and MC2) and m6A-prone non-SARGs (TTG1, ITB1, and DIS2) in the CF of indicated genotypes. PP2AA3 was used as a negative control. The enrichment value was normalized to the input, representing means ± Sd of 3 independent biological replicates. D) Condensates labeled with ECT1-GFP-, muECT1-GFP-, or ECT1ΔPrLD-GFP were separated from the CF by FAPS system based on their size and fluorescence. The area indicated by the closed line shows the sorting window of ECT1-GFP (or muECT1-GFP or ECT1ΔPrLD-GFP)-labeled particles. The CF from transgenic plants expressing GFP alone was used for a negative control lacking the SA-induced condensates. FSC-A, forward scatter area. E) The relative abundances of mRNAs of SARGs in the sorted foci fractions (EEF) indicated in Supplemental Fig. S11 were examined by RT-qPCR. The enrichment value was normalized to the input, presenting as means ± Sd of 3 independent biological replicates. U, undetected. Lowercase letters in C) and E) indicate statistically significant differences between mean values (P < 0.05, 1-way ANOVA with Tukey’s multiple comparisons test). Experiments in B) to E) were repeated twice with similar results.
Figure 5.
Figure 5.
The m6A-binding capacity and cytosolic condensation of ECT1 are critical for the decay of SA-m6A-mRNAs. A) Experimental design for mRNA decay analysis. Ten-d-old Arabidopsis seedlings of WT, ect1, and ect1 expressing ECT1-GFP (ECT1#13), muECT1-GFP (muECT1#20), or ECT1ΔPrLD-GFP (ECT1ΔPrLD#11) grown on MS medium under CL were sprayed with a 0.5 mM SA solution. After a 6 h incubation, seedlings were treated with 1 mM cordycepin to inhibit transcription and then collected at the indicated time points to isolate total RNAs. B) Decay rate of a subset of SA-m6A-mRNAs and m6A-prone non-SARGs. The relative RNA abundance of each gene was examined by RT-qPCR. PP2AA3 was used for a negative control known to be stable. Data represent means ± Sd of 3 independent biological replicates. The horizontal dashed lines represent 50% reduction of the indicated mRNA levels after cordycepin treatment. Asterisks indicate significant differences by Student's t test (**P < 0.01; *P < 0.05) compared with WT at each time point. C and D) The interaction of ECT1, muECT1, or ECT1ΔPrLD with mRNA decay factors was examined by BiFC (C) and Co-IP (D) assays using N. benthamiana leaves transiently coexpressed with indicated proteins. After 3 d post-Agrobacterium infiltration, plant samples were treated with 1 mM SA for 40 min. Co-IP was conducted using Myc-Trap beads, and the interaction was evaluated by using a GFP antibody. NPR1, which was found to have no interaction with ECT1 (Supplemental Fig. S6), was used for negative controls for BiFC and Co-IP assays. Scale bars in C): 20 µm. Experiments in B) to D) were performed at least twice with similar results.
Figure 6.
Figure 6.
ECT1 condensates negatively regulate plant immunity. A) Subcellular localization of ECT1-GFP in 4-wk-old Arabidopsis stable transgenic plants after 1 d post infiltration with P. syringae pv tomato (Pst) DC3000 (scale bars: 10 µm). B and C) Four-wk-old Arabidopsis plants of WT, ect1, and transgenic ect1 overexpressing ECT1-GFP (ECT1#13), muECT1-GFP (muECT1#20), and ECT1ΔPrLD-GFP (ECT1ΔPrLD#11) were infiltrated with Pst DC3000 (105 colony-forming units [CFU]/Ml). Bacterial growth was measured at 2 d post infiltration (B). Data represent means ± Sd of 6 independent biological replicates. Expression levels of selected SARGs were examined at 1 d post infiltration by RT-qPCR (C). ACT2 was used as an internal standard. The data represent means ± Sd of 3 independent biological replicates. Lowercase letters in B) and C) indicate statistically significant differences between mean values (P < 0.05, 1-way ANOVA with Tukey’s multiple comparisons test). Results in A) to C) were reproduced in at least 2 independent experiments. SD, short-day. D) Proposed model of how ECT1 condensates counterbalance SA-related plant stress responses. Under SA-increasing stress conditions, ECT1 binds SA-m6A-mRNAs through its aromatic cage, sequestering them into cytosolic condensates. The subsequent mRNA decay pathway and/or mRNA storage in ECT1-associated condensates may decelerate the translation of those SARGs, thereby limiting SA-induced stress responses. RBP, RNA-binding proteins.

References

    1. Aizer A, Kalo A, Kafri P, Shraga A, Ben-Yishay R, Jacob A, Kinor N, Shav-Tal Y. Quantifying mRNA targeting to P-bodies in living human cells reveals their dual role in mRNA decay and storage. J Cell Sci. 2014:127(Pt 20):4443–4456. 10.1242/jcs.152975 - DOI - PubMed
    1. Anderson P, Kedersha N. RNA granules: post-transcriptional and epigenetic modulators of gene expression. Nat Rev Mol Cell Biol. 2009:10(6):430–436. 10.1038/nrm2694 - DOI - PubMed
    1. Arribas-Hernandez L, Bressendorff S, Hansen MH, Poulsen C, Erdmann S, Brodersen P. An m(6)A-YTH module controls developmental timing and morphogenesis in Arabidopsis. Plant Cell. 2018:30(5):952–967. 10.1105/tpc.17.00833 - DOI - PMC - PubMed
    1. Arribas-Hernandez L, Rennie S, Koster T, Porcelli C, Lewinski M, Staiger D, Andersson R, Brodersen P. Principles of mRNA targeting via the Arabidopsis m(6)A-binding protein ECT2. eLife 2021b:10:e72375. 10.7554/eLife.72375 - DOI - PMC - PubMed
    1. Arribas-Hernandez L, Rennie S, Schon M, Porcelli C, Enugutti B, Andersson R, Nodine MD, Brodersen P. The YTHDF proteins ECT2 and ECT3 bind largely overlapping target sets and influence target mRNA abundance, not alternative polyadenylation. eLife 2021a:10:e72377. 10.7554/eLife.72377 - DOI - PMC - PubMed

MeSH terms

LinkOut - more resources