. 2023 Dec 2;14(1):7961.
doi: 10.1038/s41467-023-43420-x.

Interaction dynamics between innate and adaptive immune cells responding to SARS-CoV-2 vaccination in non-human primates

Affiliations

Interaction dynamics between innate and adaptive immune cells responding to SARS-CoV-2 vaccination in non-human primates

Chaim A Schramm et al. Nat Commun. .

Abstract

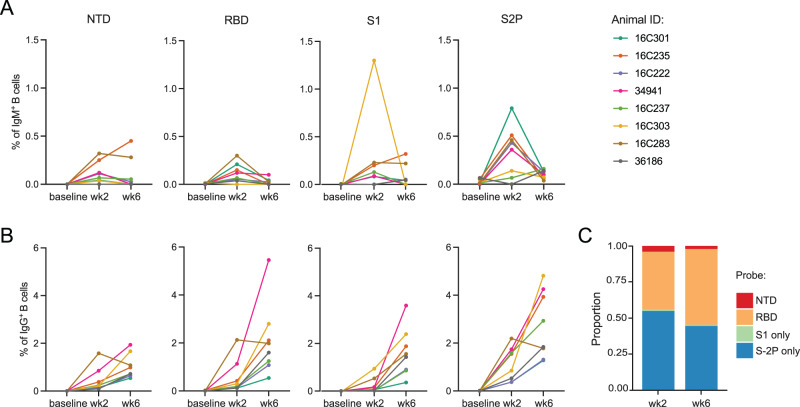
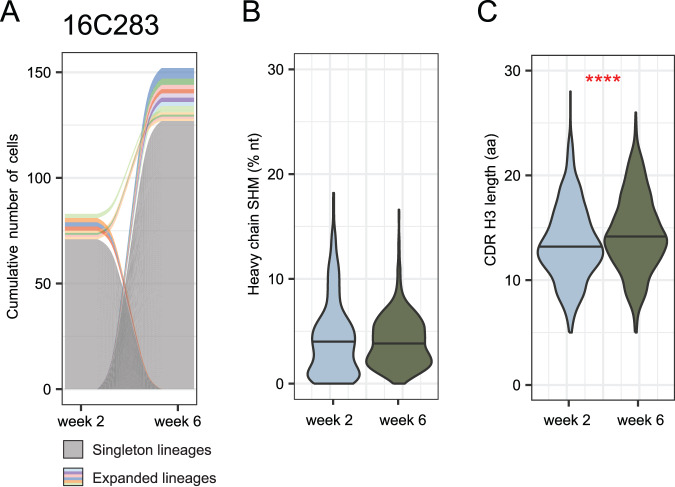
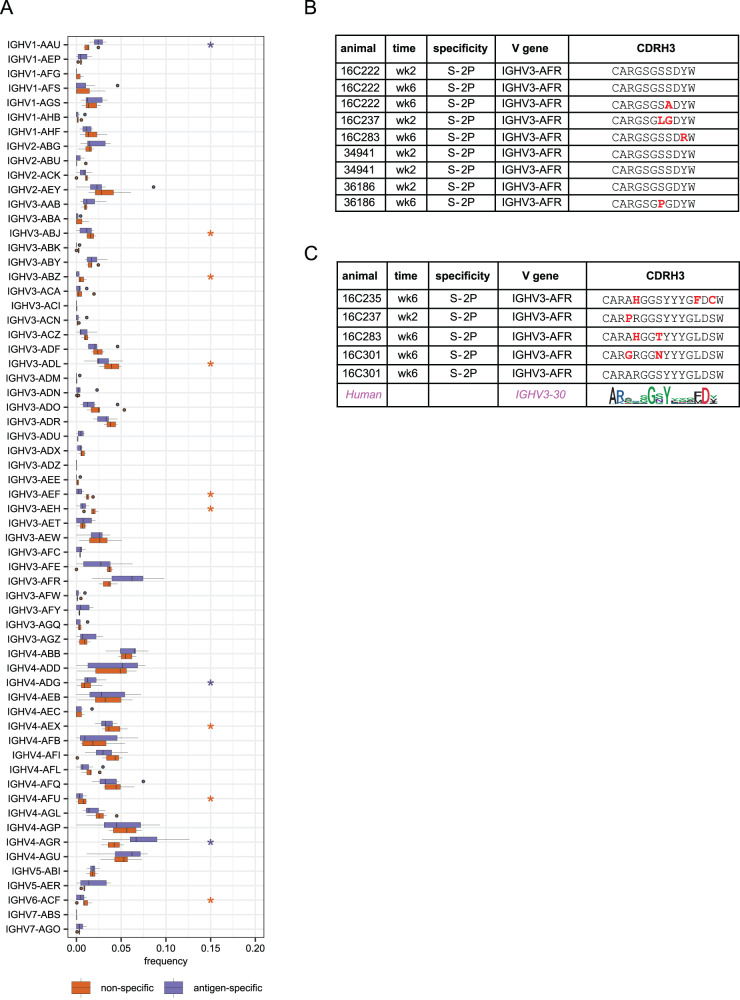
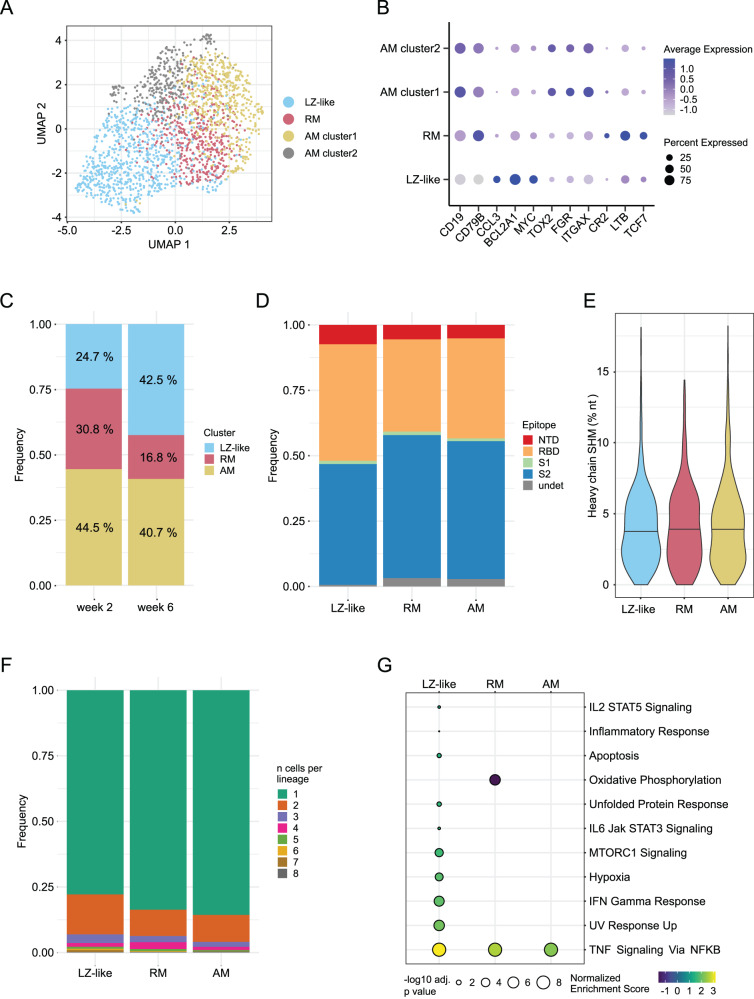
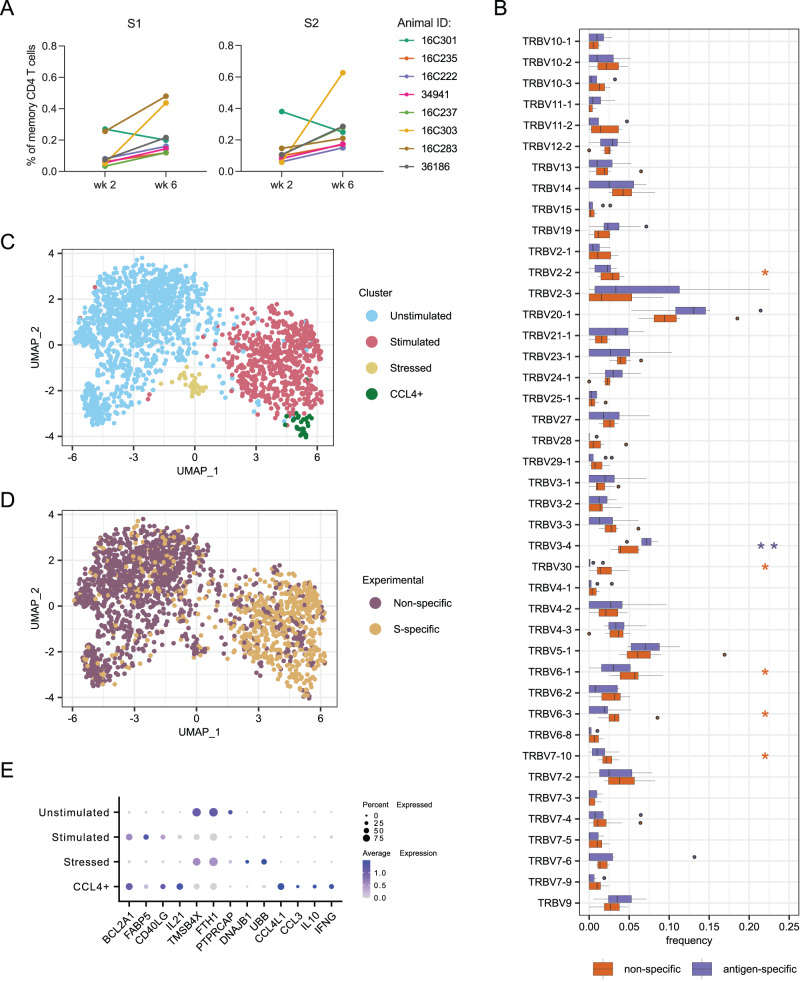
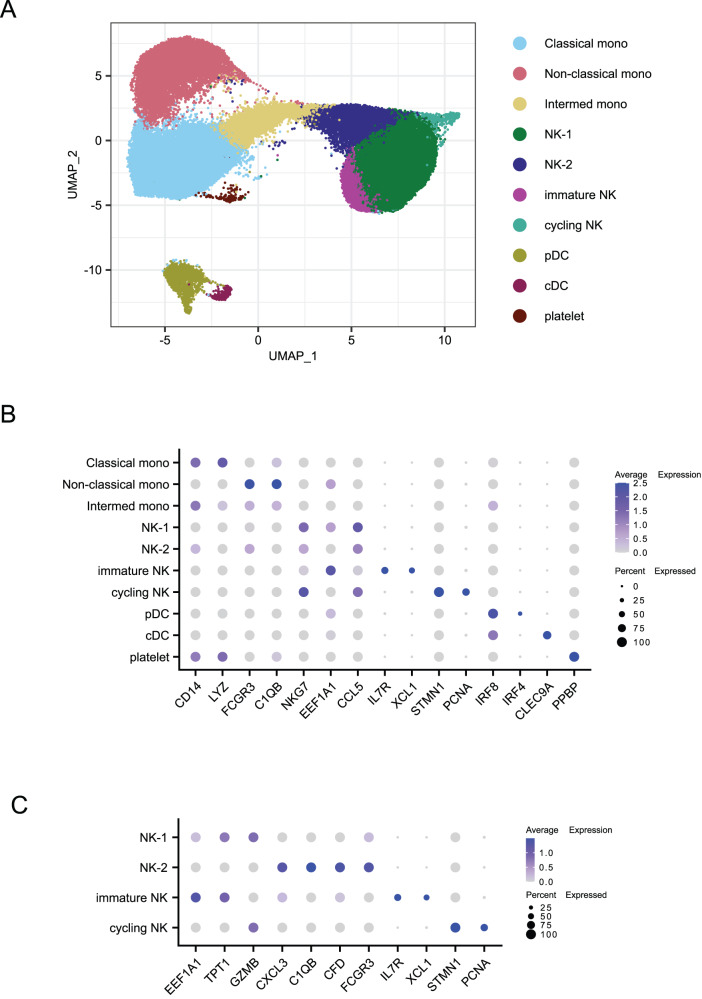
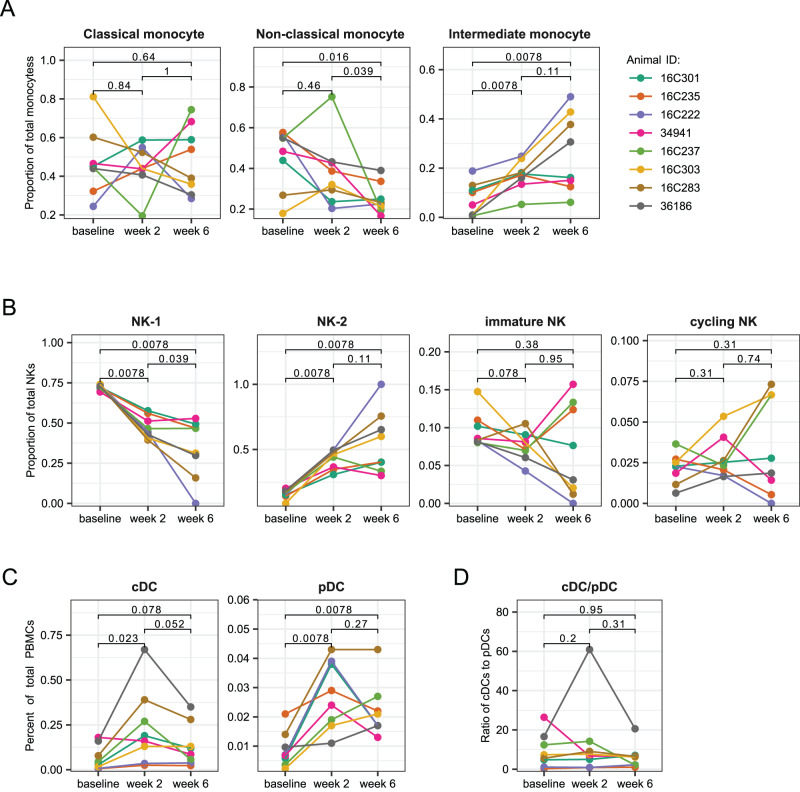
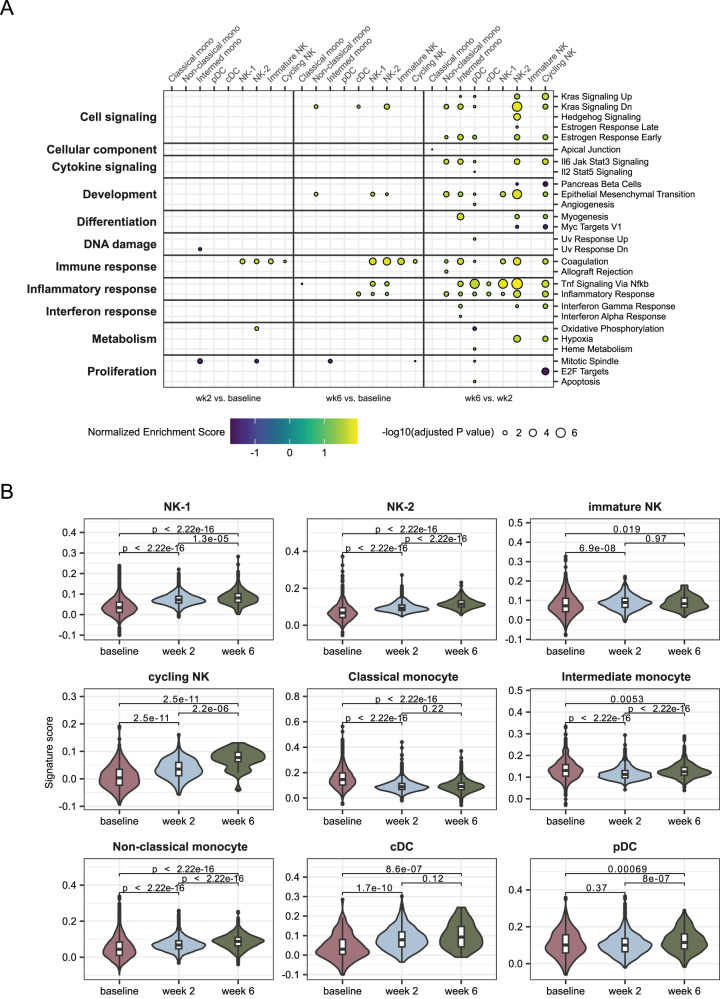
As SARS-CoV-2 variants continue evolving, testing updated vaccines in non-human primates remains important for guiding human clinical practice. To date, such studies have focused on antibody titers and antigen-specific B and T cell frequencies. Here, we extend our understanding by integrating innate and adaptive immune responses to mRNA-1273 vaccination in rhesus macaques. We sorted innate immune cells from a pre-vaccine time point, as well as innate immune cells and antigen-specific peripheral B and T cells two weeks after each of two vaccine doses and used single-cell sequencing to assess the transcriptomes and adaptive immune receptors of each cell. We show that a subset of S-specific T cells expresses cytokines critical for activating innate responses, with a concomitant increase in CCR5-expressing intermediate monocytes and a shift of natural killer cells to a more cytotoxic phenotype. The second vaccine dose, administered 4 weeks after the first, elicits an increase in circulating germinal center-like B cells 2 weeks later, which are more clonally expanded and enriched for epitopes in the receptor binding domain. Both doses stimulate inflammatory response genes associated with elevated antibody production. Overall, we provide a comprehensive picture of bidirectional signaling between innate and adaptive components of the immune system and suggest potential mechanisms for the enhanced response to secondary exposure.


Conflict of interest statement

A.C. and D.K.E. are employees of and shareholders in Moderna, Inc. The remaining authors declare no competing interests.

Figures

Fig. 1
Fig. 1. Frequency dynamics of antigen-specific B cells on vaccinated animals.
A Frequencies of memory IgM (IgD-IgM+) B cells and B IgG B cells binding to SARS-CoV-2 probes (NTD, RBD, S1 or S2P) from eight animals. C Proportion of antigen-specific B cells binding to each probe (cells from eight animals combined). Source data are provided as a Source Data file.
Fig. 2
Fig. 2. Antigen-specific B cell repertoire of vaccinated animals.
A Representative alluvial plot from B cell clonal dynamics from one animal. Gray lines represent singleton B cells and colored lines represent expanded lineages. Lines that start or end at zero, including all singletons, indicate B cell lineages that were observed in only a single time point. Colored lines that span the graph represent lineages found at both time points. The thickness of each line at either side of the panel is proportional to the number of cells in that lineage at the corresponding time point, with the cumulative number of cells in all lineages indicated on the y-axis. N = 83 cells from week 2 and 152 cells from week 6. Similar plots for other animals may be found in Fig. S2. B Heavy chain somatic hypermutation (SHM) of all antigen-specific memory B cells from eight animals. N = 696 cells at week 2 and 1393 cells at week 6. Distributions were compared using 2-sided unpaired Wilcoxon test. Distributions for individual animals may be found in Fig. S3a. Distributions considering only one cell per lineage may be found in Figs S3b and S3c. C CDR H3 length in amino acids (aa) of antigen-specific memory B cells from 8 animals. Because CDR H3 length is essentially invariant within a lineage, only one cell per lineage was included. N = 641 lineages at week 2 and 1238 lineages at week 6. Distributions were compared using a 2-sided unpaired Wilcoxon test, P = 1.2E-7. Distributions for individual animals may be found in Fig. S4a. Distributions considering all cells may be found in Figs. S4b and S4c. Source data are provided as a Source Data file.
Fig. 3
Fig. 3. V gene usage and public clones.
A Comparison of VH gene usage between all naïve B cells (orange) and antigen-specific memory B cells (purple) from seven animals (animal 16C237 was excluded due to lack of naive repertoire data). Boxes show the interquartile range, with the median marked as heavy horizontal band. Whiskers represent the highest (lowest) datapoint within 1.5 times the interquartile range of the 75th (25th) percentile. N = 1706 antigen-specific lineages and 29,161 sorted naive B cells. Genes with statistically significant differences by a 2-sided paired Wilcoxon test are indicated with asterisks in the color of the up-regulated group. P = 0.016 for IGHV1-AAU, IGHV3-AEF, IGHV4-AFU, IGHV4-AGR, and IGHV5-AER. P = 0.031 for IGHV3-ABZ, IGHV3-AEH, and IGHV4-ADG. P = 0.047 for IGHV3-ABJ, IGHV3-ADL, and IGHV4-AEX. B A public B cell clone using IGHV3-AFR that was found in five of eight vaccinated animals. Residues that differ from the consensus are highlighted in red. Two identical rows indicate two cells with the same amino acid CDR H3 found in a single animal and time point. C A second public clone was found in four animals. The consensus of a corresponding human public clone is shown as a logo plot. Conserved positions in the human public clone, which are hypothesized to be functionally important, are also conserved in the rhesus public clone. Source data are provided as a Source Data file.
Fig. 4
Fig. 4. B cell transcriptomics reveal a subset of highly activated cells that recently exited germinal centers.
A UMAP plot showing clusters based on gene expression from antigen-specific B cells. The clusters correspond to Light zone (LZ)-like cells, resting memory (RM) cells, and two activated memory (AM) clusters as shown in (B). B Differentially expressed genes that define the phenotype of each cluster identified in (A). Both AM clusters have identical functional markers and were combined for downstream analysis. C Frequencies of each cluster identified in (A) at each time point. D Epitope targeting as delineated by flow cytometry for each phenotypic cluster. E Heavy chain somatic hypermutation (SHM) for each cluster; no significant differences were found using a one-way ANOVA test. F Clonal expansion frequency for each cluster. G Gene set enrichment analysis comparing week 6 to week 2 for each cluster, using the Hallmark gene sets from MSigDB (34). A Kolmogorov-Smrinov test with the Benjamini–Hochberg correction for multiple testing was used to identify pathways with significant changes. Only pathways with at least one significant result are shown. A total of 2034 antigen-specific B cells sorted from 8 animals at weeks 2 and 6 were analyzed. Source data are provided as a Source Data file.
Fig. 5
Fig. 5. T cell responses induced by vaccination.
A Frequencies of activated memory CD4 T cells after stimulation with peptide pools from S1 and S2 domains of SARS-CoV-2 spike. B Comparison of TRBV gene usage between non-specific and S-specific memory CD4 T cells sorted. Boxes show the interquartile range, with the median marked as heavy horizontal band. Whisker represent the highest (lowest) datapoint within 1.5 times the interquartile range of the 75th (25th) percentile. Genes with statistically significant difference by a 2-sided paired Wilcoxon test are indicated with asterisks in the color of the up-regulated group. P = 0.0391, 0.0078, 0.0225, 0.0391, 0.0391, and 0.0391 for TRBV2-2, TRBV3-4, TRBV30, TRBV6-1, TRBV6-3, and TRBV7-10, respectively. C UMAP plot identifying four phenotypic clusters based on gene expression. D UMAP plot colored by experimental conditions identifying S-specific and non-specific T cell by sort. These correspond closely to the phenotypic clusters defined in (C). E Differentially expressed genes that define the phenotype of each cluster identified in (C). A total of 664 S-specific and 1259 non-specific T cells sorted from 8 animals at weeks 2 and 6 were analyzed for all panels. Source data are provided as a Source Data file.
Fig. 6
Fig. 6. Identification of innate immune cell subtypes.
A UMAP plot showing innate cell types based on clustering by gene expression. Mono monocytes, NK natural killer, pDC plasmacytoid dendritic cell, cDC classical dendritic cells. B Differentially expressed genes which define the clusters identified in (A). C Differentially expressed genes that define specific NK cell subsets. A total of 61,051 cells were analyzed.
Fig. 7
Fig. 7. Frequencies of cell types identified by gene signatures.
A Frequencies of monocyte subsets among all monocytes from sequencing data. B Frequencies of natural killer (NK) cell subsets among all NK cells from sequencing data. C Frequencies of dendritic cell (DC) subsets in total PBMC from flow cytometry data. D Ratio of classical DC (cDC) frequency to plasmacytoid DC (pDC) frequency. A total of 30,671 cells from the baseline, 23,073 cells from week 2, and 7307 cells from week 6 were analyzed. P values were obtained using a 2-sided paired Wilcoxon test with Holm correction for multiple testing. Source data are provided as a Source Data file.
Fig. 8
Fig. 8. Upregulation of inflammatory pathways after second dose.
A Gene set enrichment analysis using Hallmark pathways from MSigDB (34). A Kolmogorov-Smrinov test with the Benjamini-Hochberg correction for multiple testing was used to identify pathways with significant changes. Only pathways with at least one significant result are shown. Left panel, week 2 compared to baseline. Middle panel, week 6 compared to baseline. Right panel, week 6 compared to week 2. Within each panel, each column represents one of the transcriptional clusters identified in Fig. 6a. GSEA of sorted innate cells compared between different time points. B Signature score indicating the expression levels of 50 genes identified as being predictive of the magnitude of antibody responses to vaccines (21). Signature scores were calculated using the ModuleScore function in Seurat. Boxes show the interquartile range, with the median marked as heavy horizontal band. Whisker represents the highest (lowest) datapoint within 1.5 times the interquartile range of the 75th (25th) percentile. A total of 30,671 cells from the baseline, 23,073 cells from week 2, and 7307 cells from week 6 were analyzed. P values were obtained using a two-sided unpaired Wilcoxon test with Holm correction for multiple testing. Mono monocyte, NK natural killer, pDC plasmacytoid dendritic cell, cDC classical dendritic cell. Source data are provided as a Source Data file.

References

    1. World Health Organization. WHO Director-General’s opening remarks at the media briefing on COVID-19. https://www.who.int/director-general/speeches/detail/who-director-genera... (2020).
    1. Jackson, L. A. et al. An mRNA Vaccine against SARS-CoV-2 - preliminary report. N. Engl. J. Med. 10.1056/NEJMoa2022483 (2020). - PMC - PubMed
    1. Baden LR, et al. Efficacy and safety of the mRNA-1273 SARS-CoV-2 vaccine. N. Engl. J. Med. 2021;384:403–416. doi: 10.1056/NEJMoa2035389. - DOI - PMC - PubMed
    1. VIPER Group COVID-19 Vaccine Tracker Team. Moderna: Spikevax. https://covid19.trackvaccines.org/vaccines/22/.
    1. Messaoudi I, Estep R, Robinson B, Wong SW. Nonhuman primate models of human immunology. Antioxid. Redox Signal. 2011;14:261–273. doi: 10.1089/ars.2010.3241. - DOI - PMC - PubMed

Publication types

Supplementary concepts

Associated data