. 2023 Dec 2;14(1):7971.
doi: 10.1038/s41467-023-42780-8.

Enhanced TARP-γ8-PSD-95 coupling in excitatory neurons contributes to the rapid antidepressant-like action of ketamine in male mice

Affiliations

Enhanced TARP-γ8-PSD-95 coupling in excitatory neurons contributes to the rapid antidepressant-like action of ketamine in male mice

Shi-Ge Xue et al. Nat Commun. .

Abstract

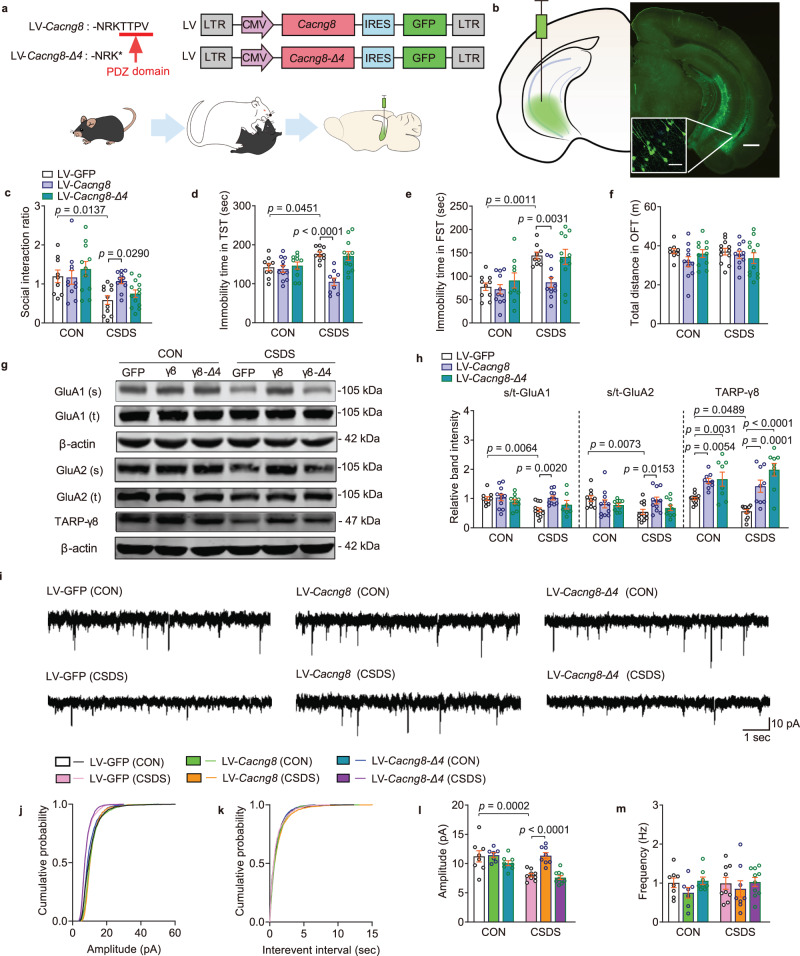
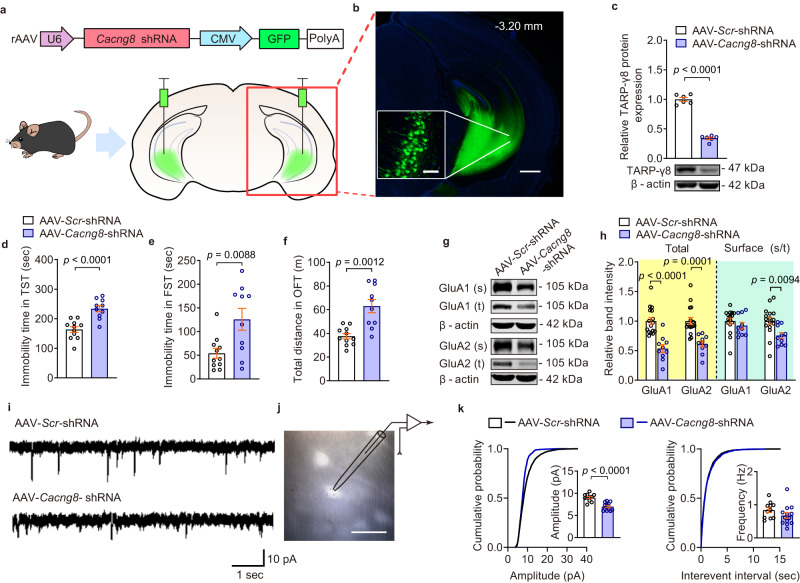
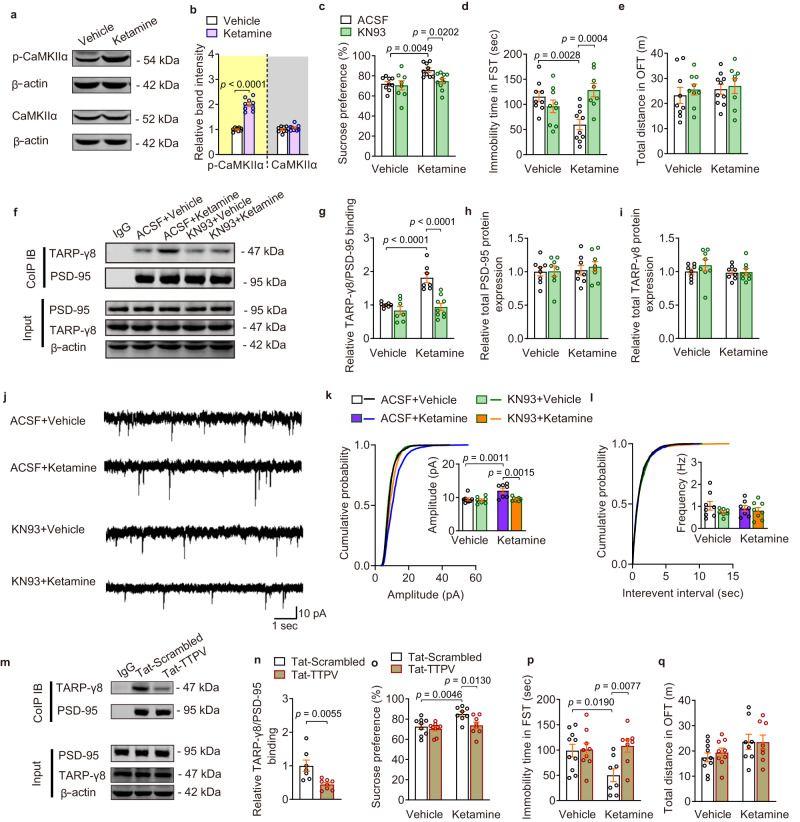
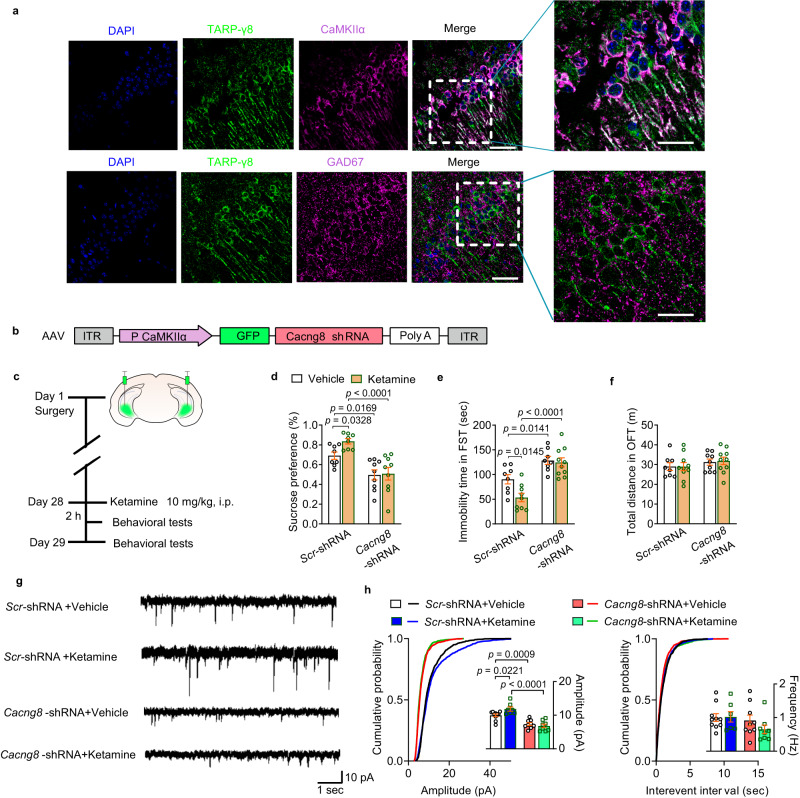
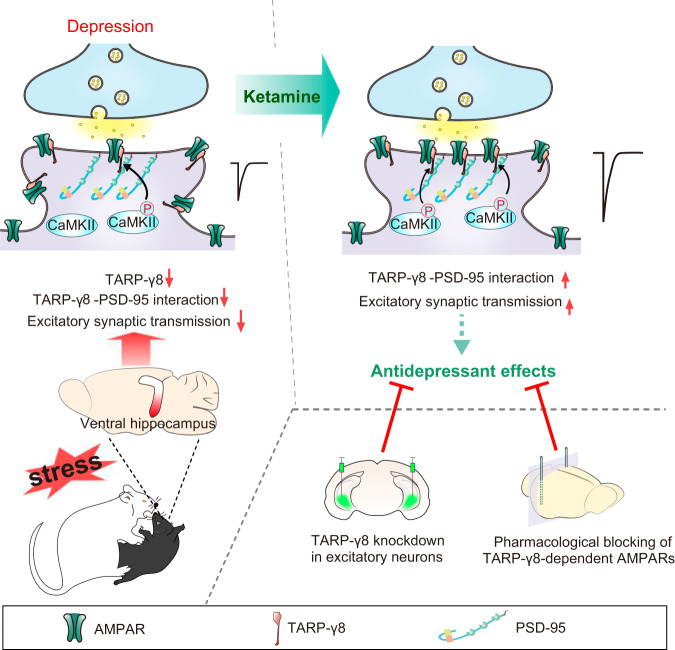
Ketamine produces rapid antidepressant effects at sub-anesthetic dosage through early and sustained activation of α-amino-3-hydroxy-5-methyl-4-isoxazolepropionic acid receptors (AMPARs), however, the exact molecular mechanism still remains unclear. Transmembrane AMPAR regulatory protein-γ8 (TARP-γ8) is identified as one of AMPAR auxiliary subunits, which controls assemblies, surface trafficking and gating of AMPARs. Here, we show that ketamine rescues both depressive-like behaviors and the decreased AMPARs-mediated neurotransmission by recruitment of TARP-γ8 at the postsynaptic sites in the ventral hippocampus of stressed male mice. Furthermore, the rapid antidepressant effects of ketamine are abolished by selective blockade of TARP-γ8-containing AMPAR or uncoupling of TARP-γ8 from PSD-95. Overexpression of TARP-γ8 reverses chronic stress-induced depressive-like behaviors and attenuation of AMPARs-mediated neurotransmission. Conversely, knockdown of TARP-γ8 in excitatory neurons prevents the rapid antidepressant effects of ketamine.


Conflict of interest statement

The authors declare no competing interests.

Figures

Fig. 1
Fig. 1. Ketamine drives recruitment of TARP-γ8 at the postsynaptic sites in chronic stress model.
a Social interaction ratio of SIT (n = 10, 10, 11, and 10 in CON-Vehicle, CON-Ketamine, CSDS-Vehicle and CSDS-Ketamine, respectively). b Time in the interaction zone of SIT (n = 10, 10, 12, and 10 in CON-Vehicle, CON-Ketamine, CSDS-Vehicle and CSDS-Ketamine, respectively). c Preference for sucrose in the SPT (n = 9, 9, 10, and 10 in CON-Vehicle, CON-Ketamine, CSDS-Vehicle and CSDS-Ketamine, respectively). d, e Immobility time in the FST (d) and total distance in the OFT (e) (n = 10, 10, 12, and 12 in CON-Vehicle, CON-Ketamine, CSDS-Vehicle and CSDS-Ketamine, respectively). f Representative traces of AMPARs-mediated mEPSC recordings in ventral hippocampal CA1 neurons. g Quantification of cumulative probability and amplitude and frequency of mEPSCs (n = 9 cells from 4 mice in CON-Vehicle, n = 8 cells from 3 mice in CON-Ketamine, n = 9 cells from 3 mice in CSDS-Vehicle, n = 8 cells from 4 mice in CSDS-Ketamine, respectively). h Representative western blot image of Co-IP assay. i Quantification of association between PSD-95 and TARP-γ8 in cultured primary hippocampal neurons (n = 7, 8, and 7 in 0, 1 h and 24 h, respectively). j, k Quantification of total expression of PSD-95 (j) and TARP-γ8 (k) in cultured primary hippocampal neurons (n = 7, 8, and 8 in 0, 1 h, and 24 h, respectively). l Representative western blot image of Co-IP assay. m Quantification of association between PSD-95 and TARP-γ8 in the ventral hippocampus (n = 8, 7, 7, and 7 in CON-Vehicle, CON-Ketamine, CSDS-Vehicle and CSDS-Ketamine, respectively). n, o Quantification of total expression of PSD-95 (n) and TARP-γ8 (o) in the ventral hippocampus (n = 8 per group). Comparisons were performed by two-way ANOVA analysis followed by Bonferroni’s multiple comparisons test in (a–g, mo) and one-way ANOVA analysis followed by Dunnett’s multiple comparisons test in ik. Data are presented as mean ± SEM. All numbers (n) are biologically independent experiments. Source data are provided as a Source Data file.
Fig. 2
Fig. 2. Inhibition of TARP-γ8-selective AMPARs abolishes the acute effects of ketamine in the ventral hippocampus.
a Structures of the mechanism of JNJ55511118. b Preference for sucrose in the SPT (n = 11, 10, and 12 in Vehicle, 1 μM and 10 μM, respectively).c Immobility time in the FST (n = 15, 15, and 19 in Vehicle, 1 μM, and 10 μM, respectively). d Total distance in the OFT (n = 12, 13, and 14 in Vehicle, 1 μM, and 10 μM, respectively). e, f Schematic diagram of experiment (e) and histological verification of the cannula placement in the ventral hippocampus with Nissl staining (f). Scale bar = 500 μm. g Social interaction ratio of SIT (n = 9, 9, 9, 9, 10, 10, 10, and 8 in CON-ACSF-Vehicle, CON-ACSF-Ketamine, CON-JNJ55511118-Vehicle, CON-JNJ55511118-Ketamine, CSDS-ACSF-Vehicle, CSDS-ACSF-Ketamine, CSDS-JNJ55511118-Vehicle and CSDS-JNJ55511118-Ketamine, respectively). h Preference for sucrose in the SPT (n = 10 mice per group). i Immobility time in the FST (n = 10, 10, 10, 10, 8, 8, 10 and 10 in CON-ACSF-Vehicle, CON-ACSF-Ketamine, CON-JNJ55511118-Vehicle, CON-JNJ55511118-Ketamine, CSDS-ACSF-Vehicle, CSDS-ACSF-Ketamine, CSDS-JNJ55511118-Vehicle and CSDS-JNJ55511118-Ketamine, respectively). j Total distance traveled in the OFT (n = 10, 10, 10, 10, 10, 10, 10 and 9 in CON-ACSF-Vehicle, CON-ACSF-Ketamine, CON-JNJ55511118-Vehicle, CON-JNJ55511118-Ketamine, CSDS-ACSF-Vehicle, CSDS-ACSF-Ketamine, CSDS-JNJ55511118-Vehicle and CSDS-JNJ55511118-Ketamine, respectively). k Representative traces of AMPARs-mediated mEPSC recordings in ventral hippocampal CA1 neurons. l, m Quantification of cumulative probability and amplitude (l) and frequency (m) of mEPSCs (n = 8 cells from 4 mice in ACSF, n = 8 cells from 4 mice in Ketamine, n = 11 cells from 5 mice in JNJ55511118, n = 8 cells from four mice in JNJ55511118-Ketamine). Comparisons were performed by one-way ANOVA analysis followed by Dunnett’s multiple comparisons test in bd, by two-way and one-way ANOVA analysis followed by Bonferroni’s multiple comparisons test in (gj) and in (l, m), respectively. Data are presented as mean ± SEM. All numbers (n) are biologically independent experiments. Source data are provided as a Source Data file.
Fig. 3
Fig. 3. Overexpression of TARP-γ8 but not TARP-γ8-Δ4 in the ventral hippocampus prevents CSDS-induced synaptic and behavioral impairment.
a Schematic representation of LV-mediated TARP-γ8 or TARP-γ8-Δ4 overexpression and a schematic diagram of the experimental process. b Targeted locations and confocal images of GFP (green) expression in the ventral hippocampus. Scale bar = 50 μm (left), 500 μm (right). Experiments were repeated independently 3 times with similar results. c Social interaction ratio of SIT (n = 9, 11, 11, 11, 11, and 13 in CON-LV-GFP, CSDS-LV-GFP, CON-LV-Cacng8, CSDS-LV-Cacng8, CON-LV-Cacng8-Δ4 and CSDS-LV-Cacng8-Δ4, respectively). d Immobility time in the TST (n = 9, 10, 11, 9, 10, and 12 in CON-LV-GFP, CSDS-LV-GFP, CON-LV-Cacng8, CSDS-LV-Cacng8, CON-LV-Cacng8-Δ4 and CSDS-LV-Cacng8-Δ4, respectively). e Immobility time in the FST (n = 10, 9, 11, 11, 9, and 11 in CON-LV-GFP, CSDS-LV-GFP, CON-LV-Cacng8, CSDS-LV-Cacng8, CON-LV-Cacng8-Δ4 and CSDS-LV-Cacng8-Δ4, respectively). f Total distance in the OFT (n = 9, 12, 11, 11, 11, and 12 in CON-LV-GFP, CSDS-LV-GFP, CON-LV-Cacng8, CSDS-LV-Cacng8, CON-LV-Cacng8-Δ4 and CSDS-LV-Cacng8-Δ4, respectively). g The representative image of the western blot. h Quantification of protein expression of surface GluA1 (n = 10, 12, 11, 11, 10, and 7 in CON-LV-GFP, CSDS-LV-GFP, CON-LV-Cacng8, CSDS-LV-Cacng8, CON-LV-Cacng8-Δ4 and CSDS-LV-Cacng8-Δ4, respectively), surface GluA2 (n = 10, 12, 11, 11, 10, and 10 in CON-LV-GFP, CSDS-LV-GFP, CON-LV-Cacng8, CSDS-LV-Cacng8, CON-LV-Cacng8-Δ4 and CSDS-LV-Cacng8-Δ4, respectively) and TARP-γ8 (n = 14, 12, 9, 9, 8, and 9 in CON-LV-GFP, CSDS-LV-GFP, CON-LV-Cacng8, CSDS-LV-Cacng8, CON-LV-Cacng8-Δ4 and CSDS-LV-Cacng8-Δ4, respectively). i Representative traces of AMPARs-mediated mEPSC recordings from different groups. jm Quantification of cumulative probability (j, k) and amplitude (l) and frequency (m) of mEPSCs (n = 8 cells from 5 mice in CON-LV-GFP, n = 9 cells from 6 mice in CSDS-LV-GFP, n = 7 cells from 6 mice in CON-LV-Cacng8, n = 8 cells from 5 mice in CSDS-LV-Cacng8, n = 8 cells from 6 mice in CON-LV-Cacng8-Δ4 and n = 10 cells from 6 mice in CSDS-LV-Cacng8-Δ4). Comparisons were performed by two-way ANOVA analysis followed by Bonferroni’s multiple comparisons test. s/t stands for surface/total in h. Data are presented as mean ± SEM. All numbers (n) are biologically independent experiments. Source data are provided as a Source Data file.
Fig. 4
Fig. 4. Knockdown of TARP-γ8 in the ventral hippocampus induces depressive-like phenotypes in mice.
a AAV-expressing constructs encoding GFP and shRNAs targeting TARP-γ8 and region-specific expression of GFP in the ventral hippocampus of mice. b Targeted locations and confocal images of AAV-mediated GFP (green) expression in the ventral hippocampus. Scale bar = 100 μm (inside), 500 μm (outside). Experiments were repeated independently three times with similar results. c Quantification of TARP-γ8 protein expression (n = 6 mice per group). d, e Immobility time in the TST (d) and FST (e) (n = 11 mice in AAV-Scr-shRNA, n = 10 mice in AAV-Cacng8-shRNA). f Total distance traveled in the OFT (n = 11 mice in AAV-Scr-shRNA, n = 10 mice in AAV-Cacng8-shRNA). g The representative image of western blot. h The quantification of total and surface protein expression of GluA1 and GluA2 (n = 16 mice in AAV-Scr-shRNA, n = 10 mice in AAV-Cacng8-shRNA). i Representative traces of AMPARs-mediated mEPSC recordings from different groups. j Whole-cell patch-clamp was used to record AMPARs-mediated mEPSC of CA1 neurons in the ventral hippocampus with GFP (bright) expression. Scale bar = 50 μm. k Quantification of cumulative probability and amplitude and frequency of mEPSCs (n = 11 cells from four mice in AAV-Scr-shRNA, n = 13 cells from 6 mice in AAV-Cacng8-shRNA). Comparisons were performed by unpaired, two-tailed t test. Data are presented as mean ± SEM. All numbers (n) are biologically independent experiments. Source data are provided as a Source Data file.
Fig. 5
Fig. 5. CaMKIIα-dependent TARP-γ8-PSD-95 coupling is necessary for the rapid antidepressant effects of ketamine.
a The representative image of western blot. b The quantification of protein expression of p-CaMKIIα and CaMKIIα (n = 9 per group). c Preference for sucrose in the SPT (n = 9, 8, 9, and 10 in Vehicle-ACSF, Vehicle-KN93, Ketamine-ACSF, and Ketamine-KN93, respectively). d, e Immobility time in the FST (d) and total distance in the OFT (e) (n = 9, 9, 10, and 8 in Vehicle-ACSF, Vehicle-KN93, Ketamine-ACSF and Ketamine-KN93, respectively). f Representative western blot image of Co-IP assay. g Quantification of association between PSD-95 and TARP-γ8 (n = 8, 7, 7, and 9 in Vehicle-ACSF, Vehicle-KN93, Ketamine-ACSF and Ketamine-KN93, respectively). h, i Total protein expression of PSD-95 (h) and TARP-γ8 (i) (n = 8 samples per group). j Representative traces of AMPARs-mediated mEPSC recordings in ventral hippocampal CA1 neurons from different groups. k, l Quantification of cumulative probability and amplitude (k) and frequency (l) of mEPSCs (n = 8 cells from 4 mice in Vehicle-ACSF, n = 7 cells from four mice in Vehicle-KN93, n = 7 cells from four mice in Ketamine-ACSF and n = 8 cells from 4 mice in Ketamine-KN93). m Representative western blot image of Co-IP assay. n Quantification of the association between PSD-95 and TARP-γ8 (n = 7 in Tat-Scrambled, n = 8 in Tat-TTPV). o Preference for sucrose in the SPT (n = 9, 9, 8 and 8 in Vehicle-Tat-Scrambled, Vehicle-Tat-TTPV, Ketamine-Tat-Scrambled and Ketamine-Tat-TTPV, respectively). p, q Immobility time in the FST (p) and total distance in the OFT (q) (n = 10, 9, 8 and 8 in Vehicle-Tat-Scrambled, Vehicle-Tat-TTPV, Ketamine-Tat-Scrambled and Ketamine-Tat-TTPV, respectively). Comparisons were performed by unpaired, two-tailed t test in (b, n) and two-way ANOVA analysis followed by Bonferroni’s multiple comparisons test in (cl, oq). Data are presented as mean ± SEM. All numbers (n) are biologically independent experiments. Source data are provided as a Source Data file.
Fig. 6
Fig. 6. Knockdown of TARP-γ8 in excitatory neurons in the ventral hippocampus blocks the antidepressant effects of ketamine.
a Immunofluorescence results showing TARP-γ8 (green) was mainly expressed in CaMKIIα (purple)-expressing neurons rather than GAD67 (purple)-expressing neurons. Scale bar = 30 μm (two bars on the left), 50 μm (two bars on the right). DAPI (blue). Experiments were repeated independently 3 times with similar results. b AAV-expressing constructs with CaMKIIα promoter encoding GFP and shRNAs targeting TARP-γ8. c Timeline of experimental procedure. d Preference for sucrose in the SPT (n = 8 samples per group). e Immobility time in the FST (n = 8, 8, 9, and 10 in Vehicle-Scr-shRNA, Vehicle-Cacng8-shRNA, Ketamine-Scr-shRNA and Ketamine-Cacng8-shRNA, respectively). f Total distance in the OFT (n = 8, 9, 10 and 10 in Vehicle-Scr-shRNA, Vehicle-Cacng8-shRNA, Ketamine-Scr-shRNA and Ketamine-Cacng8-shRNA, respectively). g Representative traces of AMPARs-mediated mEPSC recordings from excitatory neurons in the ventral hippocampus. h Quantification of cumulative probability and amplitude and frequency of mEPSCs (n = 10 cells from 4 mice in Vehicle-Scr-shRNA, n = 9 cells from 4 mice in Vehicle-Cacng8-shRNA, n = 7 cells from 4 mice in Ketamine-Scr-shRNA and n = 8 cells from 4 mice in Ketamine-Cacng8-shRNA). Comparisons were performed by two-way ANOVA analysis followed by Bonferroni’s multiple comparisons test. Data are presented as mean ± SEM. All numbers (n) are biologically independent experiments. Source data are provided as a Source Data file.
Fig. 7
Fig. 7. Schematic representation of the suggested model depicting the role of TARP-γ8 in antidepressant effects of ketamine.
Ketamine exhibits antidepressant effects by increasing the postsynaptic recruitment of TARP-γ8 and the enhanced excitatory synaptic transmission mediated by TARP-γ8-selective AMPAR in a CaMKII phosphorylation-dependent manner in the ventral hippocampus. Knockdown of TARP-γ8 in excitatory neurons of the ventral hippocampus or blockage of TARP-γ8-selective AMPAR abolishes the rapid antidepressant effects of ketamine.

References

    1. Zanos P, et al. NMDAR inhibition-independent antidepressant actions of ketamine metabolites. Nature. 2016;533:481–486. doi: 10.1038/nature17998. - DOI - PMC - PubMed
    1. Maeng S, et al. Cellular mechanisms underlying the antidepressant effects of ketamine: role of alpha-amino-3-hydroxy-5-methylisoxazole-4-propionic acid receptors. Biol. Psychiatry. 2008;63:349–352. doi: 10.1016/j.biopsych.2007.05.028. - DOI - PubMed
    1. Zhou W, et al. Ketamine-induced antidepressant effects are associated with AMPA receptors-mediated upregulation of mTOR and BDNF in rat hippocampus and prefrontal cortex. Eur. Psychiatry. 2014;29:419–423. doi: 10.1016/j.eurpsy.2013.10.005. - DOI - PubMed
    1. Gordillo-Salas M, Pascual-Antón R, Ren J, Greer J, Adell A. Antidepressant-like effects of CX717, a positive allosteric modulator of AMPA receptors. Mol. Neurobiol. 2020;57:3498–3507. doi: 10.1007/s12035-020-01954-x. - DOI - PubMed
    1. Kadriu B, et al. Positive AMPA receptor modulation in the treatment of neuropsychiatric disorders: a long and winding road. Drug Discov. Today. 2021;26:1–23. doi: 10.1016/j.drudis.2021.07.027. - DOI - PMC - PubMed

Publication types