. 2023 Dec 2;14(1):7981.
doi: 10.1038/s41467-023-43769-z.

Estimating the potential impact and diagnostic requirements for SARS-CoV-2 test-and-treat programs

Affiliations

Estimating the potential impact and diagnostic requirements for SARS-CoV-2 test-and-treat programs

Alvin X Han et al. Nat Commun. .

Abstract

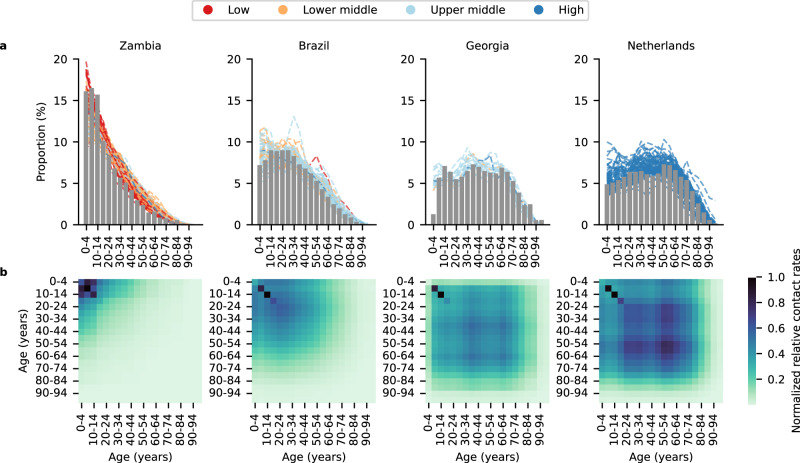
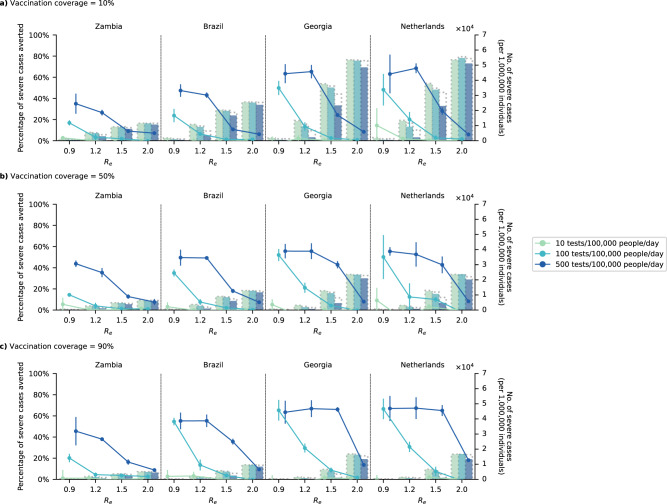
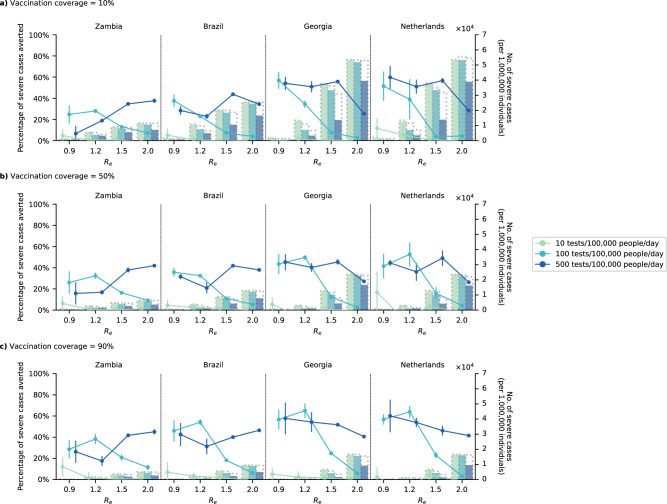
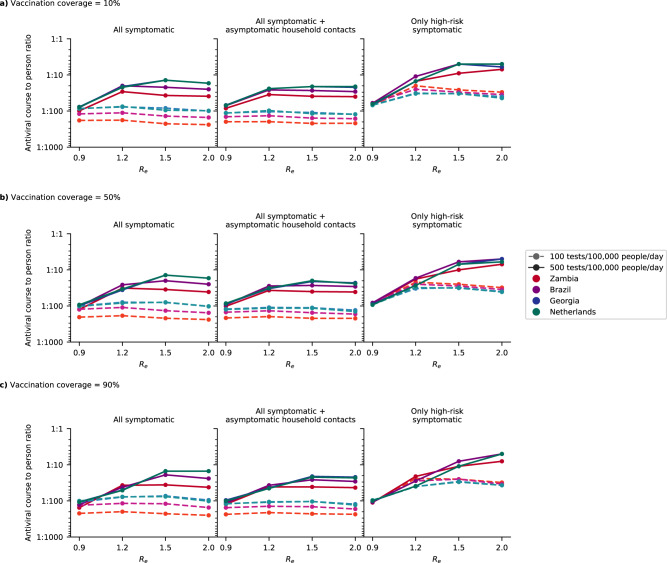
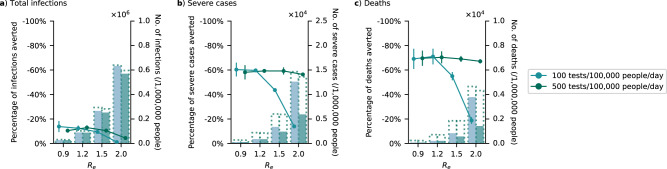
Oral antivirals have the potential to reduce the public health burden of COVID-19. However, now that we have exited the emergency-phase of the COVID-19 pandemic, declining SARS-CoV-2 clinical testing rates (average testing rates = [Formula: see text]10 tests/100,000 people/day in low-and-middle income countries; <100 tests/100,000 people/day in high-income countries; September 2023) make the development of effective test-and-treat programs challenging. We used an agent-based model to investigate how testing rates and strategies affect the use and effectiveness of oral antiviral test-to-treat programs in four country archetypes of different income levels and demographies. We find that in the post-emergency-phase of the pandemic, in countries where low testing rates are driven by limited testing capacity, significant population-level impact of test-and-treat programs can only be achieved by both increasing testing rates and prioritizing individuals with greater risk of severe disease. However, for all countries, significant reductions in severe cases with antivirals are only possible if testing rates were substantially increased with high willingness of people to seek testing. Comparing the potential population-level reductions in severe disease outcomes of test-to-treat programs and vaccination shows that test-and-treat strategies are likely substantially more resource intensive requiring very high levels of testing (≫100 tests/100,000 people/day) and antiviral use suggesting that vaccination should be a higher priority.


Conflict of interest statement

E.H., S.C., B.R., and B.E.N. declare that they are employed by FIND, the global alliance for diagnostics. The remaining authors declare no competing interests.

Figures

Fig. 1
Fig. 1. Demography of simulated countries.
a Bar plot shows the age distribution of each simulated country archetype (low and middle-income countries (LMICs): Brazil, Georgia, Zambia; high-income country: Netherlands) stratified in 5-year bins. Each dashed black line in the Brazil, Georgia and Zambia plots denotes the age distribution of one of 132 other LMICs that best matches (i.e., lowest mean absolute error) the age distribution of the simulated country archetype. Age distribution of the population in each country is downloaded from World Population Prospects compiled by the United Nations. b Heatmap showing the normalized relative contact rates between individuals of different age groups in 5-year bins averaged across all contact networks generated by the PATAT simulation model.
Fig. 2
Fig. 2. Impact of test-and-treat on severe cases.
No restrictions on access to symptomatic testing at clinics (i.e., all symptomatic individuals who sought testing at clinics would receive one if in stock) and high-risk household contacts of test-positive individuals are not tested. All eligible high-risk individuals (i.e., ≥60 years of age or an adult ≥18 years with a relevant comorbidity) who tested positive were given a course of oral antivirals. Line plots (left axis) show the mean percentage change (standard deviation denoted by error bars; n = 5 independent simulations) in severe cases relative to no distribution of antivirals under different levels of mean test availability (different shades of color) after a 90-day epidemic wave in a population of 1,000,000 individuals with a 10%, b 50%, and c 90% vaccination coverage for different epidemic intensities (measured by the initial effective reproduction number (Re); x axis). Bar plots (right y axis) show the number of severe cases in each corresponding scenario. The dotted outline of each bar shows the number of severe cases of each scenario when no antivirals were distributed.
Fig. 3
Fig. 3. Impact of test-and-treat on severe cases when restricting symptomatic testing to high-risk individuals only.
High-risk household contacts of test-positive individuals are not tested. All eligible high-risk individuals (i.e., ≥60 years of age or an adult ≥18 years with a relevant comorbidity) who tested positive were given a course of oral antivirals. Line plots (left y axis) show the mean percentage change (standard deviation denoted by error bars; n = 5 independent simulations) in severe cases relative to no distribution of antivirals under different levels of mean test availability (different shades of color) after a 90-day epidemic wave in a population of 1,000,000 individuals with a 10%, b 50%, and c 90% vaccination coverage for different epidemic intensities (measured by the initial effective reproduction number (Re); x axis). Bar plots (right y axis) show the number of severe cases in each corresponding scenario. The dotted outline of each bar shows the number of severe cases of each scenario when no antivirals were distributed.
Fig. 4
Fig. 4. Estimated need of oral antivirals.
Line plots show the ratio of estimated oral antiviral courses needed to number of people per year (expressed as 1 oral antiviral course per n number of individuals; assuming two epidemic waves a year) in simulated countries (color) under different simulated scenarios (i.e., testing rate at 100 or 500 tests/100,000 people/day (shading and linestyle) and distribution modality (left plot panel: test all symptomatic individuals who sought testing at clinics; middle plot panel: test all symptomatic individuals who sought testing as well as distributing clinic-provided self-tests to high-risk asymptomatic household contacts of test-positive individuals; right plot panel: test only high-risk symptomatic individuals who sought testing at clinics). All test-positive eligible high-risk individuals from clinic-provided testing would receive a course of oral antivirals. a 10%, b 50%, and c 90% vaccination coverage assumed for the simulated population.
Fig. 5
Fig. 5. Impact of test-and-treat in a high-income country (Netherlands) with wide availability of over-the-counter-self-tests.
No restrictions on access to symptomatic testing at clinics (i.e., all symptomatic individuals who sought testing at clinics would receive one if in stock) and high-risk household contacts of test-positive individuals are not tested. Over-the-counter antigen rapid diagnostic tests (Ag-RDTs) are assumed to be widely available with unlimited stocks. As such, we assumed that only 10% of symptomatic individuals would seek clinical testing directly while 80% of those who opted not to seek clinic-provided testing would perform self-testing using over-the-counter Ag-RDTs. All high-risk individuals who tested positive through self-testing would seek reflexive testing at clinics on the same day. All eligible high-risk individuals (i.e., ≥60 years of age or an adult ≥18 years with a relevant comorbidity) who tested positive at clinics, either directly or through reflexive testing, were given a course of oral antivirals. Line plots (left y axis) show the mean percentage change (standard deviation denoted by error bars; n = 5 independent simulations) in a total infections, b severe cases and c deaths relative to no distribution of antivirals under different clinical testing rates (different shades of color) after a 90-day SARS-CoV-2 epidemic wave in a population of 1,000,000 individuals with 80% vaccination coverage for different epidemic intensities (measured by the initial effective reproduction number (Re); x axis). Bar plots (right y axis) show the number of severe cases in each corresponding scenario. The dotted outline of each bar shows the number of severe cases of each scenario when no antivirals were distributed.

Update of

References

    1. Singh M, de Wit E. Antiviral agents for the treatment of COVID-19: progress and challenges. Cell Rep. Med. 2022;3:100549. doi: 10.1016/j.xcrm.2022.100549. - DOI - PMC - PubMed
    1. Jayk Bernal A, et al. Molnupiravir for oral treatment of Covid-19 in non-hospitalized patients. N. Engl. J. Med. 2022;386:509–520. doi: 10.1056/NEJMoa2116044. - DOI - PMC - PubMed
    1. Hammond J, et al. Oral nirmatrelvir for high-risk, nonhospitalized adults with Covid-19. N. Engl. J. Med. 2022;386:1397–1408. doi: 10.1056/NEJMoa2118542. - DOI - PMC - PubMed
    1. Najjar-Debbiny R, et al. Effectiveness of paxlovid in reducing severe coronavirus disease 2019 and mortality in high-risk patients. Clin. Infect. Dis. 2022;76:e342–e349. doi: 10.1093/cid/ciac443. - DOI - PMC - PubMed
    1. Matrajt L, et al. Could widespread use of antiviral treatment curb the COVID-19 pandemic? A modeling study. BMC Infect. Dis. 2022;22:1–16. doi: 10.1186/s12879-022-07639-1. - DOI - PMC - PubMed

Publication types

Substances