. 2024 Feb;130(2):213-223.
doi: 10.1038/s41416-023-02500-x. Epub 2023 Dec 2.

Stromal localization of inactive CD8+ T cells in metastatic mismatch repair deficient colorectal cancer

Affiliations

Stromal localization of inactive CD8+ T cells in metastatic mismatch repair deficient colorectal cancer

Emre Küçükköse et al. Br J Cancer. 2024 Feb.

Abstract

Background: The determinants of metastasis in mismatch repair deficiency with high levels of microsatellite instability (MSI-H) in colorectal cancer (CRC) are poorly understood. Here, we hypothesized that distinct immune and stromal microenvironments in primary tumors may discriminate between non-metastatic MSI-H CRC and metastatic MSI-H CRC.

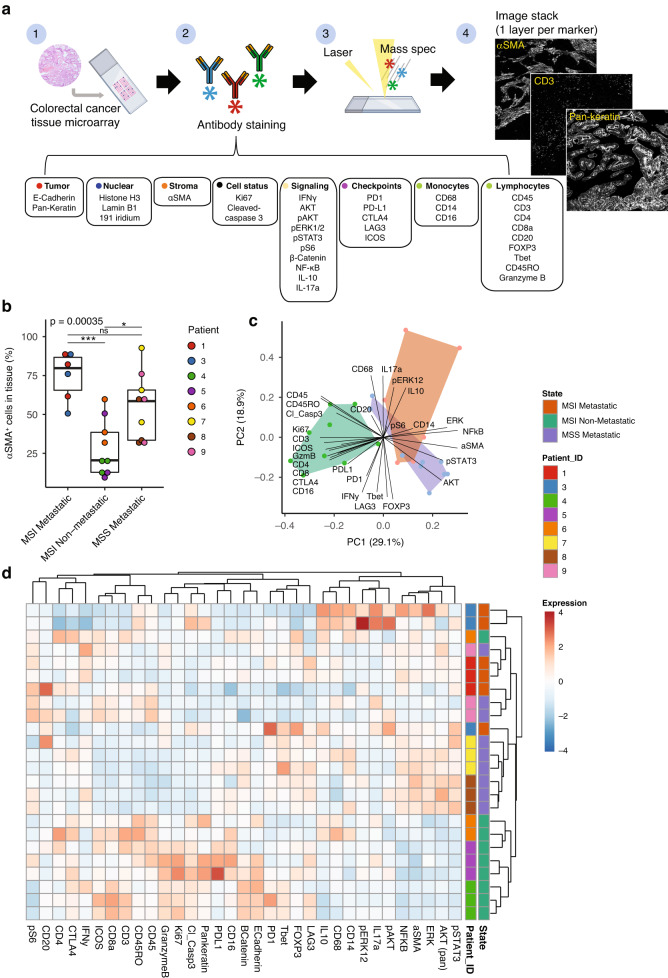
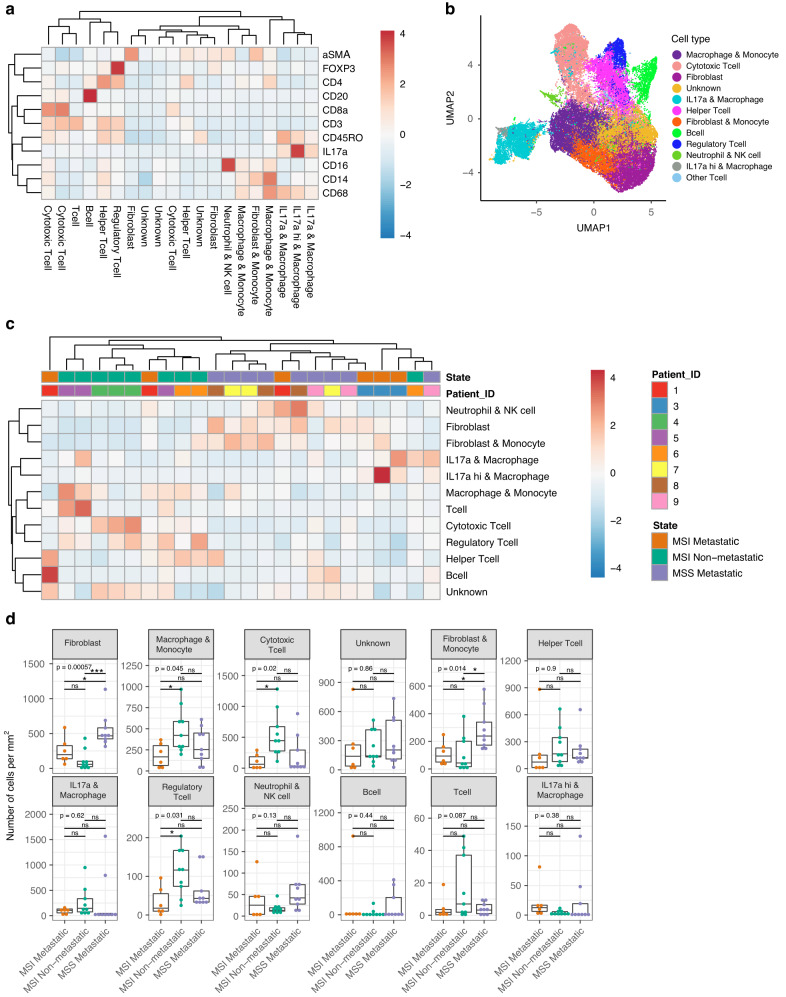
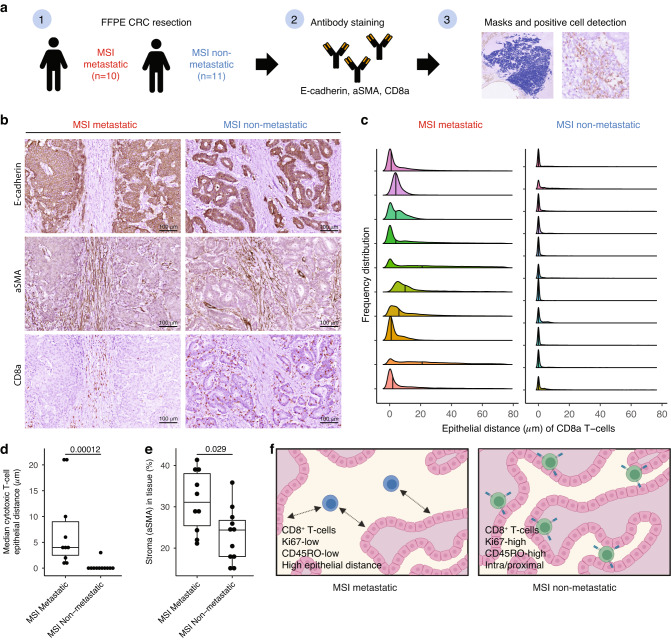
Methods: We profiled 46,727 single cells using high-plex imaging mass cytometry and analyzed both differential cell type abundance, and spatial distribution of fibroblasts and immune cells in primary CRC tumors with or without metastatic capacity. We validated our findings in a second independent cohort using immunohistochemistry.

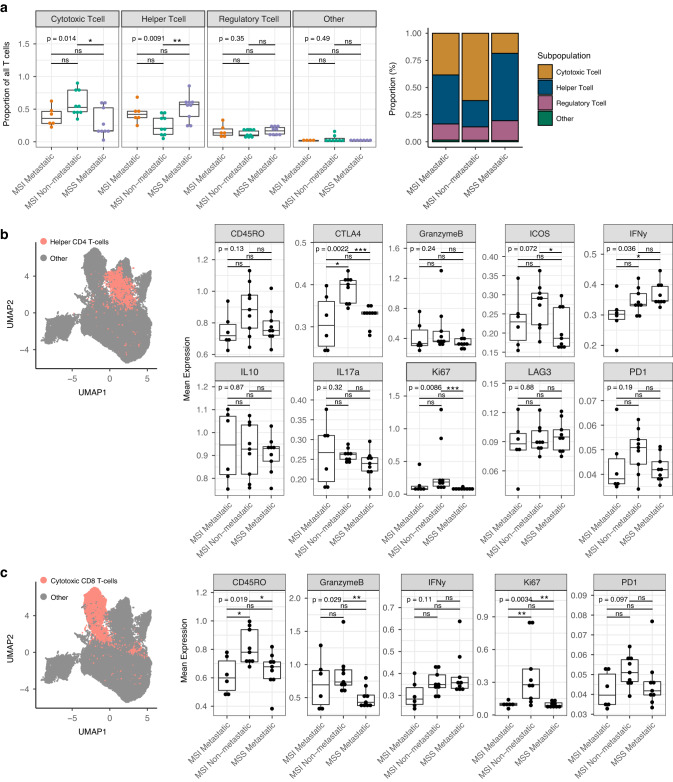
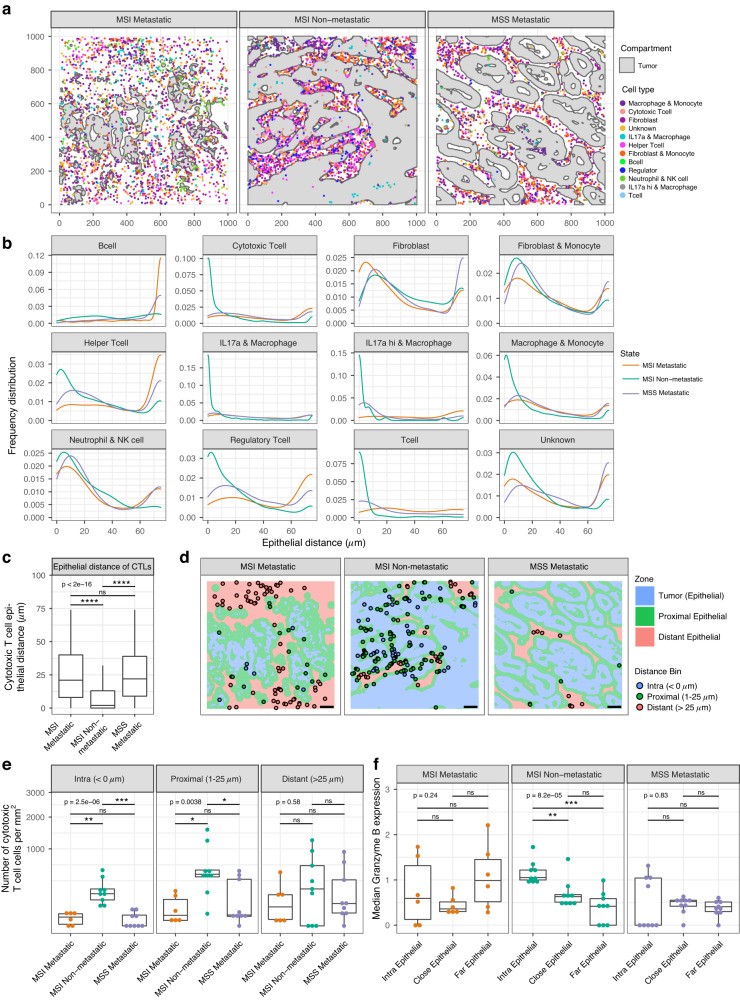
Results: High-plex imaging mass cytometry and hierarchical clustering based on microenvironmental markers separated primary MSI-H CRC tumors with and without metastatic capacity. Primary tumors with metastatic capacity displayed a high stromal content and low influx of CD8+ T cells, which expressed significantly lower levels of markers reflecting proliferation (Ki67) and antigen-experience (CD45RO) compared to CD8+ T cells in non-metastatic tumors. CD8+ T cells showed intra-epithelial localization in non-metastatic tumors, but stromal localization in metastatic tumors, which was validated in a second cohort.

Conclusion: We conclude that localization of phenotypically distinct CD8+ T cells within stroma may predict metastasis formation in MSI-H CRC.


Conflict of interest statement

The authors declare no competing interests.

Figures

Fig. 1
Fig. 1. TME markers distinguish non-metastatic from metastatic colorectal tumors.
a Illustration of the data acquisition workflow used for Imaging mass cytometry (IMC): (1) One 4 µm-thick section of a TMA composed of 2 mm2 CRC cores (2) was stained with a cocktail of 35 antibodies labeled with unique metal isotopes. (3) Samples were ablated with a high-energy laser in a rasterized pattern. The resulting plumes were ionized and analyzed by a mass cytometer, which returned the metal isotope composition per pixel. (4) Each antibody resulted in a single image per sample, and together constructed a multi-channel image stack. b Boxplot represents the percentage of αSMA+ cells in tissue per group, individual patients are color-coded. c Principal component analysis using the median intensity of each marker per image region as input variables. Each data point is a given ROI, color-coded by tumor state. Black lines depict the contribution of individual markers to the first two principal components (PC1 and PC2) of the analysis. d Hierarchical clustering analysis of ROIs according to median marker intensity of segmented stromal/immune cells. Tumor state and patient ID are indicated using a color code on the right side.
Fig. 2
Fig. 2. Cell-type annotation reveals differential microenvironment composition between metastatic and non-metastatic primary CRC tumors.
a Hierarchical cluster analysis heatmap of lineage marker expression. The heatmap shows the expression levels of 11 markers used for defining cell clusters. b Uniform Manifold Approximation and Projection (UMAP) of single cells (N = 46,727) of all ROIs combined using lineage marker intensities, color-coded by annotated cell lineages. c Heatmap showing hierarchical clustering on cell-type abundance for all cell lineages and individual ROIs. d Boxplot showing the median of number of cells per mm2 stratified for annotated cell-types, across disease groups.
Fig. 3
Fig. 3. Metastatic MSI-H tumors lack proliferating antigen-experienced CD8+ T cells.
a Boxplot and stacked bar plot represent the proportions of cytotoxic-, helper-, regulatory- or other T cell of all T cells. b UMAP of all stromal and immune cells, highlighting the helper T cells as red dots. Boxplots represent the median expression per ROI of given markers for helper T cells. c UMAP of all stromal and immune cells, cytotoxic T cells are indicated as red dots. Boxplots represent the median expression of given markers per ROI for cytotoxic T cells.
Fig. 4
Fig. 4. Spatial analysis reveals distinct localization of cell-types in the tumor microenvironment.
a Spatial representation of representative ROIs per disease group with segmented tumor regions displayed as gray polygons and the identified cells are shown as dots, colored by cell-type. b Tumor distance plots demonstrating the relative frequency distribution of given cell populations. c Boxplot represents the median epithelial distance of cytotoxic T cells per group. d Spatial representation of cytotoxic T cell localization relative to the tumor, color-coded by distance bin: ‘intra’ (blue), ‘proximal’ (1–25 µm; green) and ‘distant’ (>25 µm; red). Scale bar indicates 100 µm. e Boxplots represent the number of cytotoxic T cells per mm2 per distance bin and group (median per ROI). f Boxplots represent the median Granzyme B expression in cytotoxic T cells per distance bin and group (median per ROI).
Fig. 5
Fig. 5. Cytotoxic T cells reside in high stromal content in metastatic MSI-H tumors.
a Illustration of the data acquisition workflow used for the IHC validation cohort: (1) FFPE sections of resected primary CRC with (n = 10) or without (n = 11) metastatic disease were (2) stained for E-cadherin, αSMA and CD8a using IHC. (3) Tumor segmentation was performed, and masks were generated using Qupath [49]. Individual cytotoxic T cells were identified. b Representative IHC images of E-cadherin, αSMA, and CD8a. Scale bar is 100 µm. c Boxplot demonstrates the median distance frequency distribution of single cytotoxic T cells per tumor. d Boxplot representing the median epithelial distance of cytotoxic T cells per ROI, shown per group. e Boxplot representing the percentage of αSMA+ stroma per ROI and group. f Schematic model of CD8+ T cell phenotype and localization in the CRC microenvironment of metastatic and non-metastatic MSI-H tumors.

References

    1. Taieb J, Svrcek M, Cohen R, Basile D, Tougeron D, Phelip J-M. Deficient mismatch repair/microsatellite unstable colorectal cancer: Diagnosis, prognosis and treatment. Eur J Cancer. 2022;175:136–57. doi: 10.1016/j.ejca.2022.07.020. - DOI - PubMed
    1. Galon J, Costes A, Sanchez-Cabo F, Kirilovsky A, Mlecnik B, Lagorce-Pagès C, et al. Type, density, and location of immune cells within human colorectal tumors predict clinical outcome. Science. 2006;313:1960–4. doi: 10.1126/science.1129139. - DOI - PubMed
    1. Bruni D, Angell HK, Galon J. The immune contexture and Immunoscore in cancer prognosis and therapeutic efficacy. Nat Rev Cancer. 2020;20:662–80. doi: 10.1038/s41568-020-0285-7. - DOI - PubMed
    1. Popat S, Hubner R, Houlston RS. Systematic review of microsatellite instability and colorectal cancer prognosis. J Clin Oncol. 2005;23:609–18. doi: 10.1200/JCO.2005.01.086. - DOI - PubMed
    1. Kim CG, Ahn JB, Jung M, Beom SH, Kim C, Kim JH, et al. Effects of microsatellite instability on recurrence patterns and outcomes in colorectal cancers. Br J Cancer. 2016;115:25–33. doi: 10.1038/bjc.2016.161. - DOI - PMC - PubMed

Publication types