

Deep Learning-Based H-Score Quantification of Immunohistochemistry-Stained Images
- PMID: 38043788
- PMCID: PMC11141889
- DOI: 10.1016/j.modpat.2023.100398
Deep Learning-Based H-Score Quantification of Immunohistochemistry-Stained Images
Abstract
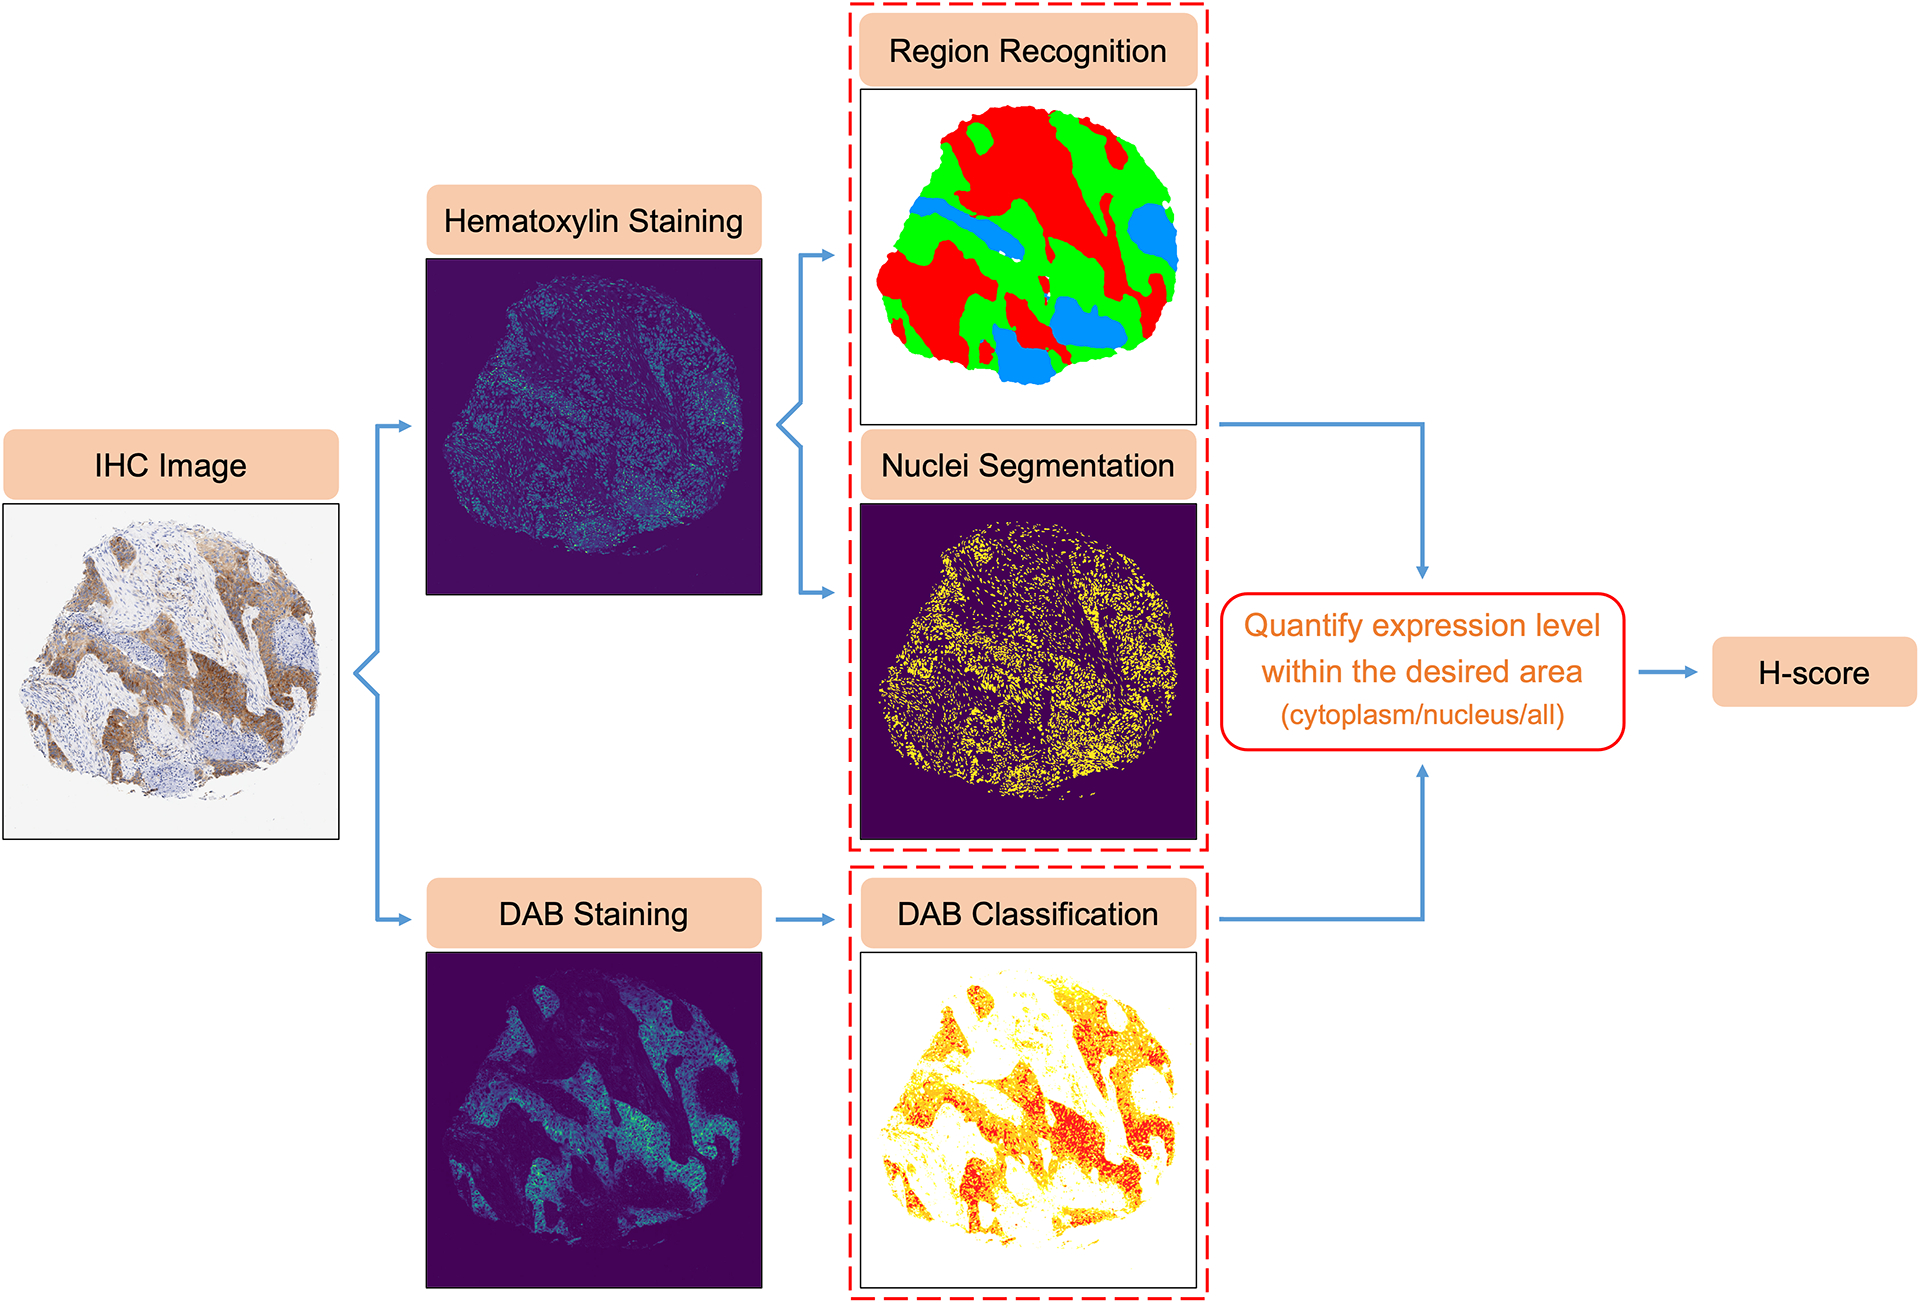
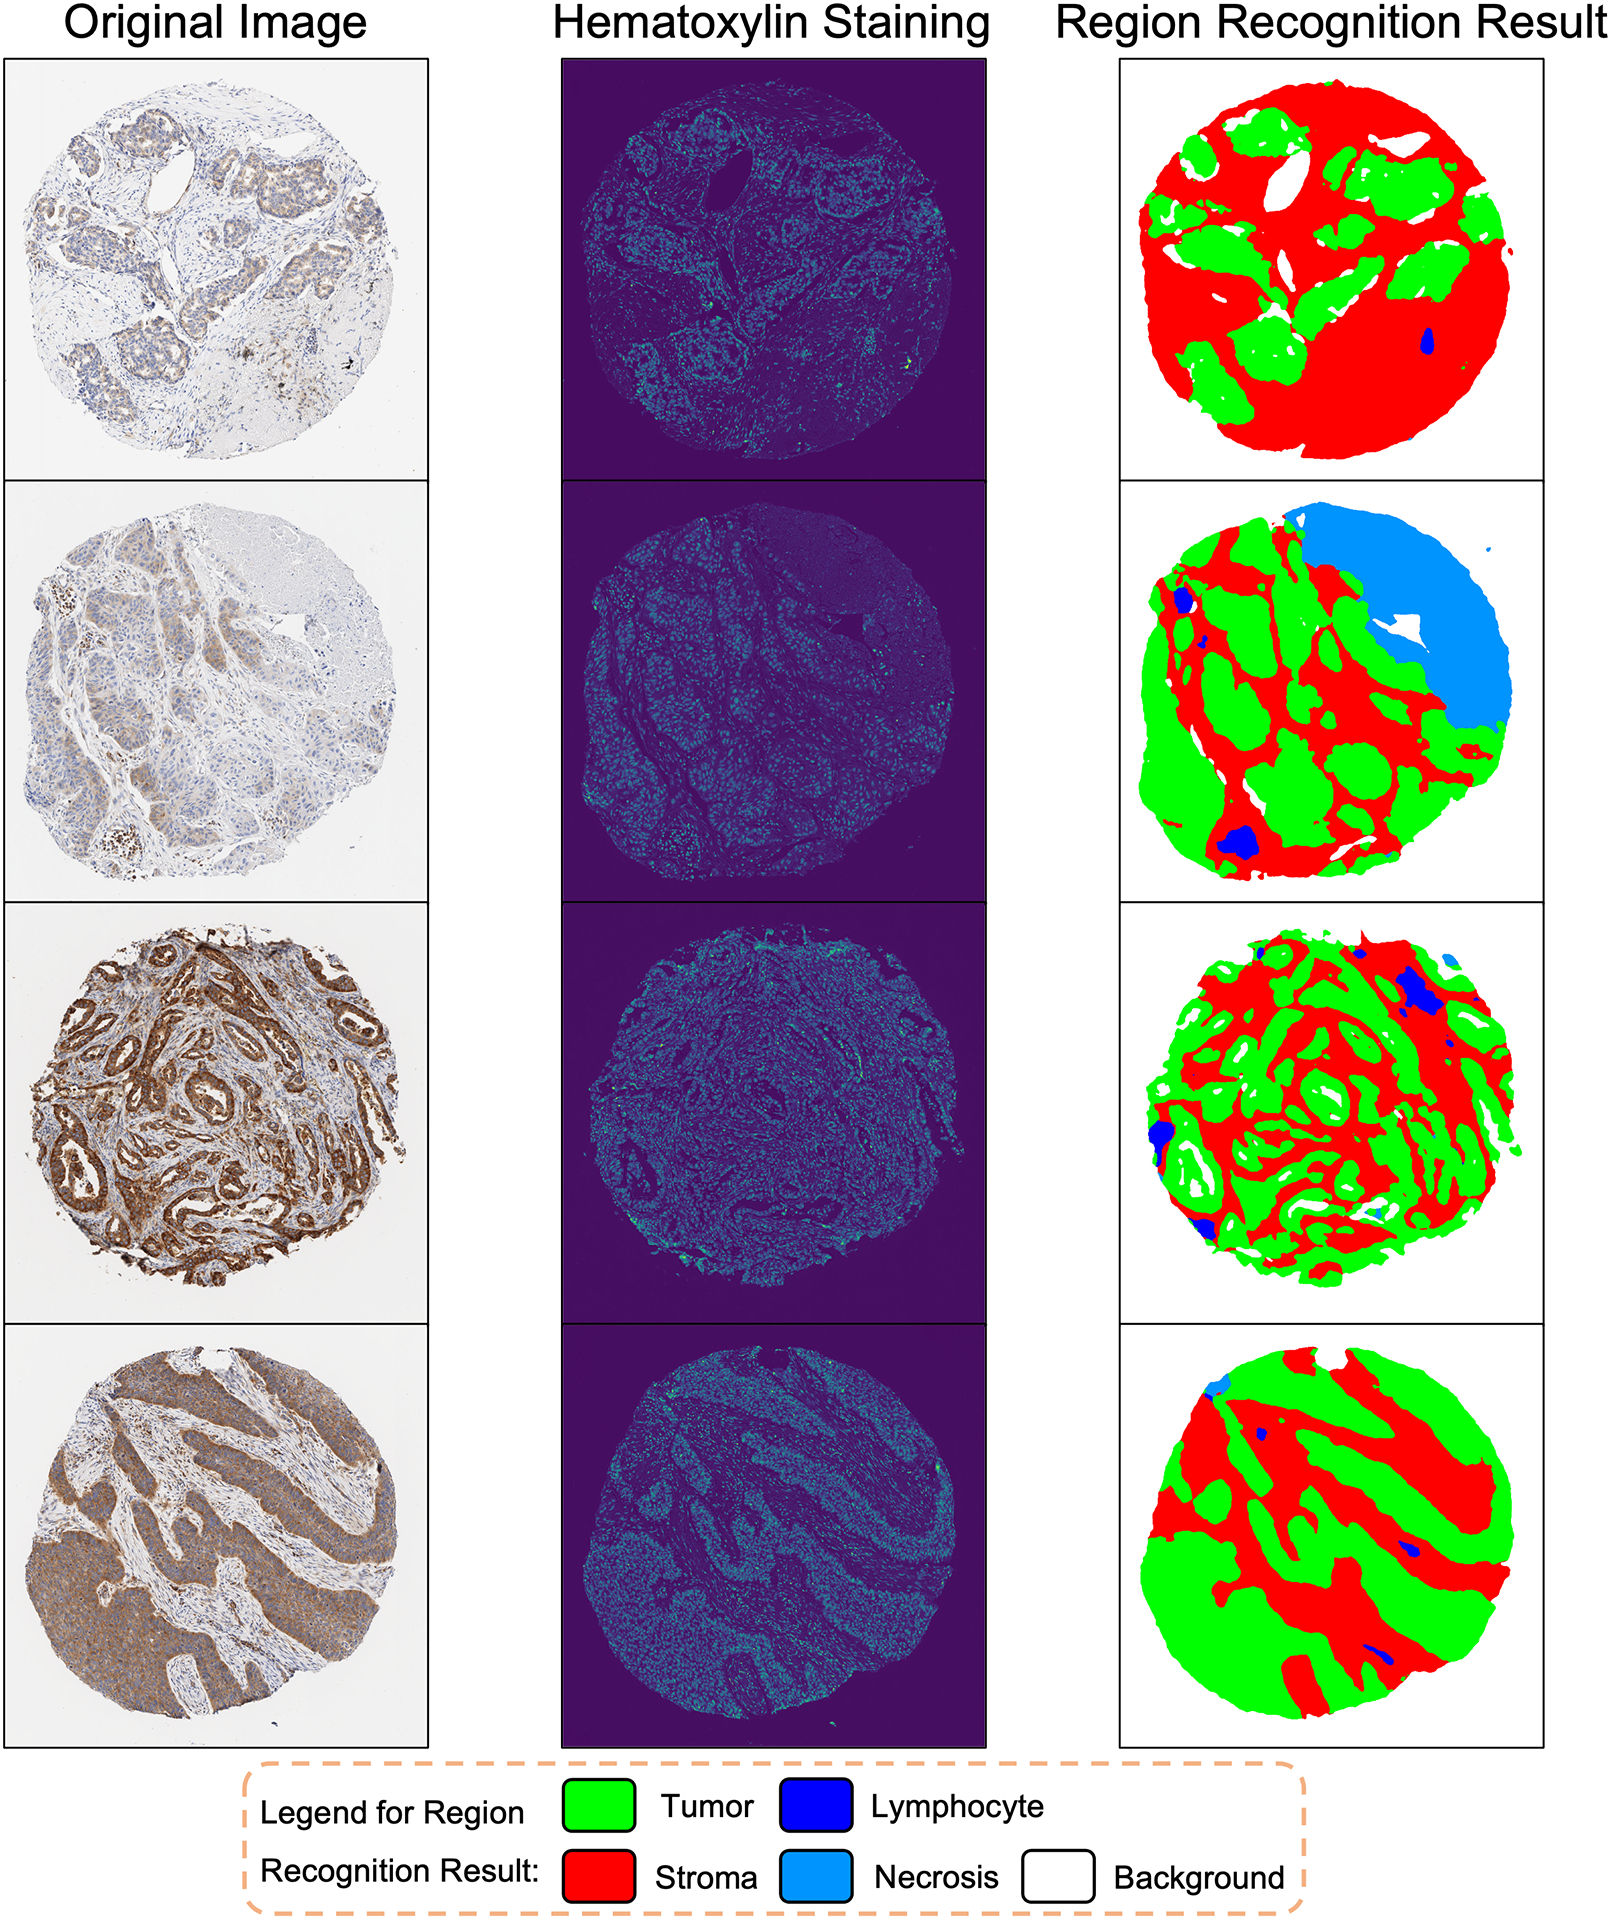
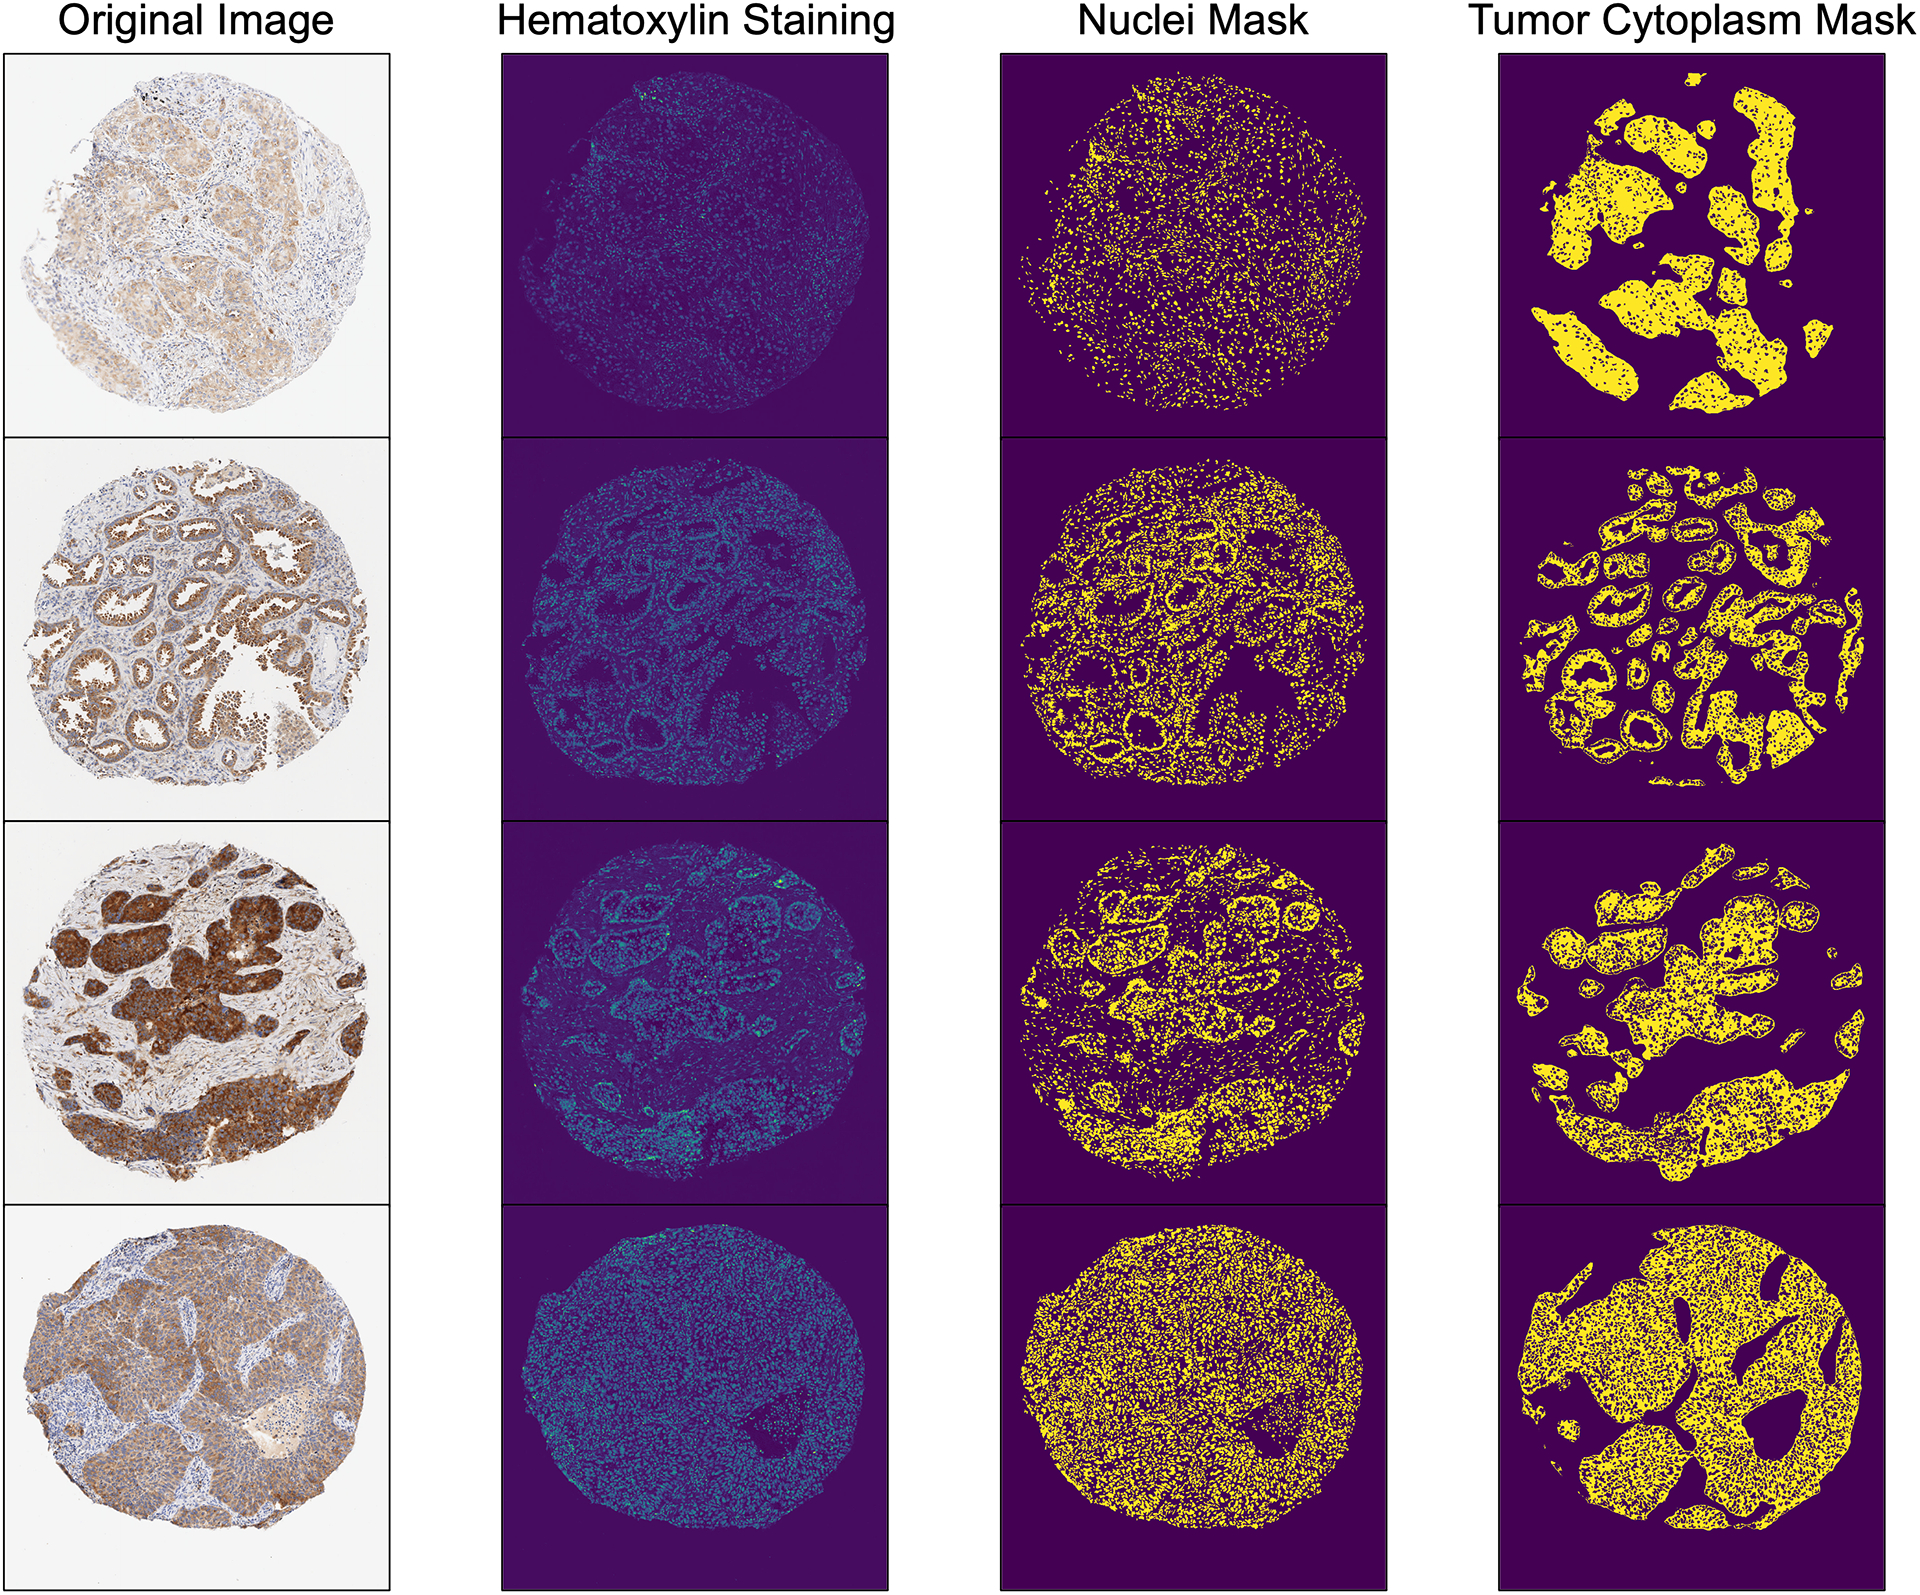
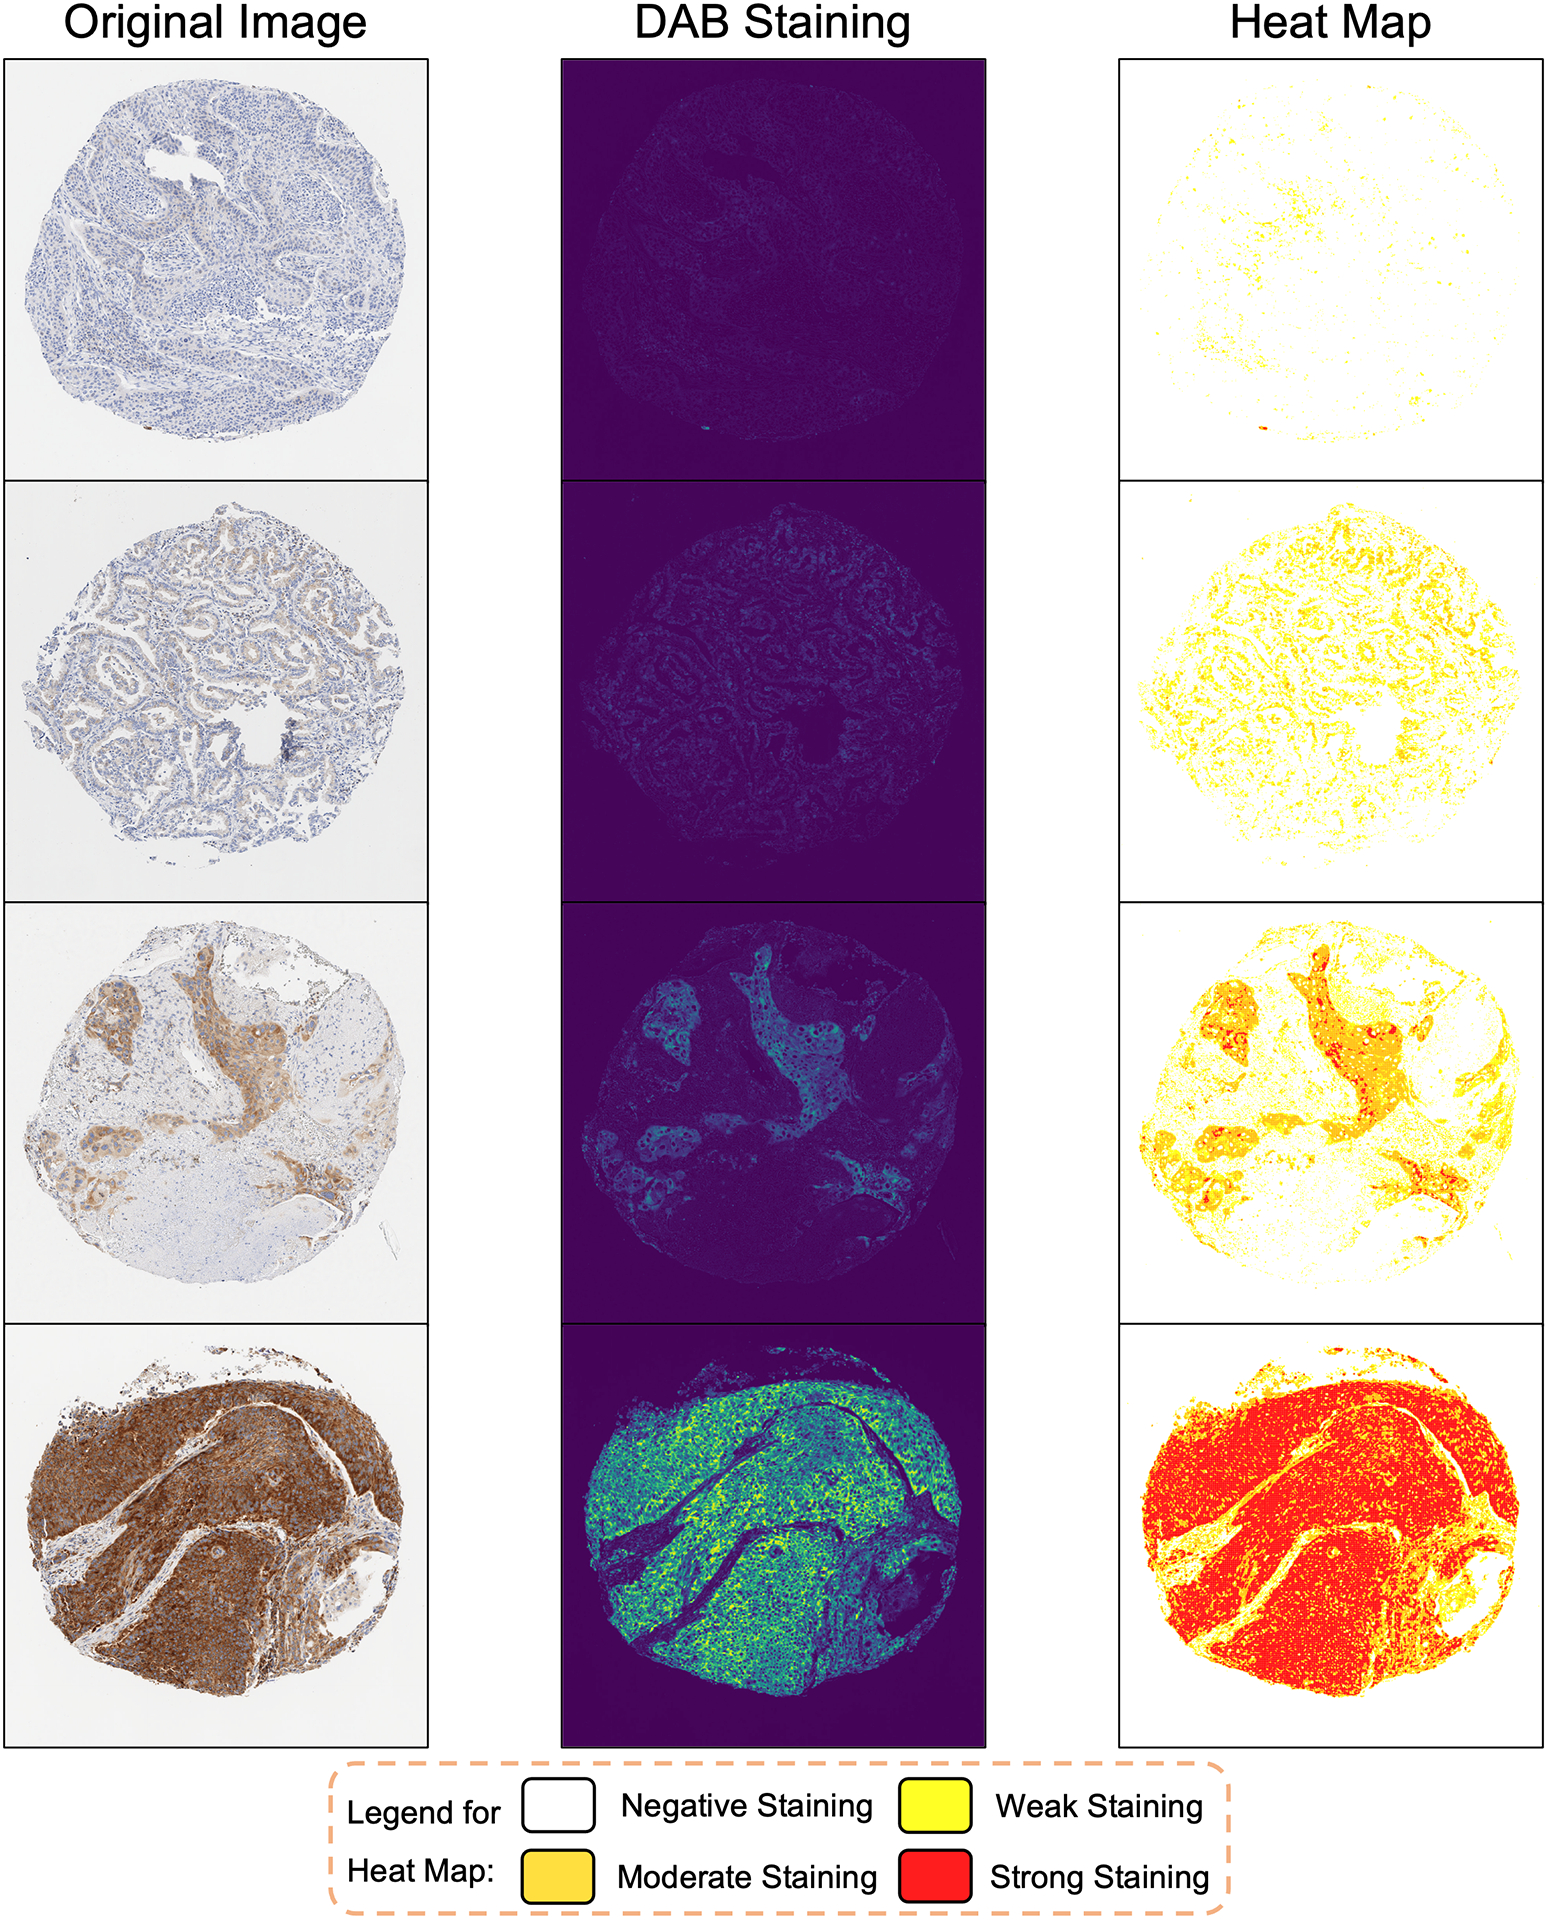
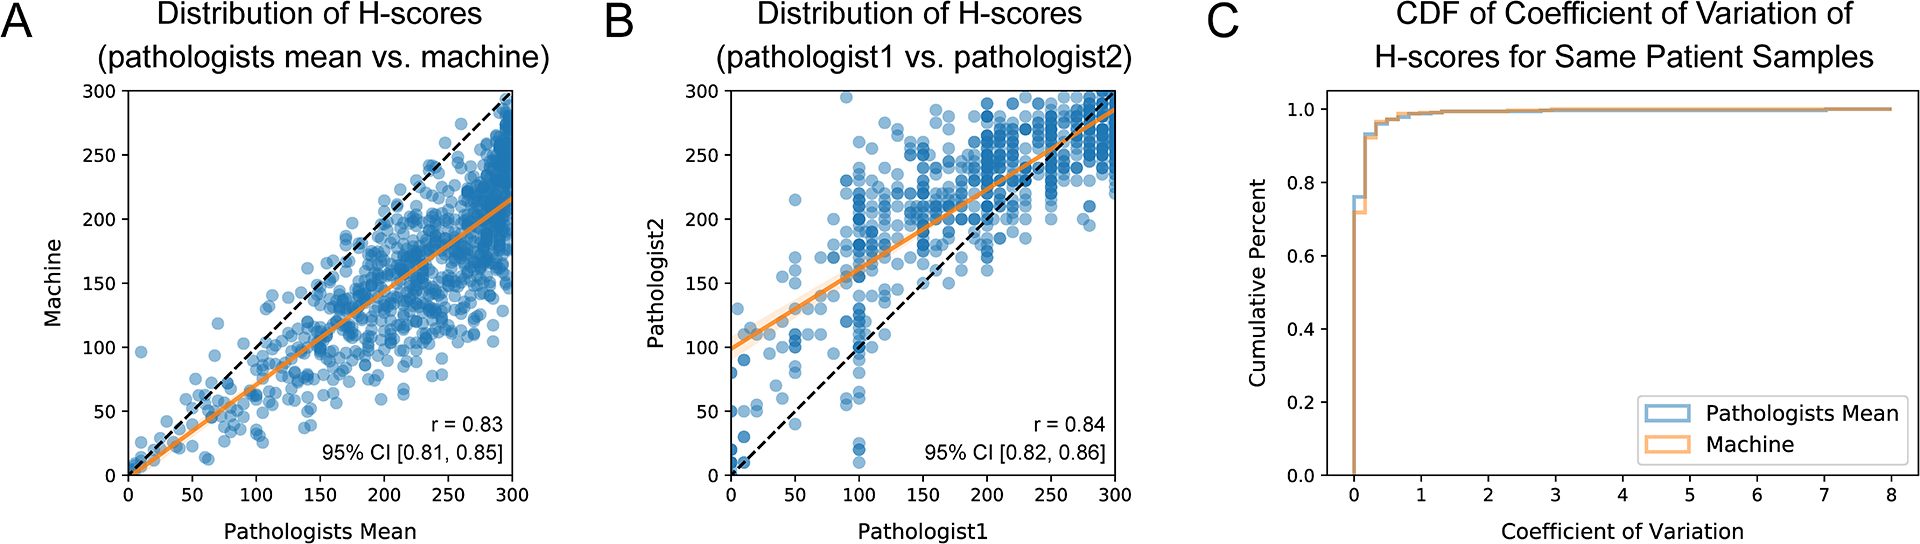
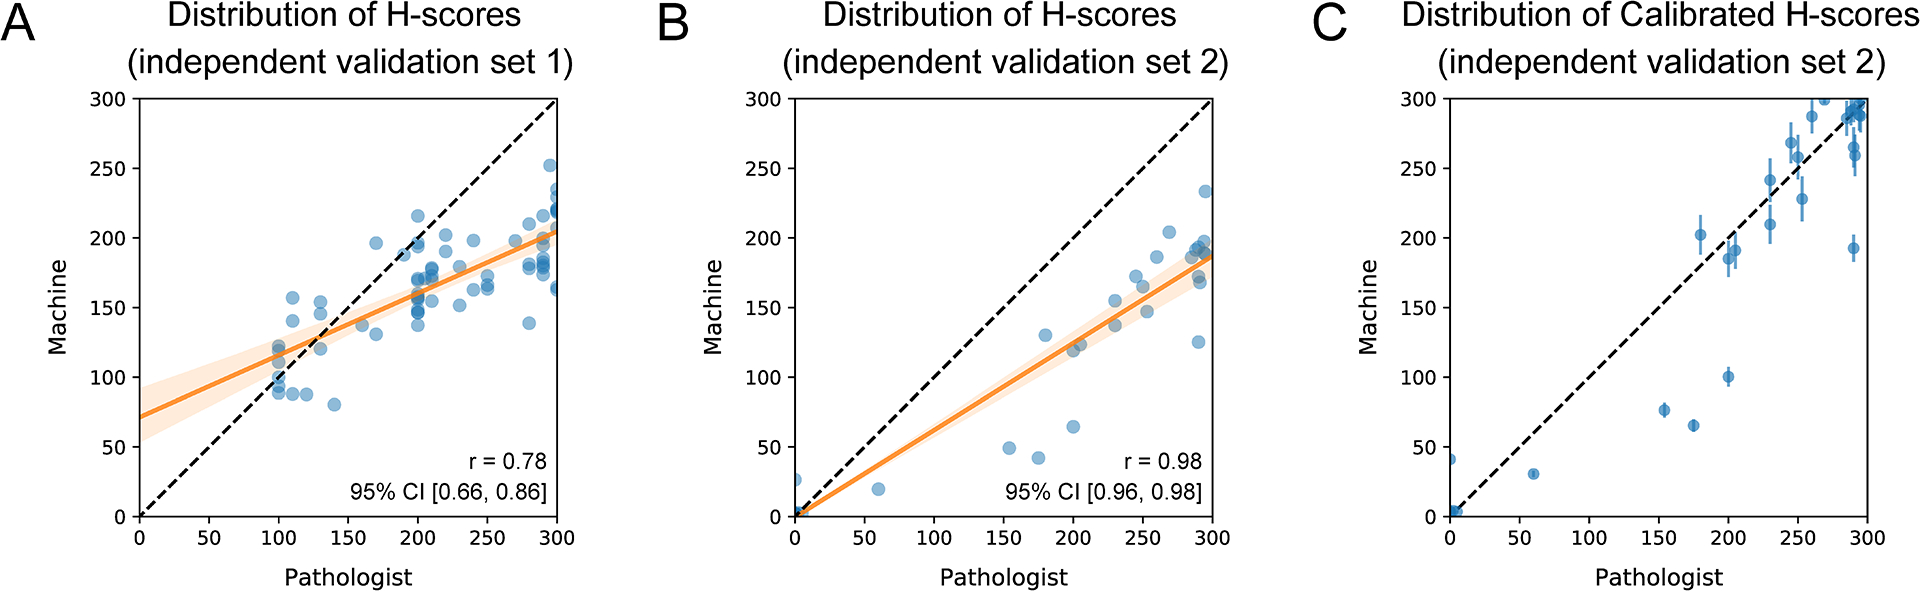
Immunohistochemistry (IHC) is a well-established and commonly used staining method for clinical diagnosis and biomedical research. In most IHC images, the target protein is conjugated with a specific antibody and stained using diaminobenzidine (DAB), resulting in a brown coloration, whereas hematoxylin serves as a blue counterstain for cell nuclei. The protein expression level is quantified through the H-score, calculated from DAB staining intensity within the target cell region. Traditionally, this process requires evaluation by 2 expert pathologists, which is both time consuming and subjective. To enhance the efficiency and accuracy of this process, we have developed an automatic algorithm for quantifying the H-score of IHC images. To characterize protein expression in specific cell regions, a deep learning model for region recognition was trained based on hematoxylin staining only, achieving pixel accuracy for each class ranging from 0.92 to 0.99. Within the desired area, the algorithm categorizes DAB intensity of each pixel as negative, weak, moderate, or strong staining and calculates the final H-score based on the percentage of each intensity category. Overall, this algorithm takes an IHC image as input and directly outputs the H-score within a few seconds, significantly enhancing the speed of IHC image analysis. This automated tool provides H-score quantification with precision and consistency comparable to experienced pathologists but at a significantly reduced cost during IHC diagnostic workups. It holds significant potential to advance biomedical research reliant on IHC staining for protein expression quantification.
Keywords: H-score; deep learning; immunohistochemistry image; pathology image analysis; protein expression quantification.
Copyright © 2023 United States & Canadian Academy of Pathology. Published by Elsevier Inc. All rights reserved.
Conflict of interest statement
Conflict of Interest
The authors declare no conflict of interest.
Figures
References
-
- Graham RC Jr, Karnovsky MJ. THF EARLY STAGES OF ABSORPTION OF INJECTED HORSERADISH PEROXIDASE IN THE PROXIMAL TUBULES OF MOUSE KIDNEY: ULTRASTRUCTURAL CYTOCHEMISTRY BY A NEW TECHNIQUE. J Histochem Cytochem. 1966;14(4):291–302. - PubMed
-
- Ramos-Vara J, Miller M. When tissue antigens and antibodies get along: revisiting the technical aspects of immunohistochemistry—the red, brown, and blue technique. Vet Pathol. 2014;51(1):42–87. - PubMed
MeSH terms
Substances
Grants and funding
- R01 CA273585/CA/NCI NIH HHS/United States
- R01 DE030656/DE/NIDCR NIH HHS/United States
- R01 GM141519/GM/NIGMS NIH HHS/United States
- P30 CA142543/CA/NCI NIH HHS/United States
- U01 AI156189/AI/NIAID NIH HHS/United States
- R01 GM115473/GM/NIGMS NIH HHS/United States
- P50 CA070907/CA/NCI NIH HHS/United States
- R01 CA207763/CA/NCI NIH HHS/United States
- K00 CA253718/CA/NCI NIH HHS/United States
- R01 GM140012/GM/NIGMS NIH HHS/United States
- F99 CA253718/CA/NCI NIH HHS/United States
- U01 CA249245/CA/NCI NIH HHS/United States
- R35 GM136375/GM/NIGMS NIH HHS/United States
LinkOut - more resources
Full Text Sources
