. 2023 Dec 3;13(1):21321.
doi: 10.1038/s41598-023-48601-8.

Forecasting local hospital bed demand for COVID-19 using on-request simulations

Affiliations

Forecasting local hospital bed demand for COVID-19 using on-request simulations

Raisa Kociurzynski et al. Sci Rep. .

Abstract

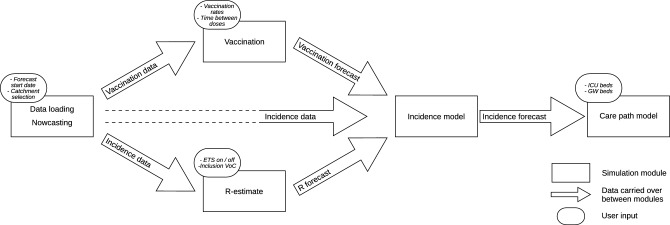
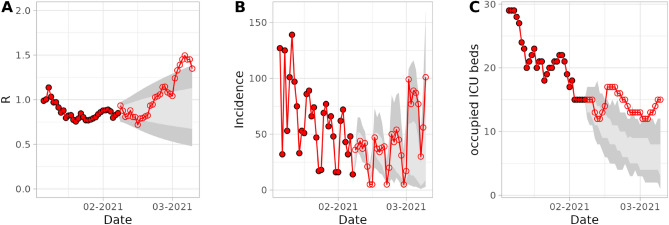
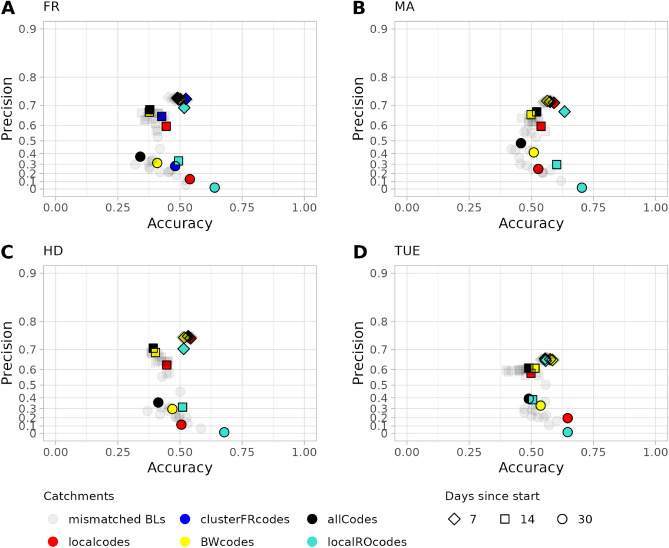
Accurate forecasting of hospital bed demand is crucial during infectious disease epidemics to avoid overwhelming healthcare facilities. To address this, we developed an intuitive online tool for individual hospitals to forecast COVID-19 bed demand. The tool utilizes local data, including incidence, vaccination, and bed occupancy data, at customizable geographical resolutions. Users can specify their hospital's catchment area and adjust the initial number of COVID-19 occupied beds. We assessed the model's performance by forecasting ICU bed occupancy for several university hospitals and regions in Germany. The model achieves optimal results when the selected catchment area aligns with the hospital's local catchment. While expanding the catchment area reduces accuracy, it improves precision. However, forecasting performance diminishes during epidemic turning points. Incorporating variants of concern slightly decreases precision around turning points but does not significantly impact overall bed occupancy results. Our study highlights the significance of using local data for epidemic forecasts. Forecasts based on the hospital's specific catchment area outperform those relying on national or state-level data, striking a better balance between accuracy and precision. These hospital-specific bed demand forecasts offer valuable insights for hospital planning, such as adjusting elective surgeries to create additional bed capacity promptly.


Conflict of interest statement

The authors declare no competing interests.

Figures

Figure 1
Figure 1
Model structure showing each of the modules, the data carried over between modules, and the possible user input in each module.
Figure 2
Figure 2
The user interface of the on-request COVID-19 bed demand forecasting model. (A) Side panel with basic controls, (B) Reported incidence, (C) Effective R forecast, (D) Vaccination forecast, (E) Incidence forecast, and (F) Bed occupancy forecast.
Figure 3
Figure 3
Example forecasts of Rt, Incidence, and occupied ICU beds. The forecasts start on the 07-02-2021. Filled red dots represent the 30 previous days and empty red circles represent 30 forecasted days. The performance of the forecasts was validated by calculating its accuracy and precision. Accuracy is defined as the number of observations (dots) falling into the interquartile range (IQR, light grey) and the 95% interval range (dark grey). In this example, the accuracy of the Rt forecast is 0.43 and 0.2, respectively.
Figure 4
Figure 4
Accuracy of the Incidence forecast. Accuracy is shown for the (A) local Freiburg catchment, (B) the Freiburg cluster, (C) Baden-Württemberg, (D) and whole Germany over 30 days. Solid lines represent accuracy based on the interquartile range (IQR) while dashed lines represent accuracy based on the 95% range. The Rt-value was predicted using the naive forecast (black lines), naive forecast including VoC (red lines), exponential smoothing (ETS) (dark blue lines), and exponential smoothing including VoC (turquoise lines).
Figure 5
Figure 5
Precision of the Incidence forecast. Precision is shown for (A) local Freiburg catchment, (B) the Freiburg cluster, (C) Baden-Württemberg, (D) and whole Germany over 30 days. The Rt-value was predicted using the naive forecast (black line), naive forecast including VoC (red line), exponential smoothing (ETS) (blue line), and exponential smoothing including VoC (turquoise line).
Figure 6
Figure 6
ICU bed forecast based on the bed occupancy of the University Hospital in Freiburg. Forecasts are based on different methods for predicting the Rt-value: exponential smoothing (ETS, left vertical panel) and exponential smoothing including VoC (right vertical panel). The first horizontal panel (A,B) shows the accuracy. Colours represent different catchment areas (red: Freiburg local, blue: Freiburg cluster, yellow: Baden-Württemberg (BW), turquoise: Rostock, black: whole Germany, grey: all states separately except BW). The lower bundle of lines represent accuracy based on the interquartile range (IQR) while the upper bundle represent accuracy based on the 95% confidence range. Second vertical panel (C,D) depicts relative precision. Third horizontal panel (E,F) shows precision on a log transformed scale versus accuracy. Diamond shapes represent the 7th day, square shapes the 14th day, and circles the 30th day of the forecasts.
Figure 7
Figure 7
Precision versus Accuracy of ICU bed forecasts. Results are based on the bed occupancy of the University Hospitals in (A) Freiburg (FR), (B) Mannheim (MA), (C) Heidelberg (HD), (D) Tübingen (TUE). Forecasts are based on the Rt-value predicted by exponential smoothing including VoC (ETS with VoC). Colours represent different catchment areas (red: local, blue: Freiburg cluster (only in FR plot), yellow: Baden-Württemberg (BW), turquoise: Rostock, black: whole Germany, grey: all states separately except BW). Diamond shapes represent the 7th day, square shapes the 14th day, and circles the 30th day of the forecasts.

References

    1. Li, R. et al. The demand for inpatient and ICU beds for COVID-19 in the US: Lessons from Chinese cities. medRxiv 2020.03.09.20033241. https://www.medrxiv.org/content/10.1101/2020.03.09.20033241v2 (2020). - DOI
    1. Emanuel, E. J. et al. Fair allocation of scarce medical resources in the time of covid-19 (2020). - PubMed
    1. Dong E, Du H, Gardner L. An interactive web-based dashboard to track covid-19 in real time. Lancet Infect. Dis. 2020;20:533–534. doi: 10.1016/S1473-3099(20)30120-1. - DOI - PMC - PubMed
    1. Salehi M, et al. A synergetic r-shiny portal for modeling and tracking of covid-19 data. Front. Public Health. 2021;8:623624. doi: 10.3389/fpubh.2020.623624. - DOI - PMC - PubMed
    1. Covid-19 dashboard by the center for systems science and engineering (csse) at johns hopkins university (jhu). https://www.arcgis.com/apps/dashboards/bda7594740fd40299423467b48e9ecfi. Accessed: 2023-07-06.