Glutamate measurements using edited MRS
- PMID: 38044723
- PMCID: PMC10865745
- DOI: 10.1002/mrm.29929
Glutamate measurements using edited MRS
Abstract
Purpose: To demonstrate J-difference coediting of glutamate using Hadamard encoding and reconstruction of Mescher-Garwood-edited spectroscopy (HERMES).
Methods: Density-matrix simulations of HERMES (TE 80 ms) and 1D J-resolved (TE 31-229 ms) of glutamate (Glu), glutamine (Gln), γ-aminobutyric acid (GABA), and glutathione (GSH) were performed. HERMES comprised four sub-experiments with editing pulses applied as follows: (A) 1.9/4.56 ppm simultaneously (ONGABA /ONGSH ); (B) 1.9 ppm only (ONGABA /OFFGSH ); (C) 4.56 ppm only (OFFGABA /ONGSH ); and (D) 7.5 ppm (OFFGABA /OFFGSH ). Phantom HERMES and 1D J-resolved experiments of Glu were performed. Finally, in vivo HERMES (20-ms editing pulses) and 1D J-resolved (TE 31-229 ms) experiments were performed on 137 participants using 3 T MRI scanners. LCModel was used for quantification.
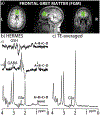
Results: HERMES simulation and phantom experiments show a Glu-edited signal at 2.34 ppm in the Hadamard sum combination A+B+C+D with no overlapping Gln signal. The J-resolved simulations and phantom experiments show substantial TE modulation of the Glu and Gln signals across the TEs, whose average yields a well-resolved Glu signal closely matching the Glu-edited signal from the HERMES sum spectrum. In vivo quantification of Glu show that the two methods are highly correlated (p < 0.001) with a bias of ∼10%, along with similar between-subject coefficients of variation (HERMES/TE-averaged: ∼7.3%/∼6.9%). Other Hadamard combinations produce the expected GABA-edited (A+B-C-D) or GSH-edited (A-B+C-D) signal.
Conclusion: HERMES simulation and phantom experiments show the separation of Glu from Gln. In vivo HERMES experiments yield Glu (without Gln), GABA, and GSH in a single MRS scan.
Keywords: GABA; HERMES; J-difference; glutamate; glutathione.
© 2023 International Society for Magnetic Resonance in Medicine.
Figures


References
-
- Meldrum BS. Glutamate as a neurotransmitter in the brain: review of physiology and pathology. The Journal of nutrition. 2000;130(4):1007S–15S. - PubMed
-
- Mayer D, Spielman DM. Detection of glutamate in the human brain at 3 T using optimized constant time point resolved spectroscopy. Magn Reson Med. 2005;54(2):439–42. - PubMed
-
- Mullins PG, Chen H, Xu J, Caprihan A, Gasparovic C. Comparative reliability of proton spectroscopy techniques designed to improve detection of J-coupled metabolites. Magn Reson Med. 2008;60(4):964–9. - PubMed
MeSH terms
Substances
Grants and funding
- P41 EB031771/EB/NIBIB NIH HHS/United States
- R01EB023963/GF/NIH HHS/United States
- U01DA041117/GF/NIH HHS/United States
- R01EB016089/GF/NIH HHS/United States
- R01 EB023963/EB/NIBIB NIH HHS/United States
- P50 HD103538/HD/NICHD NIH HHS/United States
- U01 DA041117/DA/NIDA NIH HHS/United States
- R21DA047673/GF/NIH HHS/United States
- R00DA051315/GF/NIH HHS/United States
- R01 EB016089/EB/NIBIB NIH HHS/United States
- R21 DA047673/DA/NIDA NIH HHS/United States
- P41EB031771/GF/NIH HHS/United States
- R21 AT010736/AT/NCCIH NIH HHS/United States
- P50 HD105354/HD/NICHD NIH HHS/United States
- U01 DA041134/DA/NIDA NIH HHS/United States
- K99 DA051315/DA/NIDA NIH HHS/United States
- U01DA041134/GF/NIH HHS/United States
- R00 DA051315/DA/NIDA NIH HHS/United States
LinkOut - more resources
Full Text Sources
Medical
Miscellaneous

