. 2023 Dec;13(12):4785-4800.
doi: 10.1016/j.apsb.2023.09.012. Epub 2023 Sep 22.

Macrophage LMO7 deficiency facilitates inflammatory injury via metabolic-epigenetic reprogramming

Affiliations

Macrophage LMO7 deficiency facilitates inflammatory injury via metabolic-epigenetic reprogramming

Shixin Duan et al. Acta Pharm Sin B. 2023 Dec.

Abstract

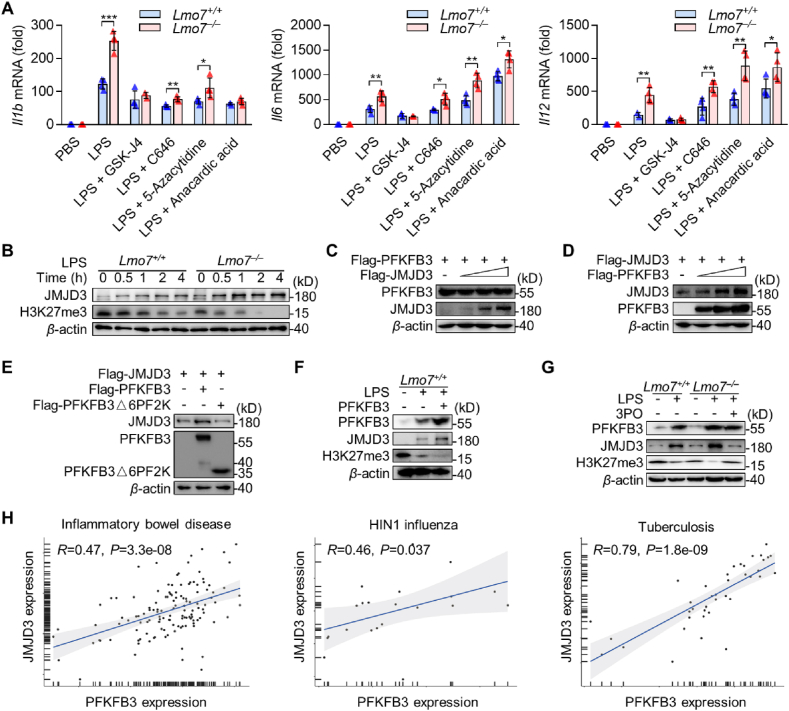
Inflammatory bowel disease (IBD) is a formidable disease due to its complex pathogenesis. Macrophages, as a major immune cell population in IBD, are crucial for gut homeostasis. However, it is still unveiled how macrophages modulate IBD. Here, we found that LIM domain only 7 (LMO7) was downregulated in pro-inflammatory macrophages, and that LMO7 directly degraded 6-phosphofructo-2-kinase/fructose-2,6-bisphosphatase 3 (PFKFB3) through K48-mediated ubiquitination in macrophages. As an enzyme that regulates glycolysis, PFKFB3 degradation led to the glycolytic process inhibition in macrophages, which in turn inhibited macrophage activation and ultimately attenuated murine colitis. Moreover, we demonstrated that PFKFB3 was required for histone demethylase Jumonji domain-containing protein 3 (JMJD3) expression, thereby inhibiting the protein level of trimethylation of histone H3 on lysine 27 (H3K27me3). Overall, our results indicated the LMO7/PFKFB3/JMJD3 axis is essential for modulating macrophage function and IBD pathogenesis. Targeting LMO7 or macrophage metabolism could potentially be an effective strategy for treating inflammatory diseases.

Keywords: Inflammatory bowel disease; JMJD3; LMO7; Macrophage; PFKFB3; Ubiquitination.


Conflict of interest statement

The authors declare that they have no competing financial interests.

Figures

Image 1
Graphical abstract
Figure 1
Figure 1
LMO7 is downregulated on infections and inhibits inflammatory responses in macrophages. (A) Venn diagram of the overlap of down-regulated genes in H1N1 influenza, tuberculosis, and inflammatory bowel disease. (B) Confocal microscopy imaging of BMDMs and HeLa cells expressing LMO7 (red) with antibodies to the appropriate protein, along with DAPI, respectively. Merge, LMO7 + DAPI. (C) qRT-PCR analysis of Lmo7 mRNA levels in Lmo7+/+ BMDMs under E. coli (MOI = 4) stimulation at various time points. (D) Immunoblot analysis of LMO7 in whole cell lysates of Lmo7+/+ BMDMs stimulated with E. coli (MOI = 4) at various time points. (E) Heatmap summarizing the expression of selected signature genes in BMDMs treated with E. coli (MOI = 4) for 6 h compared to the control using qRT-PCR. (F) Flow cytometry of EdU in BMDMs with or without E. coli stimulation. (G) The number of macrophages after stimulating bone marrow cells with M-CSF (10 ng/mL) for 6 days. (H) Flow cytometry of phagocytic macrophages with or without E. coli-GFP incubation. Data shown are presented as mean ± SD from one representative of three independent experiments (B–H). ∗∗P < 0.01; ∗∗∗P < 0.001.
Figure 2
Figure 2
LMO7 negatively regulates pro-inflammatory macrophage polarization. (A) qRT-PCR analysis of Lmo7 mRNA levels in Lmo7+/+ BMDMs under LPS (100 ng/mL) stimulation at various time points. (B) Immunoblot analysis of LMO7 in whole cell lysates of Lmo7+/+ or Lmo7−/− BMDMs stimulated with LPS (100 ng/mL) at various time points. (C) Heatmap summarizing the expression of selected signature genes in BMDMs treated with LPS (100 ng/mL) for 6 h compared to the control using qRT-PCR. (D) qRT-PCR analysis of selected signature genes in BMDMs under IL-4 (10 ng/mL) or IL-13 (10 ng/mL) stimulation for 6 h. (E) ELISA analysis of IL-1β, IL-6, and TNF-α production in supernatants of BMDMs infected with LPS (100 ng/mL) for 12 h. (F) The NO level was detected in BMDMs treated with LPS (100 ng/mL) for 24 h. (G) Flow cytometry of macrophage surface markers CD80, CD86 and MHC-II expression in BMDMs with LPS (100 ng/mL) stimulation for 12 h. (H) Immunoblot analysis of indicated protein in cell lysates of BMDMs infected with LPS (100 ng/mL). (I) Heatmap summarizing the expression of selected protein in BMDMs treated with LPS (100 ng/mL) compared to the control using immunoblot analysis. Data shown are presented as mean ± SD from one representative of three independent experiments (A–I). ∗P < 0.05; ∗∗P < 0.01; ∗∗∗P < 0.001.
Figure 3
Figure 3
LMO7 inhibits BMDM glycolysis via suppressing PFKFB3. (A) Lmo7+/+ and Lmo7−/− BMDMs were detected for extracellular acidification rate (ECAR) as an indicator for deduced glycolysis flux and glycolytic capacity. (B) The glycolysis flux and glycolytic capacity of BMDMs treated with or without LPS were analyzed. (C) The ATP, PA, and LA levels were detected in BMDMs treated with LPS (100 ng/mL) for 4 h. (D) HEK293T cells were transfected with Flag-PFKFB3 and different amounts of HA-LMO7, along with or without MG132. Cell lysates were used to detect the expression of indicated protein. (E) Immunoblot analysis of PFKFB3 protein expression in cell lysates of BMDMs infected with LPS (100 ng/mL) at various time points. (F) The PA level was detected in BMDMs treated with LPS (100 ng/mL) or LPS + 3PO, respectively. (G) Heatmap summarizing the expression of selected signature genes in BMDMs treated with LPS (100 ng/mL) or LPS + 3PO using qRT-PCR. Data shown are presented as mean ± SD from one representative of three independent experiments (A–G). ∗∗P < 0.01; ∗∗∗P < 0.001.
Figure 4
Figure 4
LMO7 interacts with PFKFB3 and promotes the degradation and K48-linked polyubiquitination of PFKFB3. (A) Immunoprecipitation (IP) and immunoblot (IB) analysis of lysates of HEK293T cells transfected with various combinations (upper lanes) of plasmids encoding Flag-PFKFB3 and HA-LMO7. WCL, whole-cell lysate. (B) Immunoprecipitation and immunoblot analysis of BMDMs stimulated with LPS (100 ng/mL). (C) Confocal microscopy imaging of BMDMs stimulated with LPS (100 ng/mL) and labeled with antibodies for PFKFB3 (green), LMO7 (red), and DAPI, respectively. Merge, LMO7 + PFKFB3 + DAPI. Scale bar: 10 μm. (D) Immunoprecipitation and immunoblot analysis of lysates of HEK293T cells transfected with HA-LMO7, plus Flag-PFKFB3 or Flag-PFKFB3 mutants (PFKFB3Δ6PF2K, PFKFB3ΔPhos, or PFKFB3ΔNLS). (E) Immunoprecipitation and immunoblot analysis of HEK293T cells transfected with Flag-PFKFB3, plus HA-LMO7, or HA-LMO7 mutants (LMO7-LIM, LMO7-F-box, or LMO7-PDZ). (F) HEK293T cells were transfected with Myc-LMO7 and Flag-PFKFB3, along with HA-UB or its mutants (K6, K11, K27, K29, K33, K48, K63). Cell lysates were subjected to immunoprecipitation by the anti-Flag Ab, and then immunoblotted with the indicated antibodies. (G) Immunoprecipitation and immunoblot analysis of ubiquitination of LMO7 in HEK293T cells co-transfected with Myc-LMO7, HA-UB, along with Flag-PFKFB3, Flag-PFKFB3Δ6PF2K, Flag-PFKFB3ΔPhos, or Flag-PFKFB3ΔNLS. (H) HEK293T cells were transfected with Myc-LMO7 and Flag-PFKFB3, along with HA-UB or its mutant K48R. Cell lysates were subjected to immunoprecipitation by the anti-Flag Ab, and then immunoblotted with the indicated antibodies. (I) Immunoprecipitation and immunoblot analysis of ubiquitination of PFKFB3 in BMDMs stimulated with LPS (100 ng/mL) for 2 h. (J) Immunoprecipitation and immunoblot analysis of ubiquitination of PFKFB3 in HEK293T cells co-transfected with Flag-PFKFB3, Myc-UB, along with HA-LMO7, HA-LMO7-LIM, HA-LMO7-F-box, or HA-LMO7-PDZ. (K) Flag-PFKFB3 or its mutants (K276R, K277R, K284R, K292R, K302R, K319R, K352R, K402R, K411R, and K419R) were individually transfected into HEK293T cells, along with Myc-LMO7 and HA-UB. Cell lysates were subjected to immunoprecipitation by the anti-Flag Ab, and then immunoblotted with the indicated antibodies. (L) Immunoblot analysis of HEK293T cells transfected with Flag-PFKFB3 (K402R) with different amounts of HA-LMO7. Data shown are representative of three independent experiments (A–L).
Figure 5
Figure 5
PFKFB3 aggravates macrophage inflammation through promoting JMJD3 expression. (A) qRT-PCR analysis Il1b, Il6 and Il12 mRNA levels in Lmo7+/+ or Lmo7−/− BMDMs under LPS with or without multiple epigenetic-related enzyme inhibitors stimulation for 6 h. (B) Immunoblot analysis of JMJD3 and H3K27me3 protein expression in cell lysates of BMDMs infected with LPS at various time points. (C) Immunoblot analysis of HEK293T cells were transfected with Flag-PFKFB3 and increased volumes of Flag-JMJD3. (D) Immunoblot analysis of HEK293T cells were transfected with Flag-JMJD3 and increased volumes of Flag-PFKFB3. (E) Immunoblot analysis of HEK293T cells were transfected with Flag-JMJD3, Flag-PFKFB3, or its mutant Flag-PFKFB3△6PF2K. (F) Immunoblot analysis of PFKFB3, JMJD3, and H3K27me3 expression in BMDMs which overexpressed PFKFB3 and had been infected with LPS, or in BMDMs without any challenge. (G) Immunoblot analysis of PFKFB3, JMJD3, and H3K27me3 expression in BMDMs infected with LPS or LPS + 3PO. (H) Correlation between level of JMJD3 expression and PFKFB3 expression in Inflammatory bowel disease (GSE3365), H1N1 influenza (GSE27131), and Tuberculosis (GSE54992). Statistical analyses were calculated using Spearman's correlation. Data shown are presented as mean ± SD from one representative of three independent experiments (A–G). ∗P < 0.05; ∗∗P < 0.01; ∗∗∗P < 0.001.
Figure 6
Figure 6
LMO7 deficiency in macrophages aggravates DSS colitis. (A) Survival rate, (B) body gain ratio, (C) and disease activity index of Lmo7fl/fl and LysMCreLmo7fl/fl mice after modeling with 3% DSS. (D–E) Photos and statistical plots of the length of mice colon tissues. (F) MPO content in mice colon tissues. (G) Heatmap summarizing the expression of selected signature genes in mice colon tissues using qRT-PCR. (H) H&E staining of mice colon tissues. Scale bars: 200 μm. (I) Crypt number of each mouse colonic section according to H&E staining results. (J) Flow cytometry analysis of macrophages (CD45+CD11b+F4/80+) and neutrophils (CD45+Gr1+) in mice colon tissues. Each symbol represents an individual mouse (E‒F, and I‒J). Data shown are presented as mean ± SD from one representative of three independent experiments. ∗P < 0.05; ∗∗P < 0.01; ∗∗∗P < 0.001.
Figure 7
Figure 7
Inhibition of JMJD3 and PFKFB3 effectively alleviates intestinal inflammation in myeloid-specific LMO7 deficiency mice. (A) Immunoblot analysis of PFKFB3, JMJD3, and H3K27me3 protein expression in mice colon tissues. (B) Body gain ratio, (C) disease activity index, (D) and colon length of Lmo7fl/fl and LysMCreLmo7fl/fl mice after modeling with 3% DSS, 3% DSS+3PO or 3% DSS + GSK-J4, respectively. (E) Crypt number of each mouse colonic section according to H&E staining results. (F) H&E staining of mice colon tissues. Scale bars: 200 μm. (G) The proportion of macrophages in colon tissues of mice. (H) PA content of mice serum. (I) Immunoblot analysis of PFKFB3, JMJD3, and H3K27me3 protein expression in mice colon tissues. Each symbol represents an individual mouse (B‒E, and G‒H). Data shown are presented as mean ± SD from one representative of three independent experiments. ∗P < 0.05; ∗∗P < 0.01; ∗∗∗P < 0.001.
Figure 8
Figure 8
An abridged general view of the role of LMO7 in macrophage. LMO7 is downregulated in pro-inflammatory macrophages after LPS stimulation, and it degrades PFKFB3 through K48-mediated ubiquitination. The degradation of PFKFB3 leads to the glycolytic process inhibition in macrophages, thus suppressing the expression of JMJD3, thereby promoting H3K27me3 and further regulating macrophage polarization.

References

    1. Du G., Qin M., Sun X. Recent progress in application of nanovaccines for enhancing mucosal immune responses. Acta Pharm Sin B. 2023;13:2334–2345. - PMC - PubMed
    1. Bisgaard T.H., Allin K.H., Keefer L., Ananthakrishnan A.N., Jess T. Depression and anxiety in inflammatory bowel disease: epidemiology, mechanisms and treatment. Nat Rev Gastroenterol Hepatol. 2022;19:717–726. - PubMed
    1. Hegarty L.M., Jones G.R., Bain C.C. Macrophages in intestinal homeostasis and inflammatory bowel disease. Nat Rev Gastroenterol Hepatol. 2023;20:538–553. - PubMed
    1. Delfini M., Stakenborg N., Viola M.F., Boeckxstaens G. Macrophages in the gut: masters in multitasking. Immunity. 2022;55:1530–1548. - PubMed
    1. Arora S., Dev K., Agarwal B., Das P., Syed M.A. Macrophages: their role, activation and polarization in pulmonary diseases. Immunobiology. 2018;223:383–396. - PMC - PubMed