[Preprint]. 2023 Nov 21:2023.11.21.568007.
doi: 10.1101/2023.11.21.568007.

Longitudinal analysis of innate immune system in infants with perinatal HIV infection until 18 months of age

Affiliations

Longitudinal analysis of innate immune system in infants with perinatal HIV infection until 18 months of age

Vinh Dinh et al. bioRxiv. .

Abstract

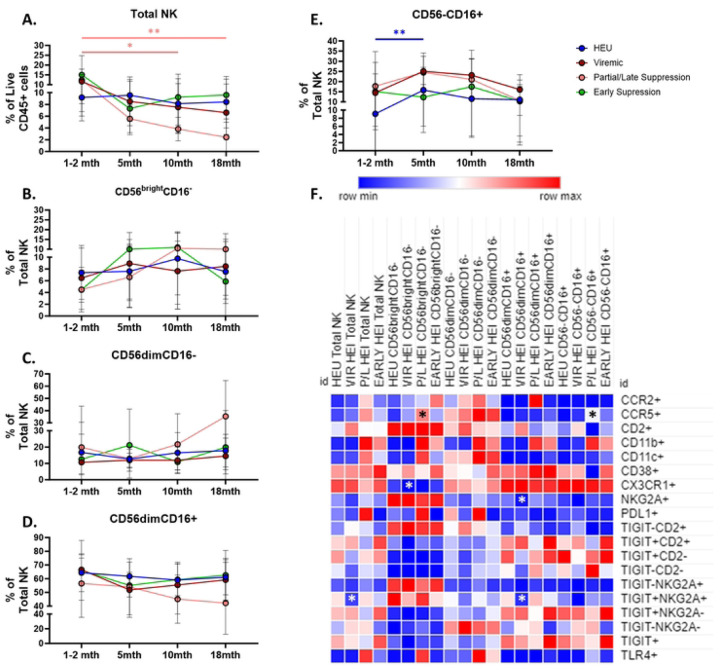
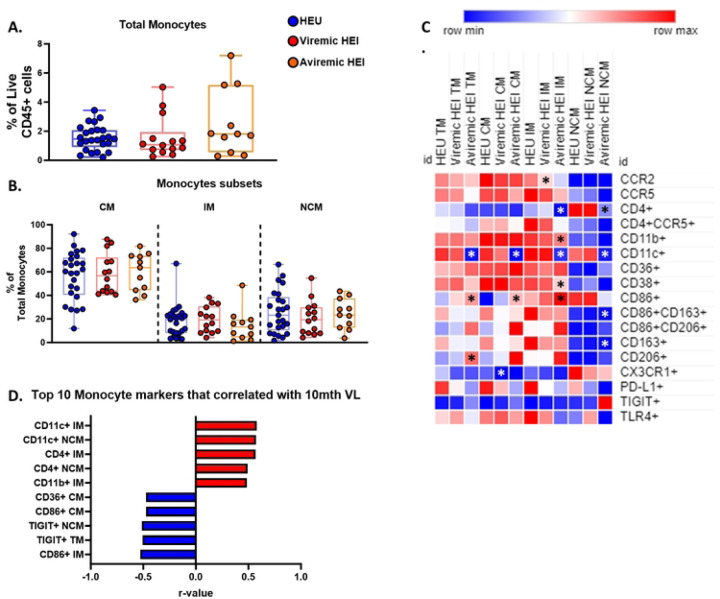
With the advent of antiretroviral therapy (ART), perinatal HIV infection is declining globally but prevalence in Sub-Saharan Africa is still greater than other nations. The relationship of HIV replication in early infancy and the developing immune system is not well understood. In this study, we investigated cellular components of the innate immune system including Natural Killer (NK) cells, monocytes, and Dendritic Cells (DC) in a cohort of HIV exposed infected (HEI) and age-matched HIV exposed uninfected (HEU) infants from Mozambique. Study entry was at the first visit after delivery at age 1-2 months for HIV diagnosis and initiation of ART. Phenotypic analysis by multi-parameter flow cytometry revealed an expansion of total NK cells and the dysfunctional, CD56-CD16+, NK cell subset; increased activation in monocytes and DC; and higher levels of inflammatory homing receptor CCR5 on circulating DC subsets in the HEI infants. NKG2A, an inhibitory receptor for NK cytolytic function, was reduced in HEI compared to HEU and positively correlated with pre-ART viral load (VL) while expression of CCR2, the inflammatory homing receptor, on NK was negatively correlated with VL. Other subsets exhibited positive correlations with VL including the frequency of intermediate monocytes amongst total monocytes. Longitudinal analysis of VL indicated suboptimal ART adherence in HEI. Regardless of level of viral suppression achieved, the frequencies of specific innate immune subsets in HEI were normalized to HEU by 18m. These data support the notion that in early life, NK cells play a role in virus control and should be explored for functional attributes that are effective against HIV at this time during development. Overall, our study provides high resolution overview of the innate immune system during perinatal HIV infection.


Figures

Figure 1:
Figure 1:. HEI infants have enriched NK cell subset frequencies with immune activation at pre-ART compared to age matched HEU that correlated with plasma viral load.
A) Pre-ART VL of HIV-exposed infected infant (N=31) B) Frequency of NK cells as a percentage of live CD45+ cells in HIV-exposed uninfected (HEU, blue circles, N=31) and HIV-exposed infected (HEI, red circles, N=29). C) Frequencies of NK cell subsets based on CD56 and CD16 expression as a percentage of Total NK cells for both HEU and HEI. D) Heatmap generated using average frequency of each marker for each respective NK subset in HEU and HEI without any normalization. The color gradient of the heatmap represents the average frequency of a marker between subsets with blue being the lowest frequency and red being the highest frequency. T-test comparisons were done between study groups for each marker within a row. Any significant difference for a specific marker of each subset between study groups was marked with an asterisk on the heatmap. E) Top 10 most significant NK cell parameters that correlated with Pre-ART VL based on lowest p-value from the Spearman Correlation and r-values of each of these correlations is plotted across the x-axis. F-G) Target Cell Death and Total CD107a of NK cells when co-cultured with K562 target cells. H-I) Target Cell Death and Total CD107a of NK cells when co-cultured with HUT78 target cells.
Figure 2:
Figure 2:. HEI infants maintain an enriched CD56-CD16+ subset and elevated immune activation at 10 months of age compared to age matched HEU that correlated with plasma viral load.
A) HEI infant were split in to 2 groups at 10 months of age based on their 10-month VL. Viremic infants were defined by having a viral load above 200 copies/mL (N=15) and Aviremic infants were defined by having a viral load below 200 copies/mL (N=11). B) Frequency of NK cells as a percentage of live CD45+ cells in HEU (Blue circles, N=26), Viremic HEI (Red circles, N=15), and Aviremic HEI (Orange circles, N=11). C) Frequencies of NK cell subsets based on CD56 and CD16 expression as a percentage of Total NK cells for HEU, Viremic HEI, and Aviremic HEI. D) Heatmap generated using average frequency of each marker for each respective NK subset in HEU and HEI without any normalization. The color gradient of the heatmap represents the average frequency of a marker between subsets with blue being the lowest frequency and red being the highest frequency. T-test comparisons were done between study groups for each marker within a row. Any significant difference for a specific marker of each subset between HEU and either Viremic or Aviremic HEI was marked with an asterisk on the heatmap. E) Top 10 most significant NK cell parameters that correlated with 10-mth VL based on lowest p-value from the Spearman Correlation and r-values of each of these correlations is plotted across the x-axis.
Figure 3:
Figure 3:. Regardless of viral trajectory, HEI show minimal differences in subset distribution and phenotype at 18 months of age compared to age matched HEU.
HEI infants were split by their plasma viral load trajectories as shown in Figure S3. A) Frequency of NK cells as a percentage of live CD45+ cells in HEU (Blue circles, N=26), Viremic (Dark Red circles, N=13), Partial/Late Suppressors (Pink Circles, N=10) and Early Suppressors (Green circles, N=10). B-E) Frequencies of NK cell subsets based on CD56 and CD16 expression as a percentage of Total NK cells for HEU, Viremic, Partial/Late suppressors and Early Suppressors. D) Heatmap generated using average frequency of each marker for each respective NK subset in HEU and HEI without any normalization. The color gradient of the heatmap represents the average frequency of a marker between subsets with blue being the lowest frequency and red being the highest frequency. T-test Comparison were done between study groups for each marker within a row. Any significant difference for a specific marker of each subset between HEU and any of the 3 HEI groups was marked with an asterisk on the heatmap.
Figure 4:
Figure 4:. Monocytes show increased activation when compared to age matched HEU at Pre-ART initiation and Intermediate monocytes correlated with pre-ART VL.
A-B) Total Monocytes as a frequency of Live CD45+ cells and frequency of Monocyte subsets as a percentage of Total Monocytes in HIV-exposed uninfected (HEU, blue circles, N=31) and HIV-exposed infected (HEI, red circles, N=29). C) Heatmap generated using average frequency of each marker for each respective Monocyte subset in HEU and HEI without any normalization. The color gradient of the heatmap represents the average frequency of a marker between subsets with blue being the lowest frequency and red being the highest frequency. T-test Comparison were done between study groups for each marker within a row. Any significant difference for a specific marker of each subset between study groups was marked with an asterisk on the heatmap. D) Top 10 Monocyte parameters that correlated with Pre-ART VL based on lowest p-value from the Spearman Correlation and r-values of each of these correlations is plotted across the x-axis.
Figure 5:
Figure 5:. Aviremic HEI at 10 months of age show phenotypic differences from HEU and Intermediate monocytes correlate with plasma VL. HEI infant were split in to 2 groups at 10 months of age based on their 10-month VL.
A-B) Total Monocytes as a frequency of Total CD45+ cells and frequency of Monocyte subsets as a percentage of Total Monocytes in HIV-exposed uninfected (HEU, blue circles, N=25), Viremic HIV-exposed infected (Viremic HEI, red circles, N=14), and Aviremic HIV-exposed infected (Aviremic HEI, Orange circles, N=11). C) Heatmap generated using average frequency of each marker for each respective Monocyte subset in HEU and HEI without any normalization. The color gradient of the heatmap represents the average frequency of a marker between subsets with blue being the lowest frequency and red being the highest frequency. T-test Comparison were done between study groups for each marker within a row. Any significant difference for a specific marker of each subset between HEU and either Viremic or Aviremic HEI was marked with an asterisk on the heatmap. D) Top 10 most significant Monocyte parameters that correlated with 10-month VL based on lowest p-value that from the Spearman Correlation and r-values of each of these correlations is plotted across the x-axis.
Figure 6:
Figure 6:. Regardless of viral trajectory, HEI show minimal differences in Monocyte subset distribution and phenotype at 18 months of age compared to age matched HEU.
HEI infants were split by their plasma viral load trajectories as shown in Figure S3. A-D) Total Monocytes as a frequency of Live CD45+ cells and frequency of Monocyte subsets as a percentage of Total Monocytes based on expression of CD14 and CD16 in HEU (Blue circles, N=26), Viremic (Dark Red circles, N=13), Partial/Late Suppressors (Pink Circles, N=10) and Early Suppressors (Green circles, N=10) plotted against age in months on the x-axis. D) Heatmap generated using average frequency of each marker for each respective Monocyte subset in HEU and HEI without any normalization. The color gradient of the heatmap represents the average frequency of a marker between subsets with blue being the lowest frequency and red being the highest frequency. T-test Comparison were done between study groups for each marker within a row. Any significant difference for a specific marker of each subset between HEU and any of the 3 HEI groups was marked with an asterisk on the heatmap.
Figure 7:
Figure 7:. Dendritic cells of HEI at pre-ART initiation show an altered phenotype compared to HEU and activation related markers correlate with plasma VL.
A-C) Frequency of Dendritic cells as a frequency of Live CD45+ cells, pDC and cDC as a percentage of Total Dendritic Cells, and cDC2 and cDC1 as a frequency of total cDC in HIV-exposed uninfected (HEU, blue circles, N=31) and HIV-exposed infected (HEI, red circles, N=29). D) Heatmap generated using average frequency of each marker for each respective Dendritic Cell subset in HEU and HEI without any normalization. The color gradient of the heatmap represents the average frequency of a marker between subsets with blue being the lowest frequency and red being the highest frequency. T-test Comparison were done between study groups for each marker within a row. Any significant difference for a specific marker of each subset between study groups was marked with an asterisk on the heatmap. E) Top 10 most significant Dendritic Cell parameters that correlated with Pre-ART VL based on lowest p-value that from the Spearman Correlation and r-values of each of these correlations is plotted across the x-axis.
Figure 8:
Figure 8:. Dendritic cells of Aviremic HEI at 10 months of age show an altered phenotype compared to HEU and activation related markers correlate with plasma VL. HEI infant were split in to 2 groups at 10 months of age based on their 10-month VL.
A-C) Frequency of Dendritic cells as a frequency of Live CD45+ cells, pDC and cDC as a percentage of Total Dendritic Cells, and cDC2 and cDC1 as a frequency of total cDC in HIV-exposed uninfected (HEU, blue circles, N=25), Viremic HIV-exposed infected (Viremic HEI, red circles, N=14), and Aviremic HIV-exposed infected (Aviremic HEI, red circles, N=11). D) Heatmap generated using average frequency of each marker for each respective Dendritic Cell subset in HEU and HEI without any normalization. The color gradient of the heatmap represents the average frequency of a marker between subsets with blue being the lowest frequency and red being the highest frequency. T-test Comparison were done between study groups for each marker within a row. Any significant difference for a specific marker of each subset between HEU and either Viremic or Aviremic HEI was marked with an asterisk on the heatmap. E) Top 10 most significant Dendritic Cell parameters that correlated with 10-month VL based on lowest p-value that from the Spearman Correlation and r-values of each of these correlations is plotted across the x-axis.
Figure 9:
Figure 9:. Regardless of viral trajectory, HEI show minimal differences in Dendritic Cell subset distribution and phenotype at 18 months of age compared to age matched HEU.
HEI infants were split by their plasma viral load trajectories as shown in Figure S3. A) Frequency of Total Dendritic Cells (DC) as a percentage of Live CD45+ Cells in HEU (Blue circles, N=26), Viremic (Dark Red circles, N=13), Partial/Late Suppressors (Pink Circles, N=10) and Early Suppressors (Green circles, N=10) plotted against age in months on the x-axis. B-C) Frequency of Total pDC and cDC as a percentage Total DC in HEU, Viremic, Partial/Late Suppressors, and Early Suppressors plotted against age in months on the x-axis. D-E) Frequency of cDC1 and cDC2 as a percentage of Total cDC in HEU, Viremic, Partial/Late Suppressors, and Early Suppressors plotted against age in months on the x-axis. F) Heatmap generated using average frequency of each marker for each respective Dendritic Cell subset in HEU and HEI without any normalization. The color gradient of the heatmap represents the average frequency of a marker between subsets with blue being the lowest frequency and red being the highest frequency. T-test Comparison were done between study groups for each marker within a row. Any significant difference for a specific marker of each subset between HEU and any of the 3 HEI groups was marked with an asterisk on the heatmap.

References

    1. UNAIDS, Global HIV & AIDS statistics — Fact sheet. 2023.
    1. Violari A., et al. , A child with perinatal HIV infection and long-term sustained virological control following antiretroviral treatment cessation. Nat Commun, 2019. 10(1): p. 412. - PMC - PubMed
    1. Frange P., et al. , HIV-1 virological remission lasting more than 12 years after interruption of early antiretroviral therapy in a perinatally infected teenager enrolled in the French ANRS EPF-CO10 paediatric cohort: a case report. Lancet HIV, 2016. 3(1): p. e49–54. - PubMed
    1. Saez-Cirion A., et al. , Post-treatment HIV-1 controllers with a long-term virological remission after the interruption of early initiated antiretroviral therapy ANRS VISCONTI Study. PLoS Pathog, 2013. 9(3): p. e1003211. - PMC - PubMed
    1. Payne H., et al. , Early ART-initiation and longer ART duration reduces HIV-1 proviral DNA levels in children from the CHER trial. AIDS Research and Therapy, 2021. 18(1): p. 63. - PMC - PubMed

Publication types