[Preprint]. 2023 Dec 12:2023.11.22.568319.
doi: 10.1101/2023.11.22.568319.

An arginine-rich nuclear localization signal (ArgiNLS) strategy for streamlined image segmentation of single-cells

Affiliations

An arginine-rich nuclear localization signal (ArgiNLS) strategy for streamlined image segmentation of single-cells

Eric R Szelenyi et al. bioRxiv. .

Update in

Abstract

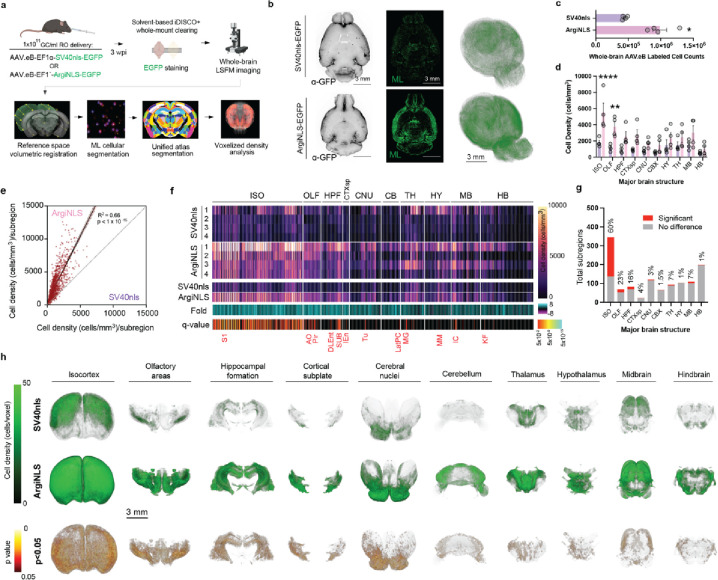
High-throughput volumetric fluorescent microscopy pipelines can spatially integrate whole-brain structure and function at the foundational level of single-cells. However, conventional fluorescent protein (FP) modifications used to discriminate single-cells possess limited efficacy or are detrimental to cellular health. Here, we introduce a synthetic and non-deleterious nuclear localization signal (NLS) tag strategy, called 'Arginine-rich NLS' (ArgiNLS), that optimizes genetic labeling and downstream image segmentation of single-cells by restricting FP localization near-exclusively in the nucleus through a poly-arginine mechanism. A single N-terminal ArgiNLS tag provides modular nuclear restriction consistently across spectrally separate FP variants. ArgiNLS performance in vivo displays functional conservation across major cortical cell classes, and in response to both local and systemic brain wide AAV administration. Crucially, the high signal-to-noise ratio afforded by ArgiNLS enhances ML-automated segmentation of single-cells due to rapid classifier training and enrichment of labeled cell detection within 2D brain sections or 3D volumetric whole-brain image datasets, derived from both staining-amplified and native signal. This genetic strategy provides a simple and flexible basis for precise image segmentation of genetically labeled single-cells at scale and paired with behavioral procedures.

Keywords: NLS; segmentation; single-cell; volumetric; whole-brain.


Conflict of interest statement

Competing Interest Statement: E.R.S. and S.A.G. are inventors of a provisional patent related to ArgiNLS genetic technology (W149–0052USP1/49409.01US1). All other authors have no competing interests.

Figures

Figure 1.
Figure 1.. Strategy and in vitro characterization of an ariginine-rich NLS (ArgiNLS).
a, Schematic depicting extracellular signal caused by classical NLS (cNLS) tag use, and depicting the theoretical effects of an optimized NLS tag that eliminates extra-nuclear signal artifact through a subnuclear enrichment strategy. b, Top: Configuration of cNLS, poly-arginine nucleolar enrichment tag, and EGFP in AAV overexpression vectors created for in vitro testing. Bottom: Corresponding amino acid composition of mono- or bipartite cNLS consensus sequences followed by poly-R stretch separating the coding sequence (CDS) of EGFP (first 10 amino acids shown). c, Amino acid sequences of SV40nls- and NPM2nls-poly-R tags. Basic amino acids are indicated in bold. d, Heat maps of isoelectric point (pI) and net positive charge (z) of each tag configuration. e, Representative images of transiently co-transfected single N2A cells displaying untagged mKate2 and SV40nls-poly-R (top) or NPM2nls-poly-R (bottom) tagged EGFP expression, spanning 3 to 11 R. f, Percent nuclear localization of each NLS across poly-R lengths (n=5/condition). g, Nuclear fluorescence intensity (a.u. = arbitrary units) across poly-R lengths for each NLS from same cells measured in f. h, Representative images of transient co-transfections with untagged mKate2 and each experimental EGFP-expressing construct within immortalized CLU198 embryonic hippocampal mouse cell line. i, Percent nuclear localization with/without R7 addition for each cNLS. j, Molecular schematic of ArgiNLS tag (NPM2nls-R7) and amino acid sequence comparison and consensus of the first 10 N-terminal residues to EGFP, oScarlet, mKate2, and miRFP670. k, Representative images of transient co-transfections with (from L to R and top to bottom) ArgiNLS-EGFP/mKate2, ArgiNLS-oScarlet/EGFP, ArgiNLS-mKate2/EGFP, and ArgiNLS-miRFP670/EGFP combinations within N2A mouse cell line. l, Percent nuclear localization of ArgiNLS-tagged FPs. i and l cell culture summary data is from 5 blinded and randomly selected cells quantified per transfection condition across 3 replicate cultures. The data in f was statistically analyzed using a two-way ANOVA followed by Holm-Sidak’s multiple comparison post hoc test. The data in g was statistically analyzed using a two-way ANOVA followed by Holm-Sidak’s multiple comparison post hoc tests for effects of poly-R length both within and across each cNLS. The data in l was statistically analyzed using a two-way (NLS (3) x +/− R7 (2)) ANOVA followed by Sidak post hoc test. *p<0.05; **p<0.01; ***p<0.005
Figure 2.
Figure 2.. Optimized nuclear localization of fluorescence across major cortical cell-type classes in vivo.
a, Schematic of stereotaxic AAV co-injection in the barrel field of primary somatosensory cortex (SSpBF) of vGat-Cre or vGlut1-Cre transgenic mice. b-c, Representative 40x confocal images of SV40nls-EGFP/FLEX-tdTomato and ArgiNLS-EGFP/ FLEX-tdTomato viral expression in (b) vGat-Cre or (c) vGlut1-Cre mice. Right: Cropped representative image of an example EGFP+/tdTomato+ cell. d-h, Quantification of NLS tag performance in GABAergic (top) or glutamatergic (bottom) EGFP+/tdTomato+ cells (n=random 5 cells/animal; n=3 animals per Cre-driver/tag). d, EGFP corrected total nuclear fluorescence (CTNF). e, Cellular frequency histogram of percent nuclear EGFP localization. f, Percent nuclear EGFP fluorescence comparison across tags. g-h, Nuclear and extra-nuclear EGFP fluorescence for all quantified cells of each animal across (g) SV40nls- or (h) ArgiNLS-labeled cells. The composite percent nuclear EGFP across all animals is indicated to the right. i, Total pixel intensity of extracellular (EC) EGFP signal ipsilateral to injection site, expressed as a fold change from non-injected contralateral side (n=3 EC quantifications/3 vGlut1-Cre mice). j, Representative images of extranuclear EGFP signal in axon bundles of passage in the corpus callosum (CC; top) or terminations in the dorsal thalamus (dTH; bottom). Arrows indicate location of labeling observed with SV40nls and are superimposed on ArgiNLS-EGFP. k, Representative 40x confocal images of SV40nls- or ArgiNLS-EGFP with vGlut1:tdTomato viral expression in fibers of the CC (n=3 EC quantifications/3 vGlut1-Cre mice). l, Quantification of EGFP+ fiber area in CC normalized to vGlut1:tdTomato+ fiber area. All bar graphs represent mean ± SEM. The data in d, f, and l was statistically analyzed using an unpaired t-test. Group differences in population variance of data in e were statistically compared using an F-test. The data in i was statistically analyzed using a 1-way ANOVA followed by Tukey’s multiple comparison post hoc test. Violin plots display median and interquartile range as dashed lines. *p<0.01; **p<0.05; **p<0.01; ****p<0.001
Figure 3.
Figure 3.. ArgiNLS-EGFP viral expression is not associated with physiological or behavioral deficits.
a, Schematic illustration of bilateral stereotaxic AAV injection/co-injection in barrel cortices (SSpBF) of vGlut1-Cre transgenic mice, and electrophysiological recordings conducted on resulting vGlut1-Cre:tdTomato(+) neurons that are either ArgiNLS-EGFP(−) or ArgiNLS-EGFP(+). b, Resting membrane potential of ArgiNLS-EGFP(−) (n=13) or ArgiNLS-EGFP(+) (n=12) neurons. c, Current injection curve from ArgiNLS-EGFP(−) or ArgiNLS-EGFP(+) neurons. d, Example trace current injection at 100 pA. e, AAV.eB delivery and vector information schematic. Groups of mice were injected with 1 × 10¹¹ GC of a negative control AAV.eB-CAG-FLEX-tdTomato (n=11), AAV.eB-EF1a-H2B-EGFP (n=8), AAV.eB-EF1a-SV40nls-EGFP (n=11), or AAV.eB-EF1a-ArgiNLS-EGFP (n=11). f, Baseline behavioral battery 4 weeks post viral injection (wpi). Mice were sequentially tested in the open field test (OFT), elevated plus maze (EPM), and 60-hour night/dark locomotion recording. g, Total distance traveled in the OFT. h, Percent time duration spent in the center of the OFT arena. i, Frequency of entries in the open arm of the EPM. j, Total duration of time spent in the open arm of the EPM. k, Locomotion XY plot showing total distance traveled across time of the 60-h recording. Day (yellow)/night (gray) phase of light cycle is underlaid the plot according to time of 60-h recording. l, Mean night distance traveled across the 60-h recording period. m, Mean day distance traveled across the 60-h recording period. All bar graphs represent mean ± SEM. The data for each panel from g-j and l-m were statistically analyzed using an one-way ANOVA with Dunnet’s multiple comparison posthoc test of each experimental group versus control FLEX-tdTomato group. ****p<0.0001
Figure 4.
Figure 4.. Enhanced performance of single-cell ML classification.
a, Experimental schematic of systemic AAV.eB delivery of NLS-tagged EGFP. b, Microscopy acquisition schematic. c-d, Representative images of EGFP viral expression at matching (c) AP 2.11 or (d) −0.52 hemispheric coronal planes, across 2 FOVs at 3 magnification levels. e, Schematic of SV40nls and ArgiNLS classifier training workflow for single-cell segmentation of 2D images. f-h, Cell segmentation classifier benchmarking and performance metrics for (left) AP: 2.11 and (right) AP: −0.52 brain sections. Total cell detections for (f) SV40nls-EGFP or (g) ArgiNLS-EGFP for expert rater ground truth (GT; left bar) (n=3) and ML classifier across iterations of 2-increment additive training input rounds. Gray bars represent iterations after peak performance criteria was met. Dashed line indicates mean GT cell detections. h, Precision, recall, and F1 harmonic scoring of single-cell detection for SV40nls-EGFP and ArgiNLS-EGFP. Gray data points represent iterations after max F1 performance was met. All bar graphs represent mean ± SEM. The F1 data in h was statistically analyzed using a two-way repeated measures ANOVA followed by Holm-Sidak’s post hoc test. *p<0.05; **p<0.01; **p<0.01; ****p<0.001
Figure 5.
Figure 5.. Enriched brain-wide segmentation of single-cells.
a, Schematic of experimental and image processing workflow used to quantify systemic SV40nls- or ArgiNLS-EGFP-labeled cells across the whole mouse brain. b, Left: Raw LSFM image in horizontal orientation from a representative SV40nls-EGFP (top) or ArgiNLS-EGFP (bottom) expressing brain sample. Middle: corresponding ML-segmented cells within the same optical section. Right: Whole-brain 3D-renderings of voxelized cell density for each sample. c, Comparison of whole-brain AAV.eB-labeled cell counts. d, Comparison of cell density across major ontological brain structures. e, Scatterplot and linear regression of ArgiNLS (Y-axis) versus SV40nls (X-axis)-labeled mean cell density across all subdivisions of the brain. f, 2D heatmap plot of (from top to bottom): cell density across each individual sample, mean cell density, fold change over ArgiNLS, and statistical significance of mean cell density differences across all anatomical subdivisions by structure order. Major ontological brain structure positioning is indicated with white lines and written above. Example statistically significant subdivisions are listed in red. g, Bar graph of total statistically significant subdivisions versus no difference plotted for each major brain structure. Percent significant subregions is listed above each bar. h, Volumetric renderings of mean SV40nls-EGFP or ArgiNLS-EGFP voxelized cell densities (top) and the statistically significant voxels of the mean differences (bottom) across all major brain structures. All bar graphs represent mean ± SEM. The data for panel c was statistically analyzed using an unpaired Student’s t-test. The data for panel d was statistically analyzed using a two-way ANOVA with Bonferroni post-hoc test for mean significant differences at each major region. The data for panel e was analyzed with linear regression. The data for panel f was analyzed with FDR-corrected multiple t-tests using the two-stage step-up method of Benjamini, Krieger, and Yekutieli. *p<0.05; **p<0.01. Acronyms: ISO = isocortex; OLF = olfactory areas; HPF = hippocampal formation; CTXsp = cortical subplate; CNU = cerebral nuclei; CBX = cerebellum; HY = hypothalamus; TH = thalamus; MB = midbrain; HB = hindbrain; AO = accessory olfactory area; Pir: piriform cortex; DLEnt: dorsolateral entorhinal cortex; SUB: subiculum; Tu = olfactory tubercle; MG = medial geniculate; MM = medial mammillary area; IC = inferior colliculus; KF = Koelliker-Fuse subnucleus
Figure 6.
Figure 6.. Optimized volumetric brain cell counting applications with ArgiNLS viral vectors.
a-c, Example circuit mapping with ArgiNLS-mKate2-expressing retroAAV into the basomedia amygdala (BMA). a, Top: Whole-brain volumetric rendering of AAV-hSyn-EGFP native expression labeling the injection site in green channel. Bottom: Corresponding red channel image displaying native fluorescence of ArgiNLS-mKate2+ single-cell inputs. b, Volumetric rendering of single-cell brain-wide input segmentations and their total counts using 3D ML, gradient color coded by Z depth. Total BMA input cells are listed in the bottom right. Main anatomical areas of local and long-range inputs are listed to the left and right, respectively. Sub = subiculum; Amy = amygdala; Cl = claustrum; aPVT = anterior paraventricular nucleus of the thalamus; PMv = ventral premammillary nucleus; IL = infralimbic cortex; AOB = accessory olfactory bulb c, Single-cells (native fluorescence: top; ML segmentation: bottom) and their total count from the anterior PVT (aPVT) input node cropped and expanded from the outlined inlay in b. d-e, Conditional labeling of GABAergic single-cells in the barrel cortex using local (d) Cre- or (e) Flp-dependent AAV injections in vGAT-Cre or vGAT-Flp driver mice, respectively. Left: 2D confocal image stacks displaying native conditional single-cell labeling from separate example brain samples. Middle: Example volumetric renderings of native conditional single-cell labeling from separate brain samples. Right: Volumetric renderings of 3D ML-segmented single-cells and their total counts for each sample. f, Large-scale labeling of single-cells using systemic delivery of AAV.eB-Ef1a-ArgiNLS-oScarlet virus at 1e10, 1e11, or 2e11 GC payloads. Left: Whole-brain volumetric renderings of combined hemispheric native ArgiNLS-oScarlet fluorescence (left hemisphere) and 3D ML segmentation (right hemisphere) of single-cells from separate example brain samples per viral condition. Total hemispheric cell counts are listed in the bottom left. Right: 2D horizontal planes of each sample across (top to bottom) dorsal, central, and ventral positions. Images display native ArgiNLS-oScarlet fluorescence with overlaid 3D ML classification on the right hemisphere and total cell counts per plane listed in the bottom right.

References

    1. Corsetti S., Gunn-Moore F. & Dholakia K. Light sheet fluorescence microscopy for neuroscience. J Neurosci Methods 319, 16–27 (2019). - PubMed
    1. Ragan T. et al. Serial two-photon tomography for automated ex vivo mouse brain imaging. Nat Methods 9, 255–258 (2012). - PMC - PubMed
    1. Li A. et al. Micro-optical sectioning tomography to obtain a high-resolution atlas of the mouse brain. Science 330, 1404–1408 (2010). - PubMed
    1. Kim Y. et al. Whole-Brain Mapping of Neuronal Activity in the Learned Helplessness Model of Depression. Front Neural Circuits 10, 3 (2016). - PMC - PubMed
    1. Kim Y. et al. Mapping social behavior-induced brain activation at cellular resolution in the mouse. Cell Rep 10, 292–305 (2015). - PMC - PubMed

Publication types