[Preprint]. 2023 Nov 20:rs.3.rs-3569833.
doi: 10.21203/rs.3.rs-3569833/v1.

Multimodal Biomedical Data Fusion Using Sparse Canonical Correlation Analysis and Cooperative Learning: A Cohort Study on COVID-19

Affiliations

Multimodal Biomedical Data Fusion Using Sparse Canonical Correlation Analysis and Cooperative Learning: A Cohort Study on COVID-19

Ahmet Gorkem Er et al. Res Sq. .

Update in

Abstract

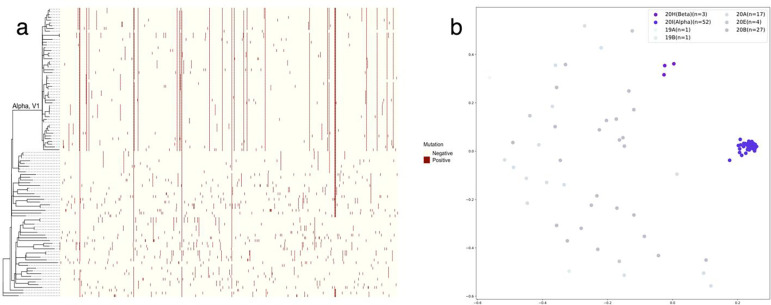
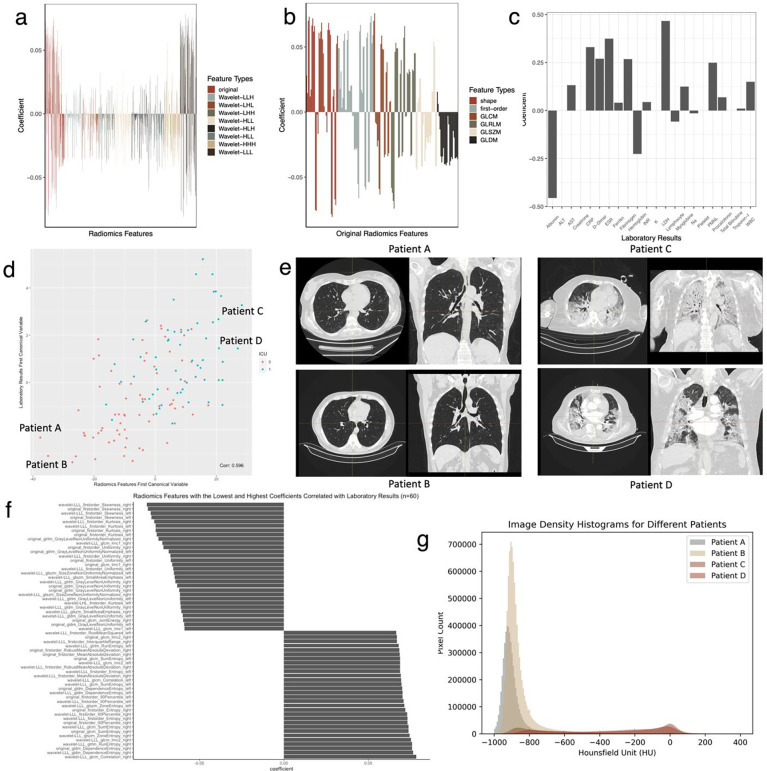
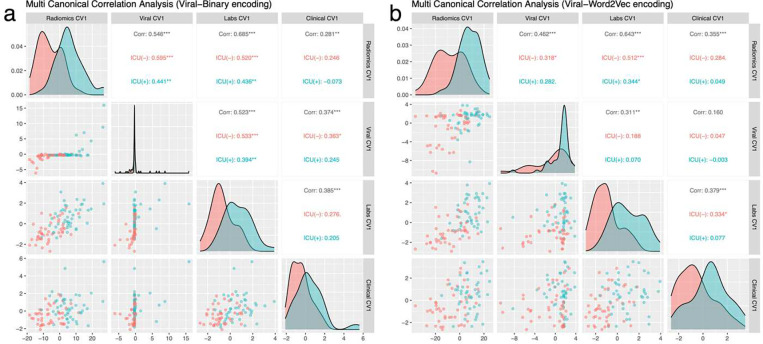
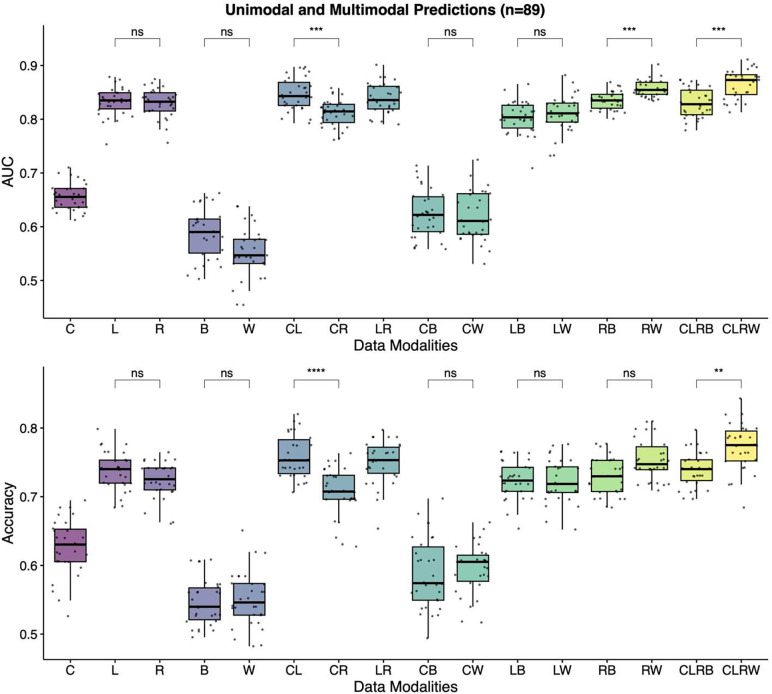
Through technological innovations, patient cohorts can be examined from multiple views with high-dimensional, multiscale biomedical data to classify clinical phenotypes and predict outcomes. Here, we aim to present our approach for analyzing multimodal data using unsupervised and supervised sparse linear methods in a COVID-19 patient cohort. This prospective cohort study of 149 adult patients was conducted in a tertiary care academic center. First, we used sparse canonical correlation analysis (CCA) to identify and quantify relationships across different data modalities, including viral genome sequencing, imaging, clinical data, and laboratory results. Then, we used cooperative learning to predict the clinical outcome of COVID-19 patients. We show that serum biomarkers representing severe disease and acute phase response correlate with original and wavelet radiomics features in the LLL frequency channel (corr(Xu1, Zv1) = 0.596, p-value < 0.001). Among radiomics features, histogram-based first-order features reporting the skewness, kurtosis, and uniformity have the lowest negative, whereas entropy-related features have the highest positive coefficients. Moreover, unsupervised analysis of clinical data and laboratory results gives insights into distinct clinical phenotypes. Leveraging the availability of global viral genome databases, we demonstrate that the Word2Vec natural language processing model can be used for viral genome encoding. It not only separates major SARS-CoV-2 variants but also allows the preservation of phylogenetic relationships among them. Our quadruple model using Word2Vec encoding achieves better prediction results in the supervised task. The model yields area under the curve (AUC) and accuracy values of 0.87 and 0.77, respectively. Our study illustrates that sparse CCA analysis and cooperative learning are powerful techniques for handling high-dimensional, multimodal data to investigate multivariate associations in unsupervised and supervised tasks.


Figures

Fig. 1:
Fig. 1:. Phylogenetic tree, nucleotide substitution matrix, and Word2Vec encoding plot of isolated SARS-CoV-2 strains.
a The phylogenetic tree of isolated SARS-CoV-2 strains and nucleotide substitutions in matrix form, in which the presence of substitutions is shown in dark red. b The Word2Vec encoding plot of the same strains. The nucleotide substitution matrix and Word2Vec encoding plot represent that Alpha strains appear more similar compared to non-Alpha strains.
Fig 2:
Fig 2:. Phylogenetic tree and 2D Word2Vec encoding plot of global SARS-CoV-2 strains.
a The phylogenetic relationships of the global SARS-CoV-2 clades as defined by Nextstrain. The screenshot was taken from CoVariants.org . b the Word2Vec encoding plot of 300 randomly selected viral strains from each Nextclade clade. Major variants, such as Variants 20I (Alpha, V1), 20H (Beta, V2), 21I, and 21J (Delta’s), and Omicron clades, are successfully separated.
Fig. 3:
Fig. 3:. Sparse CCA Analysis of Radiomics Features and Laboratory Results.
a Correlated radiomics features. Original and wavelet features in the LLL frequency channel have the highest absolute values of coefficients. b Coefficients of the original radiomics features. c Correlated laboratory results. Coefficients of laboratory results align with serum biomarkers related to severe disease and acute phase response. d The correlation between the first set of canonical variables shows that the first pair can capture the ICU outcome. We select two patients (Patient A and Patient B) with the lowest and two patients (Patient C and Patient D) with the highest canonical variables for radiomics features e Following the correlation plot, Patient A and Patient B’s CT images in axial and coronal planes have no pulmonary infiltration, whereas there are apparent findings on Patient C and Patient D’s CT images for COVID-19 pneumonia. f We select and visualize thirty variables with the highest and thirty variables with the lowest coefficients among the radiomics features. Histogram-based first-order features reporting the skewness, kurtosis, and uniformity have the lowest negative, whereas entropy-related features have the highest positive coefficients. g The image intensity histograms of the patients show that Patient A and Patient B have left-skewed histograms peaking around −1000 to −800 HU, consistent with air and lung parenchyma densities; however, histograms of Patient C and Patient D are flatter and more right-skewed, consistent with negative coefficients for skewness and kurtosis features and revealing a wider distribution of HU values.
Fig. 4:
Fig. 4:. Sparce CCA Analysis of laboratory results and clinical data.
The first four canonical variables are provided. Different canonical variables provide different clinical phenotypes: The first canonical variables represent a patient phenotype who is elderly, multi-morbid, and has moderate to severe renal disease with high creatinine and myoglobin levels, whereas the third canonical variables represent a different patient phenotype with moderate to severe liver disease with high bilirubin and INR levels.
Fig. 5:
Fig. 5:. Sparse Multi-CCA Analysis of All Data Modalities:
a The correlation pairs plot of the first canonical vectors of four data modalities, including Viral-Binary encoding. b Using Viral-Word2Vec encoding instead of Viral-Binary encoding provides a more homogenous distribution and better separation among canonical variables.
Fig. 6:
Fig. 6:. Unimodal and multimodal prediction models for the supervised task.
The best accuracy and AUC values are achieved with the quadruple model using Word2Vec Encoding (CLRW). Abbreviations: C, Clinical data; L, Laboratory results; R, Radiomics; B, Viral-Binary encoding; W, Viral-Word2Vec encoding; AUC, area under the curve; ns, non-significant

References

    1. Topol E.J. High-performance medicine: the convergence of human and artificial intelligence. Nature Medicine 25, 44–56 (2019). - PubMed
    1. Steyaert S., et al. Multimodal data fusion for cancer biomarker discovery with deep learning. Nature Machine Intelligence 5, 351–362 (2023). - PMC - PubMed
    1. Steyaert S., et al. Multimodal deep learning to predict prognosis in adult and pediatric brain tumors. Communications Medicine 3, 44 (2023). - PMC - PubMed
    1. Cheerla A. & Gevaert O. Deep learning with multimodal representation for pancancer prognosis prediction. Bioinformatics 35, i446–i454 (2019). - PMC - PubMed
    1. Hartmann K., Sadée C.Y., Satwah I., Carrillo-Perez F. & Gevaert O. Imaging genomics: data fusion in uncovering disease heritability. Trends Mol Med 29, 141–151 (2023). - PMC - PubMed

Publication types

LinkOut - more resources