[Preprint]. 2023 Nov 20:2023.11.20.23298785.
doi: 10.1101/2023.11.20.23298785.

Safety and immunogenicity of booster vaccination and fractional dosing with Ad26.COV2.S or BNT162b2 in Ad26.COV2.S-vaccinated participants

Affiliations

Safety and immunogenicity of booster vaccination and fractional dosing with Ad26.COV2.S or BNT162b2 in Ad26.COV2.S-vaccinated participants

Catherine Riou et al. medRxiv. .

Update in

  • Safety and immunogenicity of booster vaccination and fractional dosing with Ad26.COV2.S or BNT162b2 in Ad26.COV2.S-vaccinated participants.
    Riou C, Bhiman JN, Ganga Y, Sawry S, Ayres F, Baguma R, Balla SR, Benede N, Bernstein M, Besethi AS, Cele S, Crowther C, Dhar M, Geyer S, Gill K, Grifoni A, Hermanus T, Kaldine H, Keeton RS, Kgagudi P, Khan K, Lazarus E, Le Roux J, Lustig G, Madzivhandila M, Magugu SFJ, Makhado Z, Manamela NP, Mkhize Q, Mosala P, Motlou TP, Mutavhatsindi H, Mzindle NB, Nana A, Nesamari R, Ngomti A, Nkayi AA, Nkosi TP, Omondi MA, Panchia R, Patel F, Sette A, Singh U, van Graan S, Venter EM, Walters A, Moyo-Gwete T, Richardson SI, Garrett N, Rees H, Bekker LG, Gray G, Burgers WA, Sigal A, Moore PL, Fairlie L. Riou C, et al. PLOS Glob Public Health. 2024 Apr 11;4(4):e0002703. doi: 10.1371/journal.pgph.0002703. eCollection 2024. PLOS Glob Public Health. 2024. PMID: 38603677 Free PMC article.

Abstract

Background: We report the safety and immunogenicity of fractional and full dose Ad26.COV2.S and BNT162b2 in an open label phase 2 trial of participants previously vaccinated with a single dose of Ad26.COV2.S, with 91.4% showing evidence of previous SARS-CoV-2 infection.

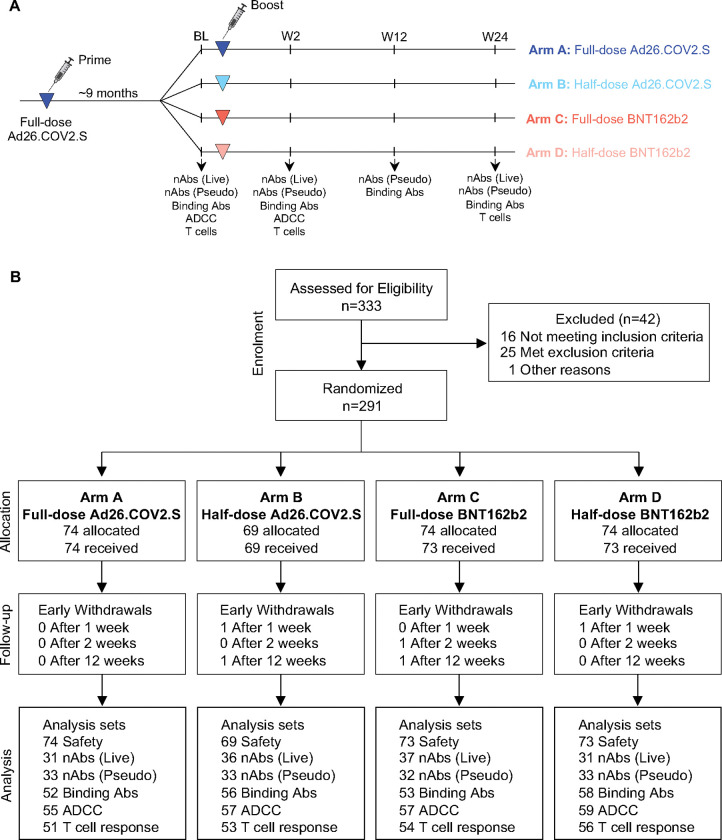
Methods: A total of 286 adults (with or without HIV) were enrolled >4 months after an Ad26.COV2.S prime and randomized 1:1:1:1 to receive either a full or half-dose booster of Ad26.COV2.S or BNT162b2 vaccine. B cell responses (binding, neutralization and antibody dependent cellular cytotoxicity-ADCC), and spike-specific T-cell responses were evaluated at baseline, 2, 12 and 24 weeks post-boost. Antibody and T-cell immunity targeting the Ad26 vector was also evaluated.

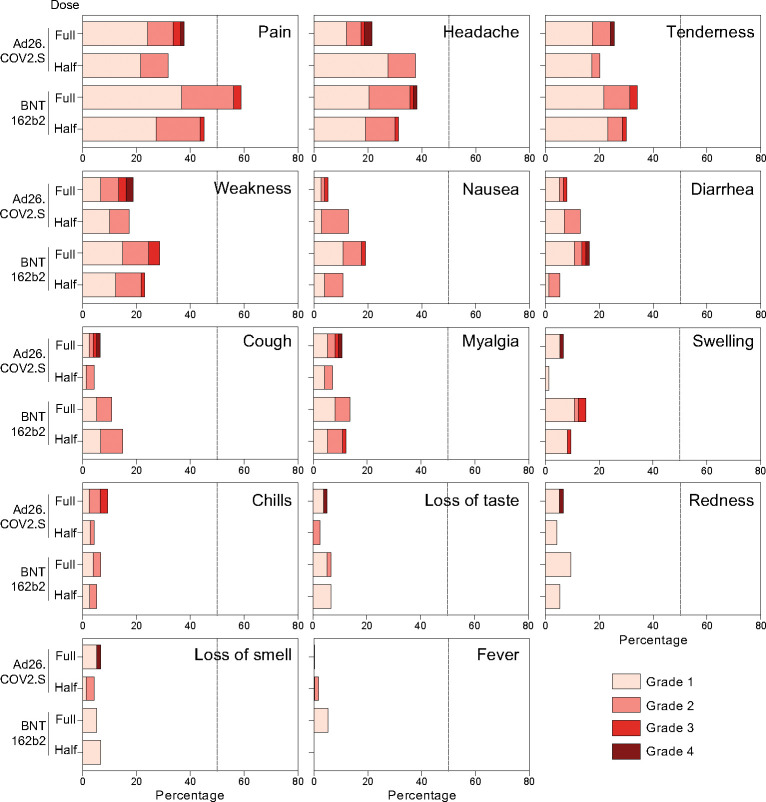
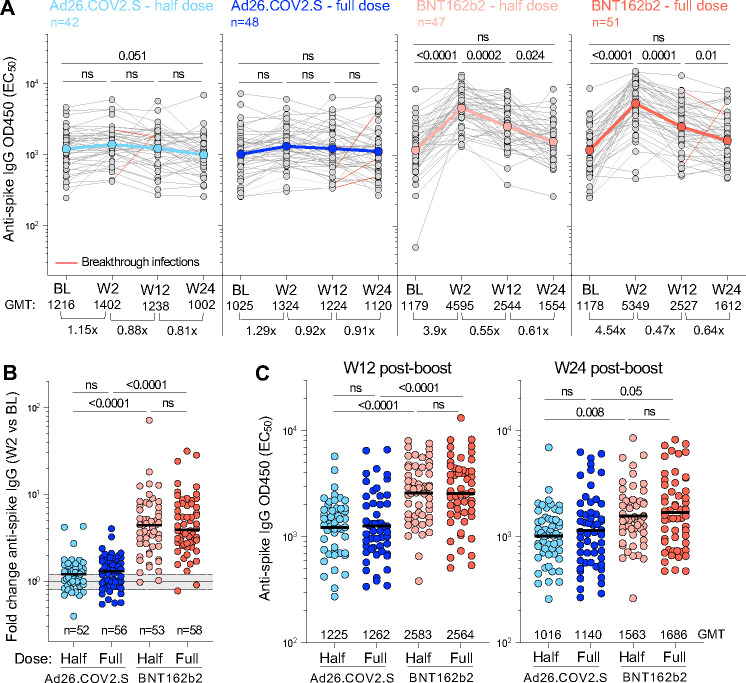
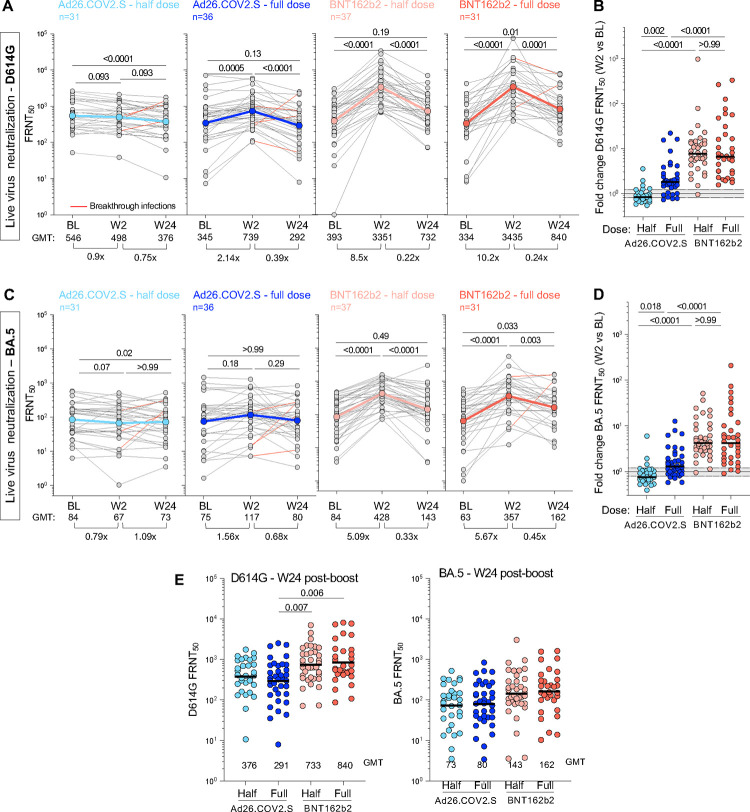
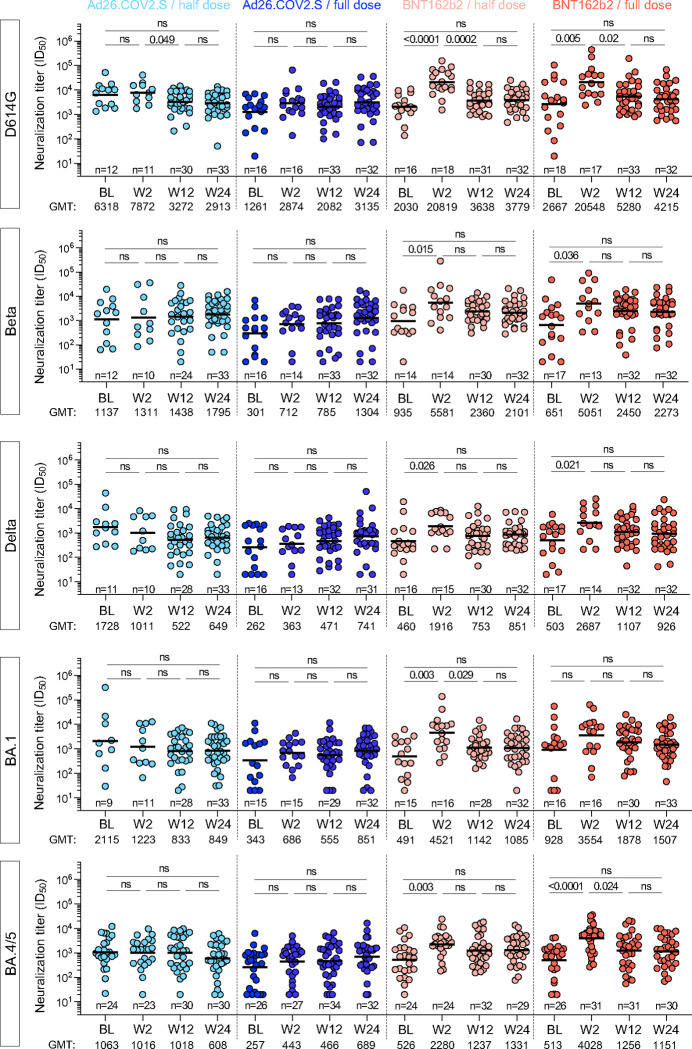
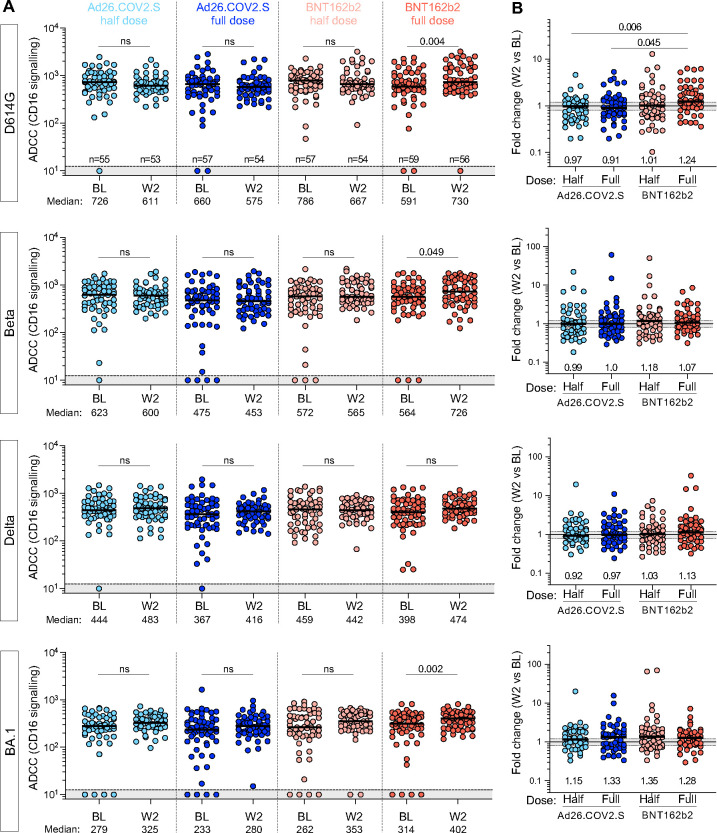
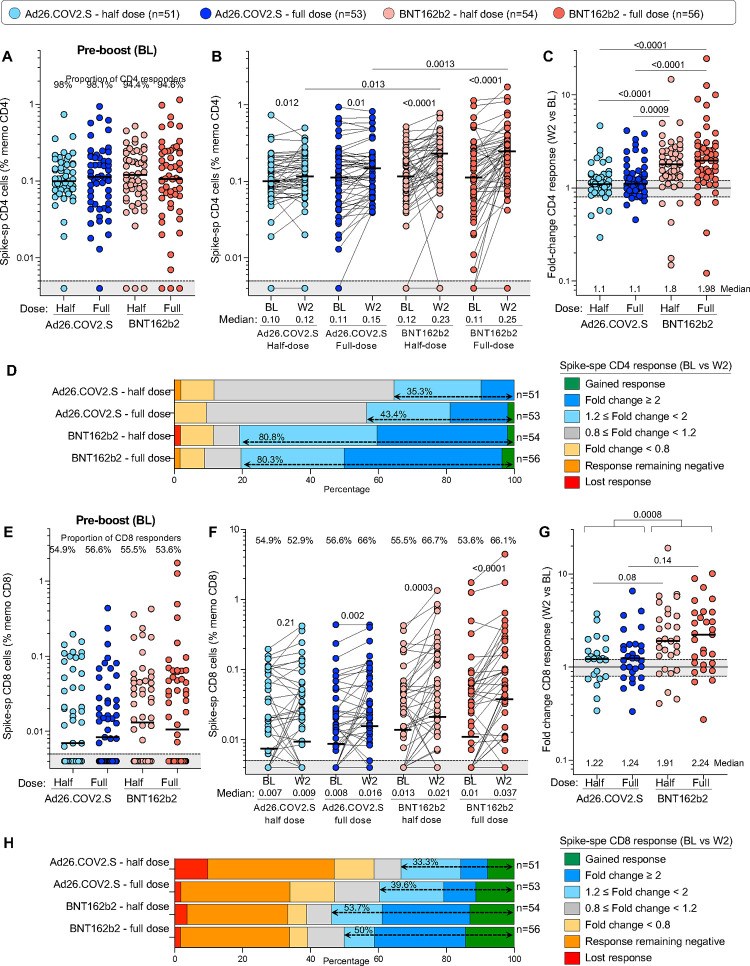
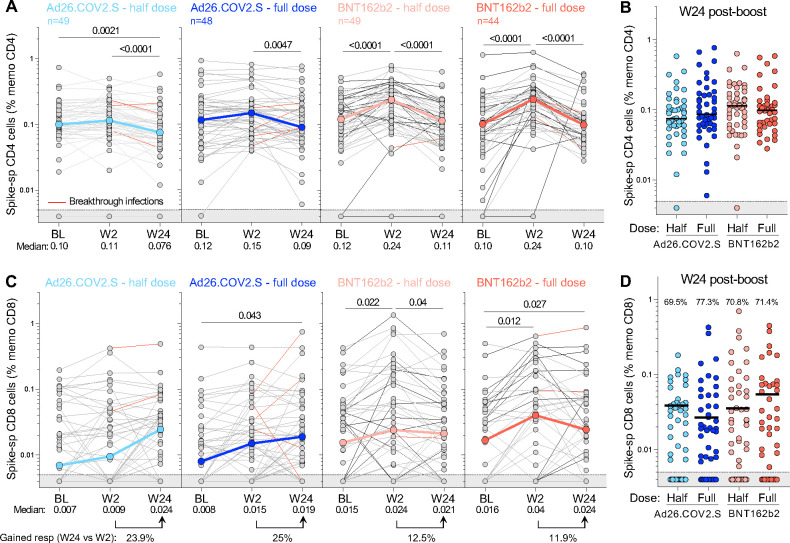
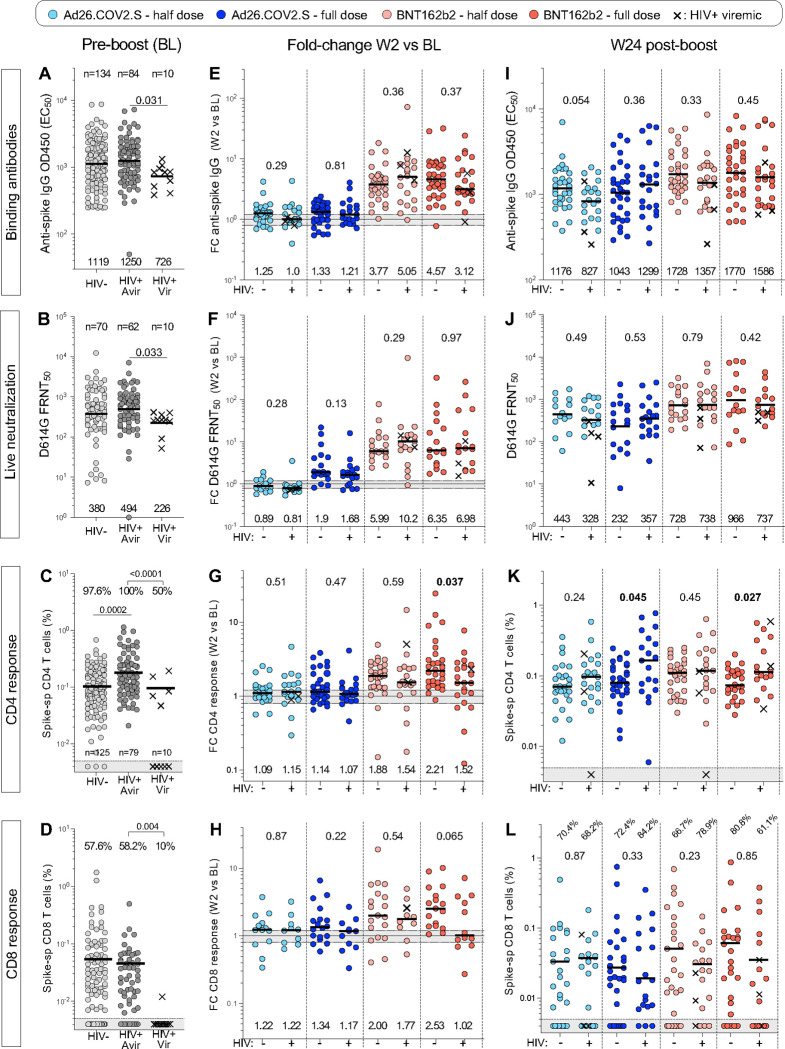
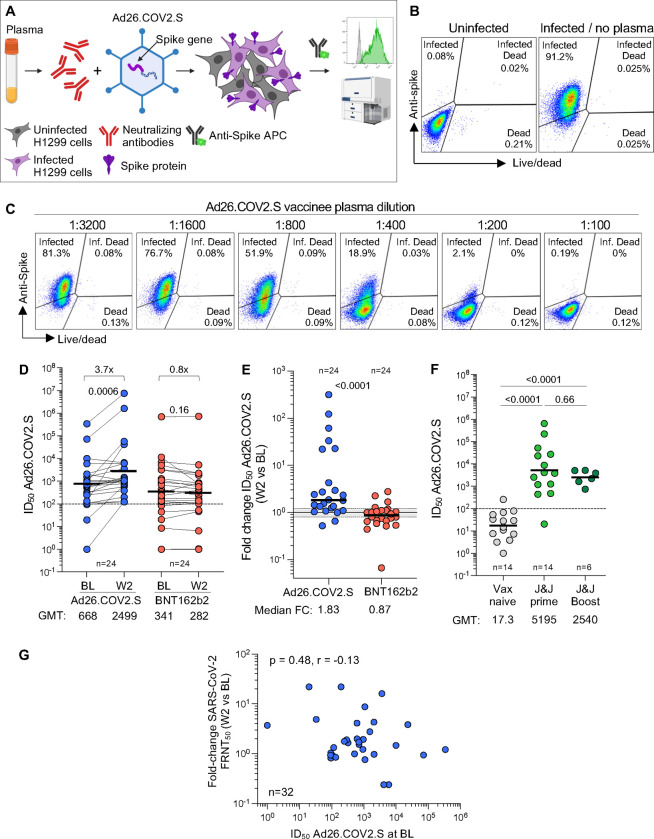
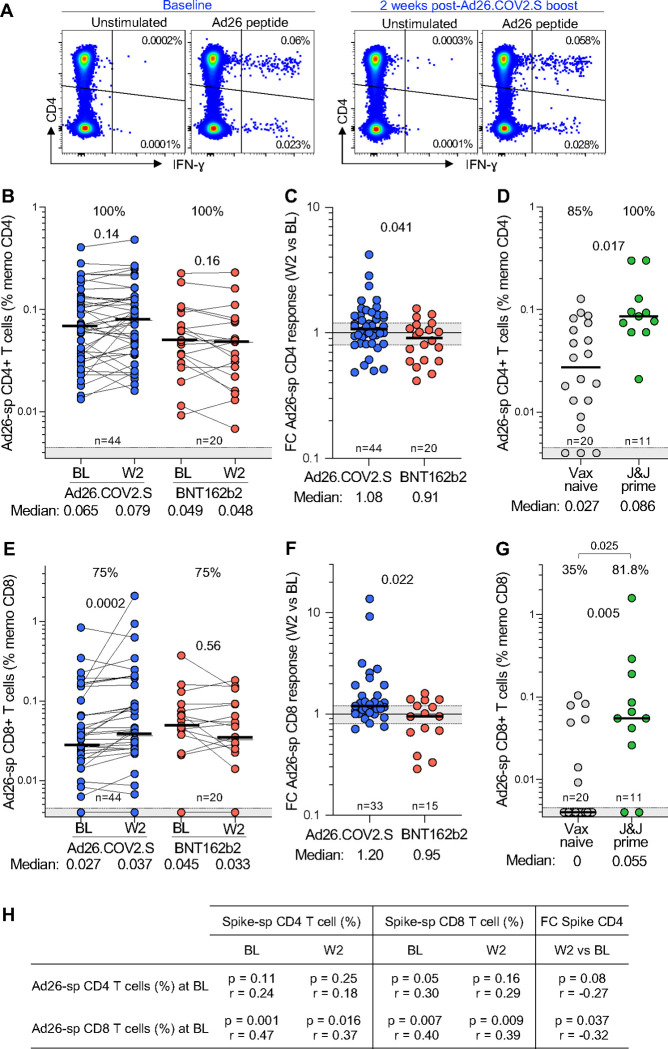
Results: No vaccine-associated serious adverse events were recorded. The full- and half-dose BNT162b2 boosted anti-SARS-CoV-2 binding antibody levels (3.9- and 4.5-fold, respectively) and neutralizing antibody levels (4.4- and 10-fold). Binding and neutralizing antibodies following half-dose Ad26.COV2.S were not significantly boosted. Full-dose Ad26.COV2.S did not boost binding antibodies but slightly enhanced neutralizing antibodies (2.1-fold). ADCC was marginally increased only after a full-dose BNT162b2. T-cell responses followed a similar pattern to neutralizing antibodies. Six months post-boost, antibody and T-cell responses had waned to baseline levels. While we detected strong anti-vector immunity, there was no correlation between anti-vector immunity in Ad26.COV2.S recipients and spike-specific neutralizing antibody or T-cell responses post-Ad26.COV2.S boosting.

Conclusion: In the context of hybrid immunity, boosting with heterologous full- or half-dose BNT162b2 mRNA vaccine demonstrated superior immunogenicity 2 weeks post-vaccination compared to homologous Ad26.COV2.S, though rapid waning occurred by 12 weeks post-boost.

Trial registration: South African National Clinical Trial Registry (SANCR): DOH-27-012022-7841.

Funding: South African Medical Research Council (SAMRC) and South African Department of Health (SA DoH).


Conflict of interest statement

Declaration of interest: A.Se. is a consultant for AstraZeneca Pharmaceuticals, Calyptus Pharmaceuticals, Inc, Darwin Health, EmerVax, EUROIMMUN, F. Hoffman-La Roche Ltd, Fortress Biotech, Gilead Sciences, Granite bio., Gritstone Oncology, Guggenheim Securities, Moderna, Pfizer, RiverVest Venture Partners, and Turnstone Biologics. A.G. is a consultant for Pfizer. LJI has filed for patent protection for various aspects of T cell epitope and vaccine design work. All other authors declare no competing interests.

Figures

Figure 1:
Figure 1:. Study design and CONSORT diagram.
(A) Study design. (B) CONSORT flow diagram. BL: baseline, nAbs (Live): Live virus neutralization assay; nAbs (Pseudo): pseudovirus neutralization assay. Binding Abs: Spike-specific IgG ELISA. ADCC: Antibody-dependent cellular cytotoxicity assay. T-cell response: Spike-specific T-cell intracellular cytokine staining assay.
Figure 2:
Figure 2:. Recorded adverse events in each study arm.
Distribution of participants experiencing adverse events (pain, headache, tenderness, weakness, nausea, diarrhea, cough, myalgia, swelling, chills, loss of taste, redness, loss of smell or fever) recorded 1 week post booster vaccination in each study arm.
Figure 3:
Figure 3:. Spike-specific IgG responses over time in the immunogenicity sub-study population.
(A) Longitudinal spike-specific IgG titer (EC50) at baseline (BL), W2, W12 and W24 after vaccine booster. The color-coded dots and bold lines represent the geometric mean titer (GMT) at each time point. Recorded BTI between W2 and W24 are depicted with a red line. Fold-change in the GMT is indicated at the bottom of each graph. Statistical comparisons were performed using a Friedman test with Dunn’s correction. (B) Fold change in spike-specific IgG titer between W2 and BL in each study arm. Bars represent median fold change. Statistical comparisons were performed using a Kruskal-Wallis test with Dunn’s correction. (C) Comparison of spike-specific IgG titer between study arms at W12 (left panel) and W24 (right panel). Bars represent GMT. Statistical comparisons (in B and C) were performed using a Kruskal-Wallis test with Dunn’s correction.
Figure 4:
Figure 4:. Live-virus neutralization activity against ancestral D614G and BA.5 SARS-CoV-2 variant after booster vaccination.
Neutralizing titer (FRNT50) against ancestral D614G (A&B) and Omicron BA.5 (C&D) at BL and post-vaccine booster. A&C show titer at BL, W2 and W24 post-boost for D614G (A) and BA.5 (C). Fold-change of the GMT is indicated at the bottom of each graph. The color-coded dots and bold lines represent the GMT at each time point. Recorded BTI between W2 and W24 are depicted with red lines. Statistical comparisons were performed using a Friedman test with Dunn’s correction. B&D show fold-change in neutralizing titer against D614G (B) and BA.5 (D) between BL and W2 in each study arm. Bars represent median fold-change. A Kruskal-Wallis test with Dunn’s correction was used to compare different arm groups. (E) Comparison of the neutralizing titer (FRNT50) against D614G (left panel) and BA.5 (right panel) between study arms at W24. Bars represent GMT. Statistical comparisons were performed using a Kruskal-Wallis test with Dunn’s correction.
Figure 5:
Figure 5:. Pseudovirus neutralization activity against ancestral D614G, Beta, Delta, BA.1 and BA.4/5 SARS-CoV-2 variants after booster vaccination.
Longitudinal neutralizing titer (ID50) against ancestral D614G, Beta, Delta, Omicron BA.1 and BA.4/5 at BL, W2, W12 and W24 after vaccine booster. Bars represent medians. Bars represent GMT. Statistical comparisons were performed using a Kruskal-Wallis test with Dunn’s corrections. Only HIV-negative participants were included in these analyses.
Figure 6:
Figure 6:. Antibody-dependent cellular cytotoxicity (ADCC) against ancestral (D614G), Beta, Delta and Omicron BA.1 SARS-CoV-2 variants.
(A) ADCC (CD16 signalling) at BL and W2 in each study arm. Bars represent medians. The grey shaded area indicates an undetectable ADCC response. Statistical comparisons were performed using a Wilcoxon matched-pairs signed rank test. (B) Fold change in ADCC activity between W2 and BL in each study arm. Bars represent median fold change. Statistical comparisons were performed using a Kruskal-Wallis test with Dunn’s corrections.
Figure 7:
Figure 7:. SARS-CoV-2 spike-specific T-cell responses before and 2 weeks after vaccine boosting.
(A) Comparison of the frequency of spike-specific CD4+ T cells pre-boost in the four study arms. The grey shaded area indicates undetectable response. (B) Frequency of spike-specific CD4+ T cells before (BL) and after vaccine boost (W2). (C) Fold change in the frequency of spike-specific CD4+ T cells between W2 and BL. (D) Overall profile of the evolution of the spike-specific CD4+ T-cell response between BL and W2. (E) Comparison of the frequency of spike-specific CD8+ T cells pre-boost in the four trial arms. (F) Frequency of spike-specific CD8+ T cells before (BL) and after vaccine boost (W2). (G) Fold change in the frequency of spike-specific CD8+ T cells between W2 and BL. (H) Overall profile of the evolution of the spike-specific CD8+ T-cell response between BL and W2. Bars represent medians. A two-tailed Wilcoxon signed-rank test was used to assess statistical differences between paired samples and a Kruskal-Wallis with Dunn’s corrections was used to compare different groups.
Figure 8:
Figure 8:. Kinetics of SARS-CoV-2 spike-specific T-cell response after vaccination.
(A) Longitudinal frequencies of spike-specific CD4+ T-cell responses induced by the four different booster vaccine regimens. (B) Comparison of the frequency of spike-specific CD4+ T cells between the four arms at W24 post-boost. (C) Longitudinal spike-specific CD8+ T-cell responses induced by the four booster vaccine regimens. (D) Comparison of the frequency of spike-specific CD8+ T cells between the four arms at W24 post-boost. The proportion of spike CD8+ responders is indicated at the top of the graph. The grey shaded area indicates undetectable response. The color-coded dots and bold lines in (A) and (C) represent the median at each time point. Recorded BTI between W2 and W24 are depicted with a red line. A Friedman test with Dunn’s correction was used to assess statistical differences between paired samples and a Kruskal-Wallis with Dunn’s corrections was used to compare different groups.
Figure 9:
Figure 9:. Humoral and cellular responses in study participants stratified by HIV status.
(A to D) Spike-specific binding antibodies (A), live neutralization activity (B), spike-specific CD4+ response (C) and spike-specific CD8+ response (D) against ancestral (D614G) SARS-CoV-2 in HIV-negative (HIV−), PLWH with a viral load <200 HIV mRNA copies/ml (HIV+ Avir) and PLWH with a viral load >200 HIV mRNA copies/ml (HIV+ Vir) before vaccine booster (BL). Bars represent GMT for A, B, I, J and medians for all other graphs. Statistical comparisons were performed using a Kruskal-Wallis test with Dunn’s corrections. The proportion of T-cell responders is indicated on top of the graph. (E to H) Fold change in spike-specific binding antibodies (E), live neutralization activity (F), spike-specific CD4+ response (G) and spike-specific CD8+ response (H) between W2 and BL in each study arm, stratified by HIV status. (I to L) Spike-specific binding antibodies (I), live neutralization activity (J), spike-specific CD4+ response (K) and spike-specific CD8+ response (L) against ancestral (D614G) SARS-CoV-2 at W24 after vaccine booster. Viremic PLWH are identified with a cross. Bars represent medians. Statistical comparisons between PLWH and HIV-negative groups were performed using a Mann-Whitney test.
Figure 10:
Figure 10:. Ad26-specific neutralizing activity.
(A) Schematic representation of the Ad26-specific neutralization assay. (B) Representative example of spike expression in Ad26.COV2.S-infected H1299 cells measured by flow cytometry. (C) Representative example of the inhibition of spike expression on Ad26.COV2.S-infected H1299 cells when Ad26.COV2.S was pre-incubated with plasma (serial dilution) from a participant vaccinated with one full dose of Ad26.COV2.S. (D) Ad26 neutralization activity (IC50) pre- and W2 post full dose-Ad26.COV2.S or a full-dose BNT162b2 booster. Statistical difference were assessed using a Wilcoxon matched paired signed rank test. (E) Fold change in Ad26 neutralization activity between W2 and BL in Ad26.COV2.S or BNT162b2 boosted participants. Bars represent GMT for D and F and medians for E. Statistical differences were assessed using a Wilcoxon matched paired signed rank test. (F) Comparison of Ad26 neutralization activity (IC50) in individuals who were vaccine naïve (n=14), received one full dose of Ad26.COV2.S (n=14) or received two full doses of Ad26.COV2.S (n=6) from an independent cohort. Statistical differences were assessed using a Kruskal-Wallis test with Dunn’s correction. (G) Relationship between the fold change in neutralizing titer against D614G SARS-CoV-2 between W2 and BL and Ad26 neutralization activity at BL. Correlation was tested by a two-tailed non-parametric Spearman’s rank test.
Figure 11:
Figure 11:. Ad26-specific T-cell responses.
(A) Representative example of IFN-g production in response to Ad26-specific peptide pool (hexon and penton) in one participant before (baseline) and 2 weeks after a full dose-Ad26.COV2.S booster. (B & E) Frequency of Ad26-specific CD4+ T cell (B) and CD8+ T cells (E) pre- and post a full dose-Ad26.COV2.S or a full-dose BNT162b2 booster. Statistical difference were assessed using a Wilcoxon matched paired signed rank test. (C & F) Fold change in the frequency of Ad26-specific CD4+ T cells (C) and CD8+ T cells (F) between W2 and BL in full-dose Ad26.COV2.S or full-dose BNT162b2 boosted participants. (D & G) Comparison of the frequency of Ad26-specific CD4+ T cells (D) and CD8+ T cells (G) in individuals who are vaccine naïve (n=20) or received one full dose of Ad26.COV2.S (n=11) from an independent cohort. The proportion of Ad26 T- cell responders is indicated at the top of each graph. Statistical differences were assessed using a Kruskal-Wallis test with Dunn’s correction and a Chi-test to compare proportions. Bars represent medians. (H) Relationship between the frequency of spike-specific T-cell response at BL or W2 and the frequency of Ad26-specific T-cell responses at BL. Correlations were tested by a two-tailed non-parametric Spearman’s rank test.

References

    1. Bekker LG, Garrett N, Goga A, Fairall L, Reddy T, Yende-Zuma N, et al. Effectiveness of the Ad26.COV2.S vaccine in health-care workers in South Africa (the Sisonke study): results from a single-arm, open-label, phase 3B, implementation study. Lancet. 2022;399(10330):1141–53. doi: 10.1016/S0140-6736(22)00007-1. - DOI - PMC - PubMed
    1. Madhi SA, Baillie V, Cutland CL, Voysey M, Koen AL, Fairlie L, et al. Efficacy of the ChAdOx1 nCoV-19 Covid-19 Vaccine against the B.1.351 Variant. N Engl J Med. 2021;384(20):1885–98. Epub 20210316. doi: 10.1056/NEJMoa2102214. - DOI - PMC - PubMed
    1. Keeton R, Tincho MB, Ngomti A, Baguma R, Benede N, Suzuki A, et al. T cell responses to SARS-CoV-2 spike cross-recognize Omicron. Nature. 2022;603(7901):488–92. Epub 20220131. doi: 10.1038/s41586-022-04460-3. - DOI - PMC - PubMed
    1. Cele S, Jackson L, Khoury DS, Khan K, Moyo-Gwete T, Tegally H, et al. Omicron extensively but incompletely escapes Pfizer BNT162b2 neutralization. Nature. 2022;602(7898):654–6. Epub 20211223. doi: 10.1038/s41586-021-04387-1. - DOI - PMC - PubMed
    1. Wibmer CK, Ayres F, Hermanus T, Madzivhandila M, Kgagudi P, Oosthuysen B, et al. SARS-CoV-2 501Y.V2 escapes neutralization by South African COVID-19 donor plasma. Nat Med. 2021;27(4):622–5. Epub 20210302. doi: 10.1038/s41591-021-01285-x. - DOI - PubMed

Publication types