[Preprint]. 2023 Nov 20:rs.3.rs-3509208.
doi: 10.21203/rs.3.rs-3509208/v1.

Epistasis regulates genetic control of cardiac hypertrophy

Affiliations

Epistasis regulates genetic control of cardiac hypertrophy

Qianru Wang et al. Res Sq. .

Update in

  • Epistasis regulates genetic control of cardiac hypertrophy.
    Wang Q, Tang TM, Youlton M, Weldy CS, Kenney AM, Ronen O, Hughes JW, Chin ET, Sutton SC, Agarwal A, Li X, Behr M, Kumbier K, Moravec CS, Tang WHW, Margulies KB, Cappola TP, Butte AJ, Arnaout R, Brown JB, Priest JR, Parikh VN, Yu B, Ashley EA. Wang Q, et al. Nat Cardiovasc Res. 2025 Jun;4(6):740-760. doi: 10.1038/s44161-025-00656-8. Epub 2025 Jun 5. Nat Cardiovasc Res. 2025. PMID: 40473955 Free PMC article.

Abstract

The combinatorial effect of genetic variants is often assumed to be additive. Although genetic variation can clearly interact non-additively, methods to uncover epistatic relationships remain in their infancy. We develop low-signal signed iterative random forests to elucidate the complex genetic architecture of cardiac hypertrophy. We derive deep learning-based estimates of left ventricular mass from the cardiac MRI scans of 29,661 individuals enrolled in the UK Biobank. We report epistatic genetic variation including variants close to CCDC141, IGF1R, TTN, and TNKS. Several loci not prioritized by univariate genome-wide association analysis are identified. Functional genomic and integrative enrichment analyses reveal a complex gene regulatory network in which genes mapped from these loci share biological processes and myogenic regulatory factors. Through a network analysis of transcriptomic data from 313 explanted human hearts, we show that these interactions are preserved at the level of the cardiac transcriptome. We assess causality of epistatic effects via RNA silencing of gene-gene interactions in human induced pluripotent stem cell-derived cardiomyocytes. Finally, single-cell morphology analysis using a novel high-throughput microfluidic system shows that cardiomyocyte hypertrophy is non-additively modifiable by specific pairwise interactions between CCDC141 and both TTN and IGF1R. Our results expand the scope of genetic regulation of cardiac structure to epistasis.


Conflict of interest statement

Competing interests E.A.A. is a Founder of Personalis, Deepcell, Svexa, RCD Co, and Parameter Health; Advisor to Oxford Nanopore, SequenceBio, and Pacific Biosciences; and a non-executive director for AstraZeneca. C.S.W. is a consultant for Tensixteen Bio and Renovacor. V.N.P. is an SAB member for and receives research support from BioMarin, Inc, and is a consultant for Constantiam, Inc. and viz.ai. The remaining authors declare no competing interests.

Figures

Extended Data Fig. 1:
Extended Data Fig. 1:. Distribution of LVM and LVMi measurements for 29,661 UK Biobank participants.
Left ventricular mass (LVM, a) and LVM indexed to body surface area (LVMi, b) measurements were extracted from cardiac magnetic resonance imaging for 29,661 unrelated White British individuals via deep learning. c, A high Pearson correlation of 0.92 was observed between these LVM and LVMi measurements.
Extended Data Fig. 2:
Extended Data Fig. 2:. LVMi GWAS using BOLT-LMM and PLINK.
GWAS using BOLT-LMM (a) and PLINK (b) identified associations with LVMi, of which the lead SNV rs3045696 showed the highest significance. This SNV rs3045696 was also identified as the top lead SNV by both BOLT-LMM and PLINK while other lead SNVs (labeled) were significant in either the BOLT-LMM GWAS or the PLINK GWAS but not both. The red dashed line denotes the genome-wide significance threshold (p < 5E-8). The two SNVs, rs3045696 and rs67172995, are also stably prioritized by lo-siRF as epistasis interactor variants. Details can be found in Extended Data 1.
Extended Data Fig. 3:
Extended Data Fig. 3:. Differences in local stability scores between high and low LV mass highlight the importance of the lo-siRF-prioritized interactions between genetic loci.
a, Schematic of local stability importance score computation. Given a locus (light blue transcript), the local stability importance score for an individual is defined as the proportion of trees for which at least one SNV (shaded black region) in the locus is used in the individual’s decision path. This computation (top) was performed for each individual (denoted by the stacked boxes). Then, a permutation test was conducted to assess the difference in these local stability importance scores between the low and high LVMi individuals (bottom). b, Differences in the distribution of local stability importance scores suggest that the identified interactions between genetic loci are important for differentiating individuals with high (dark gray) and low (orange) LVMi in the siRF fit. This result, evaluated on the validation data, is stable across the three binarization thresholds and is quantified by a permutation p-value given in the top right corner of each subplot.
Extended Data Fig. 4:
Extended Data Fig. 4:. Top SNVs from lo-siRF-prioritized loci and interactions between loci.
The most important SNVs and SNV-SNV pairs, as measured by their proportion of occurrence in the siRF fit are annotated for the top lo-siRF-prioritized interactions between loci in a and top genetic loci in b. The y-axis shows the proportion of decision paths in siRF, for which the SNV or SNV-SNV pair occurs, averaged across all three binarization thresholds. In each of the interactions between genetic loci, the SNV rs7591091 in the CCDC141 locus appears most frequently, suggesting a key role in cardiac hypertrophy.
Extended Data Fig. 5:
Extended Data Fig. 5:. Genes mapped from epistatic loci share transcription factors and splicing regulators.
For the gene pairs exhibiting a strong co-association to transcription factors (TFs) and RNA-binding regulators (p < 0.05, Fig. 4e), the horizontal bars indicate the number of shared TFs or RNA-binding regulators (bottom axis), of which the top-ranked one with the lowest enrichment p-value (dots, top axis) are labeled on the bars, which are colored by the corresponding gene set library. Detailed information can be found in Extended Data 7.
Extended Data Fig. 6:
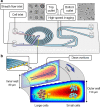
Extended Data Fig. 6:. Spiral-shaped inertial microfluidic channel for cell focusing and imaging.
a, Schematic of an inertial microfluidic cell focusing device. Cell suspensions and fresh medium were introduced into the microfluidic device through the cell and sheath flow inlets, respectively, using a syringe pump and flowed down the 5-loop spiral microchannel with the same flow rate (1.2 mL/min). Inserted microscopy images show that randomly dispersed cells were separated by size and bifurcated into the top (large cells) or bottom (small cells) outlets. Scale bar, 10 μm. Outlet channels are connected to straight observation channels where flowing cells were further focused in the channel height direction and imaged using a high-speed camera for morphological feature extraction (Fig. 6c). b, Schematic of the cell focusing principle. The spiral microchannel has a cross-section with a slanted ceiling, resulting in different depths at the inner and outer side of the microchannel. This geometry induces strong Dean vortices (counter rotating vortices in the plane perpendicular to the main flow direction) in the outer half of the microchannel cross-section. The interplay between drag forces FL induced by Dean vortices and lift forces FD due to shear gradient and the channel wall drives cell transverse migration towards equilibrium positions where the net force is zero. As a result, large cells in a heterogeneous population progressively migrate closer to the inner channel wall, while smaller cells move towards the outer channel wall. Details about microchannel dimensions can be found in Methods.
Extended Data Fig. 7:
Extended Data Fig. 7:. Epistatic genes non-uniformly reshape cardiomyocyte size distributions.
a, A heatmap of relative differences of cell sizes at various quantile levels between gene-silencing and scramble control conditions for unaffected and MYH7-R403Q variant cardiomyocytes. Larger quantiles correspond to larger cells in the cell size distribution. Dark red indicates strong reduction of cell sizes at the specified quantile level in gene-silenced cells relative to the scramble control. The corresponding statistical differences (b) were evaluated by the maximum p-values across all batches of cells using a bootstrap quantile test (with 10,000 bootstrapped samples). c, Representative QQ-plots of cell size quantiles comparing between gene-silenced cells and scramble controls for both unaffected (top row) and MYH7-R403Q variant (bottom row) cardiomyocytes indicate a clear size-bias in the effect of silencing CCDC141-IGF1R on correcting cardiomyocyte hypertrophy.
Extended Data Fig. 8:
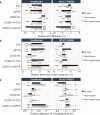
Extended Data Fig. 8:. Effects of lo-siRF-prioritized genes and gene-gene interactions on hypertrophic and non-hypertrophic cell morphology.
Relative differences in median cell size (a), normalized peak number (b), and roundness error (c) of gene-silenced human induced pluripotent stem cells-derived cardiomyocytes compared to scramble controls computed for hypertrophic cells (size-sorted by microfluidic channel illustrated in Extended Data Fig. 6, gray bars), non-hypertrophic cells (white bars), or both (black bars). Error bars indicate standard deviation calculated from bootstrapping samples of 2 to 4 batches of cells. Asterisks indicate significant differences compared to the scramble control based on the maximum p-values of Wilcoxon signed rank test across all batches of cells (*p < 0.05, **p < 0.001, and ***p < 1E-4).
Fig. 1:
Fig. 1:. Schematic of the study workflow.
The study workflow includes four major stages: (a) derivation of left ventricular mass from cardiac magnetic resonance imaging (green boxes); (b) computational prioritization of epistatic drivers (orange); (c) functional interpretation of the hypothesized epistatic genetic loci (purple); and (d) experimental confirmation of epistasis in cardiac tissues and cells (blue). Abbreviations: MRI, magnetic resonance imaging; LV, left ventricle; LVM, left ventricular mass; LVMi, left ventricular mass indexed by body surface area; SNV, single-nucleotide variant; GWAS, genome-wide association study; BOLT-LMM and PLINK, two different GWAS software packages; lo-siRF, low-signal signed iterative random forest; ANNOVAR, a software for functional annotation of genetic variants; CADD, combined annotation dependent depletion, which scores the deleteriousness of variants; RegulomeDB, a database that scores functional regulatory variants; ChromHMM, a multivariate Hidden Markov Model for chromatin state annotation; eQTL, expression quantitative trait locus; sQTL, splicing quantitative trait locus; Hi-C, high-throughput chromosome conformation capture; PheWAS, phenome-wide association study; siRNA, small interfering RNA; hiPSC-CM, human induced pluripotent stem cell-derived cardiomyocyte; HCM, hypertrophic cardiomyopathy.
Fig. 2:
Fig. 2:. Low-signal signed iterative random forest (lo-siRF) prioritizes risk loci and epistatic interactions for left ventricular hypertrophy.
a-e, Workflow of low-signal signed iterative random forest (lo-siRF). a, Lo-siRF took in as input single-nucleotide variant (SNV) data and cardiac MRI-derived left ventricular mass indexed by body surface area (LVMi) from 29,661 UK Biobank participants. b, Dimension reduction was performed via a genome-wide association study (GWAS) to concentrate the analysis on a smaller set of SNVs. c, LVMi was binarized into high and low LVMi categories according to three different binarization thresholds (represented by the stacked boxes). d, For each of the three binarization thresholds, a signed iterative random forest was fitted using the GWAS-filtered SNVs to predict the binarized LVMi phenotype. The validation prediction accuracy was assessed prior to interpreting the model fit. e, SNVs used in the fitted signed iterative random forest were aggregated into genetic loci based on annotations using ANNOVAR. Genetic loci and pairwise interactions between loci were finally ranked according to their importance across the three signed iterative random forest fits, as measured by our proposed stability-driven importance score. f, Lo-siRF-prioritized risk loci and epistatic interactions. (1) Loci stably prioritized by lo-siRF as epistasis participants are highlighted in green. (2) nIndSigSNVs, the number of independent significant SNVs that are stably prioritized by lo-siRF across the three different LVMi binarization thresholds (panel c). (3) nSNVs, the number of candidate SNVs extracted by FUMA (v1.5.4) in strong LD (r2 > 0.6) with any of the lo-siRF-prioritized independent significant SNVs. (4) Lo-siRF p-value, the mean p value from lo-siRF, averaged across the three LVMi binarization thresholds. (5) Max CADD, the maximum CADD score of SNVs within or in LD with the specific locus. A high CADD score indicates a strong deleterious effect of the variant. A threshold of 12.37 has been suggested by Kircher et al.. (6) Min RDB, the minimum RegulomeDB score of SNVs within or in LD with the specific locus. RDB is a categorical score to guide interpretation of regulatory variants (from 1a to 7, with 1a being the most biological evidence for an SNV to be a regulatory element),. (7) The top-ranked SNV or SNV-SNV pair showing the highest occurrence frequency (Extended Data Fig. 4) averaged across lo-siRF fits from the three LVMi binarization thresholds. A full list of lo-siRF-prioritized SNVs and SNV-SNV pairs can be found in Extended Data 3. (8) Genomic location (hg38) and GWAS statistics information (using PLINK) of the top SNV for each lo-siRF-prioritized locus. Abbreviations: MAF, minor allele frequency; NEA/EA, non-effect-allele/effect-allele; SE, standard error. (9) nPartnerSNVs, number of partner SNVs that interact with the given SNV in lo-siRF. These SNV-SNV pairs interacted in at least one lo-siRF decision path across every LVMi binarization threshold (details in Methods).
Fig. 3:
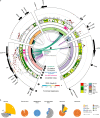
Fig. 3:. lo-siRF finds epistatic interactions between genetic risk loci for left ventricular hypertrophy.
a, Circos plot showing the genetic risk loci identified by lo-siRF (green, circle 2) and regions after clumping FUMA-extracted SNVs in LD (r2 > 0.6) with lo-siRF-prioritized SNVs (black, circle 3). Circle 1 shows the top 300 epistatic SNV-SNV pairs with the highest frequency of occurrence in lo-siRF (green), SNV-gene linkages (FDR < 0.5) based on GTEx V8 cis-eQTL information from heart and skeletal muscle tissues (purple), and 3D chromatin interactions based on Hi-C data of left ventricular tissue obtained from GSE87112. Circle 5 and 6 show bar plots of the occurrence frequency and number of partner SNVs in epistasis (normalized by the maximum value of the corresponding locus) identified by lo-siRF, respectively. Circle 7 shows the ChromHMM core-15 chromatin state for left ventricle (LV), right ventricle (RV), right atrium (RA), and fetal heart (Fetal). Circle 8 shows the GWAS Manhattan plot from PLINK (circles) where only SNVs with p < 0.05 are displayed. The 283 lo-siRF-prioritized SNPs and their LD-linked (r2 > 0.6) SNVs are color-coded as a function of their maximum r2 value. A portion of these LD-linked SNPs (the outer heatmap layer in circle 8) are extracted from the selected FUMA reference panel (thereby with no GWAS p-values). SNVs that are not in LD (r2 ≤ 0.6) with any of the 283 lo-siRF-prioritized SNVs are gray. Dashed line indicates GWAS p = 5E-8. Circle 9 shows the 21 protein-coding genes mapped by FUMA. b, Pie charts showing ANNOVAR enrichment performed for each of the 6 lo-siRF loci (circle 2 in Fig. 3a and Fig. 2f). The arc length of each slice indicates the proportion of SNVs with a specific functional annotation. The radius of each slice indicates log2(E + 1), where E is the enrichment score computed as (proportion of SNVs with an annotation for a given locus)/(proportion of SNVs with an annotation relative to all available SNVs in the FUMA reference panel). The dashed circle indicates E = 1 (no enrichment). Asterisks indicate two-sided p-values of Fisher’s exact tests for the enrichment of each annotation. Details can be found in Extended Data 4 and 5.
Fig. 4:
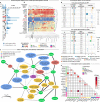
Fig. 4:. Genes mapped from epistatic loci interact in multiple functional co-association networks.
a, UpSet plot showing the number of lo-siRF-prioritized SNVs (dark blue) and their LD-linked (r2 > 0.6) SNVs (light blue, circle 8 in Fig. 3a) that are functionally mapped to each of the 21 protein-coding genes by positional, eQTL, and/or chromatin interaction (CI) mapping using FUMA. CCDC141 and IGF1R (highlighted in red) are prioritized by all the three types of SNV-to-gene mapping. Details can be found in Extended Data 4. b, Heatmap of averaged expression (from GTEx) per tissue type per gene (50% winsorization, log2(TPM + 1)) for these functionally mapped genes. c, Co-association network built from an enrichment analysis integrating multiple annotated gene set libraries for gene ontology (GO) and pathway terms from Enrichr. The co-association network connects top enriched GO and pathway terms with genes (green nodes in the network) functionally linked from lo-siRF-prioritized epistatic and hypostatic loci (Fig. 2f). Strengths (indicated by the edge width in the network) of the co-association between enriched terms and genes were measured and ranked by the empirical p-value from an exhaustive permutation of the co-association score for all possible gene-gene combinations in the network (Details in Methods and Extended Data 6). d, A comparison between the top 10 transcription factors (TFs) enriched from genes prioritized (top) and deprioritized (bottom) by lo-siRF. The lo-siRF-prioritized genes are genes functionally linked from lo-siRF-prioritized SNVs (panel a). The lo-siRF-deprioritized genes are genes functionally linked from SNVs that failed to pass the lo-siRF prioritization thresholds. For each of the two gene groups, enrichment results against nine TF-annotated gene set libraries from ChEA3 and Enrichr were integrated and ranked by the number of significantly (FET p < 0.05) overlapped libraries (numbers in the nLibraries column) and the mean scaled rank across all libraries containing that TF (colored boxes in the nLibraries column). The balloon plot shows the lowest FET p-values for each TF (horizontal axis) and the proportion of overlapped genes (balloon size) between the input gene set and the corresponding TF-annotated gene set. e, Heatmap showing the TF co-association strength of gene-gene combinations among lo-siRF-prioritized genes relative to randomly selected gene pairs in the co-association network. More details are available in Extended Data Fig. 5 and Extended Data 7.
Fig. 5:
Fig. 5:. Network analysis using transcriptomic data from 313 human hearts confirms the CCDC141-TTN interaction.
a, Control (blue) and heart failure (red) gene co-expression networks were established from a weighted gene co-expression network analysis (WGCNA) on transcriptomic data obtained from 313 non-failing and failing human heart tissues. b-c, The connectivity between lo-siRF-prioritized genes in this study was compared against the full connectivity distributions for all possible gene-gene combinations in the control (b) and heart failure (c) networks. CCDC141 and TTN show significant connectivity in both networks. d, Comparing the difference in connectivities between the control and heart failure networks indicate a change in the connectivity of the hypothesized CCDC141-TTN interaction during the progression of failing hearts. e-f, Dendrograms from WGCNA control (g) and heart failure (h) networks show distinctive gene module structures.
Fig. 6:
Fig. 6:. CCDC141 non-additively interacts with TTN and IGF1R to modify cardiomyocyte morphology.
a, Human induced pluripotent stem cell (iPSC)-derived cardiomyocytes with and without hypertrophic cardiomyopathy (carrying an MYH7-R403Q mutation) were transfected with scramble siRNA or siRNAs specifically targeting single (CCDC141, IGF1R, and TTN) or combined (CCDC141-IGF1R and CCDC141-TTN) genetic loci prioritized by lo-siRF. b, Gene-silenced cardiomyocytes were bifurcated into two focused streams of large and small cells using a spiral microfluidic device (cell focusing mechanism illustrated in Extended Data Fig. 6) to allow high-resolution single cell imaging. c, Workflow of the image analysis process. Time-lapse image sequences of single cells passing through the top and bottom microchannel outlets (panel b) were fed into a customized MATLAB-based program that extracts cell size/shape features via a sequential process of bright field background correction, cell boundary detection, cell tracking and stuck cell removal, cell feature extraction, data quality control and postprocessing, and morphological feature analysis. Extracted single cell features for each gene-silencing condition were compared with their scrambled control values to validate the potential role of epistasis in the genetic regulation of cardiomyocyte hypertrophy (d-j). d, Violin plots of cell diameters of unaffected (blue) and MYH7-R403Q variant (red) cardiomyocytes. Solid and dashed lines in box plots represent median and mean values, respectively. Asterisks indicate significant difference (***p < 1E-36, Wilcoxon signed rank test). e, Gene-silencing efficiency in unaffected (blue, n = 5 to 9) and MYH7-R403Q variant (red, n = 3) cells based on RT-qPCR analysis (details in Methods). Error bars indicate standard deviations. f, Percent change (relative size difference) in median cell diameter of gene-silenced cardiomyocytes relative to scramble control values indicates that CCDC141 interacts with IGF1R to rescue cardiomyocyte hypertrophy. Relative size differences were averaged across data from two to four independent batches of cells. Error bars indicate standard deviations computed on 1000 bootstrap samples of these batches with the following sample size: n = 13147 (TTN), 19460 (IGF1R), 45304 (CCDC141), 19979 (CCDC141-TTN), and 26135 (CCDC141-IGF1R) for unaffected cells and n = 22134 (TTN), 33801 (IGF1R), 21158 (CCDC141), 39515 (CCDC141-TTN), and 52049 (CCDC141-IGF1R) for MYH7-R403Q variant cells. Asterisks indicate significant difference between gene-silencing and scramble control conditions based on the maximum p-values of Wilcoxon signed rank test across all batches of cells (*p < 0.05, **p < 0.001, and ***p < 1E-4). g, CCDC141 non-additively interacts with IGF1R (left) and TTN (right) to modify boundary and texture features of unaffected (blue) and MYH7-R403Q variant (red) cells. Cell boundary waveness and texture irregularity were measured by the roundness error (h, top) and normalized peak number (h, bottom), respectively. i, Representative single-cell images overlapped with detected cell boundaries (red lines) show that a higher roundness error indicates increased irregularity of the cell boundary. j, Representative single-cell images with detected peaks (blue plus signs) of the brightfield intensity distribution enclosed within the cell boundaries (red lines) indicate a varying level of cell textural irregularity. Scale bars: 10 μm. Detailed statistical information of cell morphology measurements and non-additivity analysis for the studied gene pairs can be found in Extended Data 8.

References

    1. Weldy C. S. & Ashley E. A. Towards precision medicine in heart failure. Nat. Rev. Cardiol. 1–18 (2021). - PubMed
    1. Sharir T. et al. Ventricular systolic assessment in patients with dilated cardiomyopathy by preload-adjusted maximal power. Validation and noninvasive application. Circulation 89, 2045–2053 (1994). - PubMed
    1. Bastos M. B. et al. Invasive left ventricle pressure–volume analysis: overview and practical clinical implications. Eur. Heart J. 41, 1286–1297 (2019). - PMC - PubMed
    1. Udelson J. E. 3rd, Bacharach R. O. C., Rumble S. L., T. F. & Bonow R. O. Beta-adrenergic stimulation with isoproterenol enhances left ventricular diastolic performance in hypertrophic cardiomyopathy despite potentiation of myocardial ischemia. Comparison to rapid atrial pacing. Circulation 79, 371–382 (1988). - PubMed
    1. Burkhoff D., Mirsky I. & Suga H. Assessment of systolic and diastolic ventricular properties via pressure-volume analysis: a guide for clinical, translational, and basic researchers. American Journal of Physiology-Heart and Circulatory Physiology 289, H501–H512 (2005). - PubMed

Publication types

LinkOut - more resources