[Preprint]. 2024 Aug 27:2023.11.22.568336.
doi: 10.1101/2023.11.22.568336.

Preventing evolutionary rescue in cancer

Affiliations

Preventing evolutionary rescue in cancer

Srishti Patil et al. bioRxiv. .

Abstract

First-line cancer treatment frequently fails due to initially rare therapeutic resistance. An important clinical question is then how to schedule subsequent treatments to maximize the probability of tumour eradication. Here, we provide a theoretical solution to this problem by using mathematical analysis and extensive stochastic simulations within the framework of evolutionary rescue theory to determine how best to exploit the vulnerability of small tumours to stochastic extinction. Whereas standard clinical practice is to wait for evidence of relapse, we confirm a recent hypothesis that the optimal time to switch to a second treatment is when the tumour is close to its minimum size before relapse, when it is likely undetectable. This optimum can lie slightly before or slightly after the nadir, depending on tumour parameters. Given that this exact time point may be difficult to determine in practice, we study windows of high extinction probability that lie around the optimal switching point, showing that switching after the relapse has begun is typically better than switching too early. We further reveal how treatment dose and tumour demographic and evolutionary parameters influence the predicted clinical outcome, and we determine how best to schedule drugs of unequal efficacy. Our work establishes a foundation for further experimental and clinical investigation of this evolutionarily-informed "extinction therapy" strategy.

Keywords: cancer treatment; evolutionary rescue; evolutionary therapy; mathematical oncology; therapeutic resistance.


Figures

Figure 1:
Figure 1:
A schematic describing the deterministic analytical model. Part 1 (left) shows the ODE population growth model during the first treatment (in E1). Part 2 (right) uses input from the ODE model and evolutionary rescue theory to calculate extinction probabilities if the second treatment is given at time τ. The solid curve shows the population trajectory when only treatment 1 is applied. Sensitive cells are denoted by S. Cells resistant to treatment 1(2) and sensitive to treatment 2(1) are denoted by R1(R2). Cells resistant to both treatments are denoted by R1,2. The per capita rate of acquiring resistance to treatment 1(2) is denoted by μ1(μ2). Growth rates gS for sensitive cells and gR for resistant cells depend on the intrinsic birth rate, intrinsic death rate and the cost of resistance (see Table 1). The treatment-induced death rate is denoted by δ1. Initial conditions are specified by the initial population sizes of S, R1, R2 and R1,2 cells. The total initial population N(0) is the sum of these four subpopulations.
Figure 2:
Figure 2:
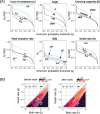
(A) Comparing stochastic simulation results (dots) to analytical estimates (solid line) of extinction probabilities PE(τ) for different values of N(τ) implemented before reaching Nmin (black) and after crossing Nmin (blue). Red dashed lines show the expected Nmin (calculated with the analytical model). Results for two treatment levels are shown (rows). Columns show results with different values for the parameter c (cost of resistance) and R2(0) (initial R2 population size). The default parameter set is given in Table 1. Extinction probabilities from simulations are computed using the outcomes of 100 independent runs, each with several switching points. Switching sizes smaller than Nmin are equivalent to the absence of a second treatment, and result in extinction probabilities equal to zero (black points to the left of red dashed lines). Error bars show 95% binomial proportion confidence intervals. In the first column, labels (1) and (2) correspond to curves in Figure 3(C). (B) An illustration of switching points before and after Nmin, implemented with the same random seed. See Appendix A.6 for a description of the algorithm for these simulations. (C) Nqvs q plots for four parameter sets and different treatment levels. Black curves show before-nadir switching points, and blue curves show after-nadir switching points. Labels indicate treatment levels δ1=δ2. The same line style (solid, dashed, dotted, mixed) is used for a given treatment level for both before and after nadir curves.
Figure 3:
Figure 3:
(A) Heatmaps (obtained from the analytical model) showing high-PE regions (≥ 0.8) for different combinations of treatment levels δ1 and δ2. The default case is shown on the left, and the case with no cost of resistance and no initial R2 population is on the right. For each case, both before-nadir and after-nadir switching points are considered. White lines indicate optimal extinction probability contours. (B) Extinction probabilities for two combinations of treatment levels where δ1δ2. Dots show simulation results and solid lines indicate analytical model predictions. Extinction probabilities are obtained from 100 paired simulations with different random seeds. Error bars show 95% binomial proportion confidence intervals. (C) Nqvs q plots for the default case and the case with no cost of resistance and no initial R2 population. In both cases, four treatment dose combinations are shown (labels refer to treatment combinations shown in (B) and Fig 2(A)). Black(blue) lines show before(after)-nadir switching points. The same line style (solid, dashed, dotted, mixed) is used for a given treatment level for both before and after nadir curves.
Figure 4:
Figure 4:
Effects of varying parameter values or initial conditions. (A) Nqversus q plots for several parameters and initial conditions. The x-axes show extinction probability threshold q, and y-axes are the (normalised) Nqbefore (black) and Nqafter (blue) values. The only plot which is not normalised by the initial population is the one showing variation in PE with N(0) (second row, second panel), assuming a constant proportion of initial resistant cells. The title of each plot indicates the parameter or initial condition that varies across curves. Solid curves correspond to the default parameter values (Table 1), and the same line style (solid, dashed, dotted, mixed) is used for both before and after nadir curves. In the first and last panels showing variation with changing cost of resistance and death rate, respectively, values beyond 0.9 and 0.5 are not considered since the resistant cell growth rate becomes negative. (B) Heatmap of high-PE regions for different parameter values in b-d space. Only non-negative growth rates (excluding the effects of treatment) are considered (dbc, solid black line). The dashed black line indicates the set of birth and death rates corresponding to our default growth rate (bd=gS=0.9). Solid white lines show optimal extinction probability contours.
Figure 5:
Figure 5:
Time windows of high extinction probability (solid lines obtained from the analytical model and dots with 95% confidence intervals from 100-replicate Gillespie runs). Each subplot shows extinction probability trajectories under different modifications of the default parameter values. Population sizes are shown in the coloured bar, and the dotted red line shows when the nadir is achieved in the absence of a second strike.

References

    1. Iwasa Yoh, Nowak Martin A, and Michor Franziska. “Evolution of Resistance During Clonal Expansion”. In: Genetics 172.4 (Apr. 2006), pp. 2557–2566. ISSN: 1943–2631. - PMC - PubMed
    1. Pressley Mariyah et al. “Evolutionary Dynamics of Treatment-Induced Resistance in Cancer Informs Understanding of Rapid Evolution in Natural Systems”. In: Frontiers in Ecology and Evolution 9 (2021). ISSN: 2296–701X. URL: https://www.frontiersin.org/articles/10.3389/fevo.2021.681121 (visited on 03/30/2023). - DOI
    1. Greaves Mel and Maley Carlo C.. “Clonal evolution in cancer”. en. In: Nature 481.7381 (Jan. 2012). Number: 7381 Publisher: Nature Publishing Group, pp. 306–313. ISSN: 1476–4687. DOI: 10.1038/nature10762. URL: https://www.nature.com/articles/nature10762 (visited on 09/01/2022). - DOI - PMC - PubMed
    1. Korolev Kirill S., Xavier Joao B., and Gore Jeff. “Turning ecology and evolution against cancer”. en. In: Nature Reviews Cancer 14.5 (May 2014), pp. 371–380. ISSN: 1474–1768. - PubMed
    1. Enriquez-Navas Pedro M., Wojtkowiak Jonathan W., and Gatenby Robert A.. “Application of Evolutionary Principles to Cancer Therapy”. In: Cancer Research 75.22 (Nov. 2015), pp. 4675–4680. ISSN: 0008–5472. DOI: 10.1158/0008-5472.CAN-15-1337. eprint: https://aacrjournals.org/cancerres/article-pdf/75/22/4675/2937393/4675.pdf. URL: 10.1158/0008-5472.CAN-15-1337. - DOI - DOI - PMC - PubMed

Publication types