[Preprint]. 2023 Nov 21:2023.11.20.563479.
doi: 10.1101/2023.11.20.563479.

Two-dose "extended priming" immunization amplifies humoral immune responses by synchronizing vaccine delivery with the germinal center response

Affiliations

Two-dose "extended priming" immunization amplifies humoral immune responses by synchronizing vaccine delivery with the germinal center response

Sachin H Bhagchandani et al. bioRxiv. .

Update in

Abstract

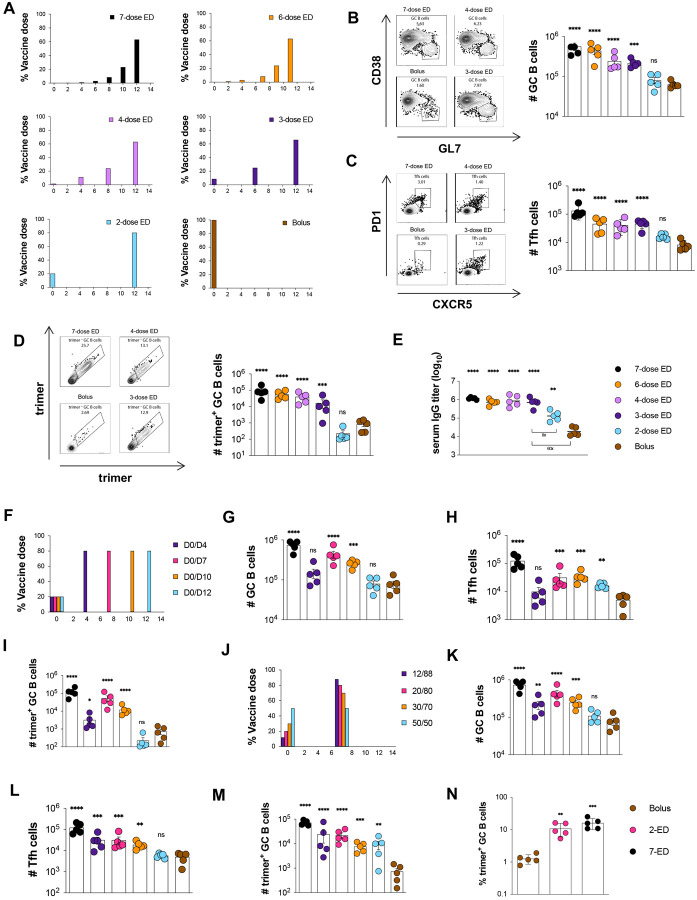
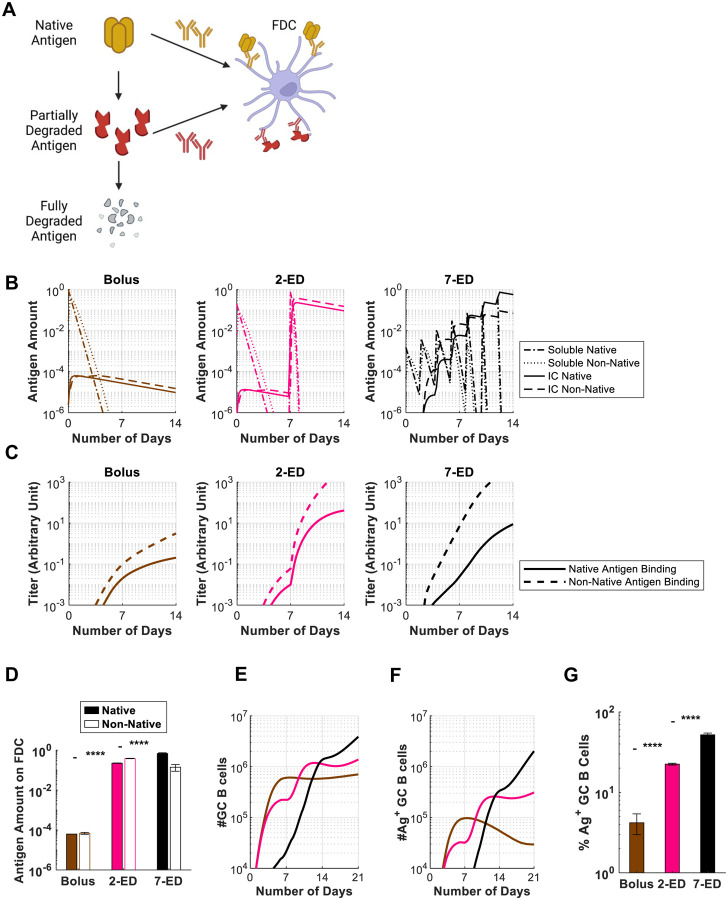
"Extended priming" immunization regimens that prolong exposure of the immune system to vaccines during the primary immune response have shown promise in enhancing humoral immune responses to a variety of subunit vaccines in preclinical models. We previously showed that escalating-dosing immunization (EDI), where a vaccine is dosed every other day in an increasing pattern over 2 weeks dramatically amplifies humoral immune responses. But such a dosing regimen is impractical for prophylactic vaccines. We hypothesized that simpler dosing regimens might replicate key elements of the immune response triggered by EDI. Here we explored "reduced ED" immunization regimens, assessing the impact of varying the number of injections, dose levels, and dosing intervals during EDI. Using a stabilized HIV Env trimer as a model antigen combined with a potent saponin adjuvant, we found that a two-shot extended-prime regimen consisting of immunization with 20% of a given vaccine dose followed by a second shot with the remaining 80% of the dose 7 days later resulted in increased total GC B cells, 5-10-fold increased frequencies of antigen-specific GC B cells, and 10-fold increases in serum antibody titers compared to single bolus immunization. Computational modeling of the GC response suggested that this enhanced response is mediated by antigen delivered in the second dose being captured more efficiently as immune complexes in follicles, predictions we verified experimentally. Our computational and experimental results also highlight how properly designed reduced ED protocols enhance activation and antigen loading of dendritic cells and activation of T helper cells to amplify humoral responses. These results suggest that a two-shot priming approach can be used to substantially enhance responses to subunit vaccines.


Conflict of interest statement

Competing interests S.H.B, D.J.I, A.K.C, and L.Y are inventors on a patent filing related to the extended-priming regimens described in this manuscript. For completeness, it is also noted that A.K.C. is a consultant (titled “Academic Partner”) for Flagship Pioneering, consultant and Strategic Oversight Board Member of its affiliated company, Apriori Bio, and is a consultant and Scientific Advisory Board Member of another affiliated company, Metaphore Bio.

Figures

Figure 1.
Figure 1.. An optimally designed two-shot extended-prime vaccination substantially enhances GC responses to subunit vaccines compared to bolus immunization.
(A) Schematic of escalating dose vaccination regimens with varying dose number. (B-E) C57BL/6J mice (n=5 animals/group) were immunized with 10 μg N332-GT2 trimer and 5 μg SMNP adjuvant according to the dosing schemes in (A). GC responses were evaluated on day 14 by flow cytometry and antibody responses by ELISA on day 28. Shown are representative flow cytometry histograms and cell counts for total GC B cells (B), Tfh (C), and trimer-specific GC B cells (D) at day 14, and trimer-specific serum IgG titers at day 28 (E). (F) Schematic of dosing schedules tested for two-shot ED regimens. (G-I) C57BL/6J mice (n=5 animals/group) were immunized with 10 μg N332-GT2 trimer and 5 μg SMNP adjuvant according to the dosing schemes in (F), and total GC B cells (G), Tfh cells (H), and trimer-specific GC B cells (I) were analyzed by flow cytometry on day 14. Note: Bolus and 7-dose ED comparisons are also shown with black and brown colors respectively. (J) Schematic of dosing ratios evaluted for for 2-shot ED immunization. (I-M) C57BL/6J mice (n=5 animals/group) were immunized with 10 μg N332-GT2 trimer and 5 μg SMNP adjuvant according to the dosing schemes in (J), and total GC B cells (K), Tfh cells (L), and trimer-specific GC B cells (M) were analyzed by flow cytometry on day 14. (N) Frequencies of GC B cells recognizing intact trimer antigen for bolus, optimized 2-ED, and 7-ED regimens. Points represent responses of individual animals while bars indicate mean± s.e.m. Shown are data from one representative of two independent experiments for each immunization series. ****, p < 0.0001; ***, p < 0.001; **, p < 0.01; *, p < 0.05; ns, not significant; by one-way ANOVA with Dunnett’s multiple comparison post test compared to bolus immunization.
Figure 2.
Figure 2.. Optimized 2-shot prime immunization amplifies the GC response and trimer-specific serum antibody titers over time compared to bolus immunization.
(A) Schematic of dosing schemes. (B-H) C57BL/6J mice (n=9 animals/group) were immunized with 10 μg N332-GT2 trimer and 5 μg SMNP adjuvant according to the dosing schemes in (A). GC responses were evaluated on days 7, 14, 21, and 28 by flow cytometry and antibody responses by ELISA on days 3, 7, 14, 21, and 28. Shown are trimer-specific B cell counts (B), GC B cell counts (C), Tfh cell counts (D), trimer-specific GC B cell counts (E), plasmablast counts (F), trimer-specific IgM titers (G), and trimer-specifc IgG titers (H), plotted over time for bolus and 2-ED regimens. Shown are data from one independent experiment for each immunization series. ****, p < 0.0001; ***, p < 0.001; **, p < 0.01; *, p < 0.05; ns, not significant; by two-way ANOVA with Dunnett’s multiple comparison post test compared to bolus immunization.
Figure 3.
Figure 3.. In Silico modeling predicts enhanced T cell priming with extended-prime immunization, consistent with experimental measurements of DC antigen acquisition and activation in draining lymph nodes.
(A-F) Computational model of vaccine uptake by dendritic cells and helper T cell priming. (A) Schematic outlining elements of the kinetic model. (B-E) Modeling predictions of the number of (B) total DCs (B), Ag+Adj+ DCs (C), Ag-specific T cells (D), and Tfh cells (E) for bolus, 2-ED, or 7-ED immunization regimens. (F) Comparing Tfh cell count predicted by the model with the experimental data at day 14. (G-J) Experimental analysis of lymph node DC antigen uptake and activation. C57BL/6J mice (n=3 animals/group) were immunized with 10 μg Cy5 dye-labled-N332-GT2 trimer and 5 μg SMNP adjuvant according to the dosing schemes shown in (G), and DCs in draining lymph nodes were analyzed by flow cytometry on days indicated by arrows. Shown are number of DCs (H), representative histograms of trimer antigen fluorescence and CD86 expression by CD11c+ DCs (I), and number of trimer+CD86+ DC counts over time for bolus, 2-ED, and 7-ED immunization regimens (J).
Figure 4.
Figure 4.. In Silico modeling predicts increased intact antigen accumulation on FDCs for extended dosing compared to bolus immunization.
(A) Schematic showing antigen fates considered in the computational model. (B) In silico prediction of the levels of free antigen in lymph nodes over time in an intact (“soluble native”) or degraded (“soluble non-native”) state, and amounts of native and non-native antigen captured on FDCs in the form of immune complexes (“IC”) over time. The antigen amounts are normalized to the total antigen dose in immunization. (C) Antibody titers predicted by the in silico model for bolus, 2-ED, and 7-ED immunization regimens. In the simulation, antibody titers are defined as the concentration of antibodies weighted by their affinities, reflecting their capabilities to bind to the antigen. (D) Comparison of predicted antigen amounts accumulated on FDCs after the final shot from each dosing scheme, normalized to the total antigen dose in immunization. (E) Model prediction for the number of GC B cells over time. (F, G) Model prediction for the number of native antigen-binding (i.e. trimer+) GC B cells over time (F) and frequency of trimer+ GC B cells at day 21 (G) from bolus, 2-ED, and 7-ED immunization schemes. The results reported are mean values from 10 independent stochastic simulations of the lymph node. ****, p < 0.0001; by one-way ANOVA with Tukey’s multiple comparison post test.
Figure 5.
Figure 5.. Two-dose extended prime immunization enables antigen capture of the second shot on FDCs.
(A-B) Groups of C57Bl/6 mice (n=3 animals/group) were immunized by bolus, 2-ED, or 7-ED regimens as in Fig. 3G followed by collection of lymph nodes for imaging at 48 h after bolus or after the last injection of 2-ED and 7-ED regimens. FDC networks were labeled in situ by s.c. injection of anti-CD35 antibody 16h before tissue collection. Collected tissues were clarified and imaged intact by confocal microscopy; shown are maximum intensity projections from z-stacks through FDC clusters (Scale bars, 150 μm), (A). Alternatively, lymph node sections were stained for FDCs (CD35; blue) and then analyzed by confocal microscopy (Scale bars, 300 μm) to detect co-localization with Cy5-labeled N332-GT2 (pink), (B). (C-E) Flow cytometry analysis of LN cells (n=3 pools/group, with each pool containing six LNs from 3 mice) isolated 48 hr after the final injection following immunization with fluorescently labeled N332-GT2 (10 ug) and SMNP (5 ug) using either bolus, 2-ED, or 7-ED dosing regimens. Shown are representative histograms of antigen intensities among LN cells (C), frequencies of trimer+ FDCs (D), and the mean trimer fluorescence intensity among trimer+ FDCs (E) for the indicated immunization conditions. Shown are data from one independent experiment for each immunization series. ****, p < 0.0001; ***, p < 0.001; **, p < 0.01; *, p < 0.05; ns, not significant; by one-way ANOVA with Dunnett’s multiple comparison post test compared to bolus immunization.
Figure 6.
Figure 6.. Extending the duration of antigen delivery during the second dose of 2-ED vaccination increases native antigen capture on FDCs and antigen-specific GC responses.
(A-I) Computational modeling of GC responses elicited by 2-ED dosing administered as two bolus doses vs. a bolus on day 0 and a prolonged antigen delivery at day 7 (“dose 2 extended”). (A) Schematic of 2-ED vs. “dose 2 extended” vaccination regimens. (B, C) Amounts of free and immune-complexed native or degraded (“non-native”) antigen in the LN over time (B) and serum antibody titers recognizing native vs. non-native antigen (C) for the “dose 2 extended” regimen. (D–F) In silico prediction of antigen captured on FDCs (D), total GC B cells at day 21 (E), and frequency of trimer-binding GC B cells at day 21 (F) for bolus, 2-ED, and “dose 2 extended” vaccination regimens. (G-I) In silico prediction of proportions of intact vs. degraded antigen captured by FDCs (G), total number of GC B cells (H), and the fraction of GC B cells that are native vs. non-native antigen-binding (I) at day 21 as a function of the duration of antigen release used in “dose 2 extended” vaccination. (J-O) Experimental testing of “dose 2 extended” immunizations using alum-anchored immunogens. (J) Schematic demonstrating anchoring trimer immunogen onto alum via phosphoserine linkers (Alum-pSer). (K-O) C57Bl/6J mice (n=5 animals/group) were immunized with 10 μg MD39 trimer (either soluble bound to 50 μg alum) and 5 μg SMNP adjuvant as in Fig. 3G. Shown are the numbers of GC B cells (K) and Tfh cells (L), representative histograms of trimer staining of GC B cells (M), frequencies of trimer-binding GC B cells (N), and the number of trimer-binding GC B cells (O), for the different dosing regimens determined by flow cytometry at day 14. Shown are data from one representative of two independent experiments for each immunization series. ****, p < 0.0001; ***, p < 0.001; **, p < 0.01; *, p < 0.05; ns, not significant; by one-way ANOVA with Dunnett’s multiple comparison post test compared to bolus immunization.

References

    1. Barouch D. H., Covid-19 Vaccines — Immunity, Variants, Boosters. New Engl J Med. 387, 1011–1020 (2022). - PMC - PubMed
    1. Lee J. H., Crotty S., HIV vaccinology: 2021 update. Semin Immunol. 51, 101470 (2021). - PMC - PubMed
    1. Haynes B. F., Wiehe K., Borrow P., Saunders K. O., Korber B., Wagh K., McMichael A. J., Kelsoe G., Hahn B. H., Alt F., Shaw G. M., Strategies for HIV-1 vaccines that induce broadly neutralizing antibodies. Nat Rev Immunol. 23, 142–158 (2023). - PMC - PubMed
    1. Feinberg M. B., Uhambo — Twists and Turns on the Journey to an Efficacious HIV-1 Vaccine. New Engl J Med. 384, 1157–1159 (2021). - PubMed
    1. Burton D. R., Hangartner L., Broadly Neutralizing Antibodies to HIV and Their Role in Vaccine Design. Annu. Rev. Immunol. 34, 635–659 (2016). - PMC - PubMed

Publication types