[Preprint]. 2023 Nov 21:2023.11.21.568047.
doi: 10.1101/2023.11.21.568047.

Host-derived oxidized phospholipids initiate effector-triggered immunity fostering lethality upon microbial encounter

Affiliations

Host-derived oxidized phospholipids initiate effector-triggered immunity fostering lethality upon microbial encounter

Marco Di Gioia et al. bioRxiv. .

Abstract

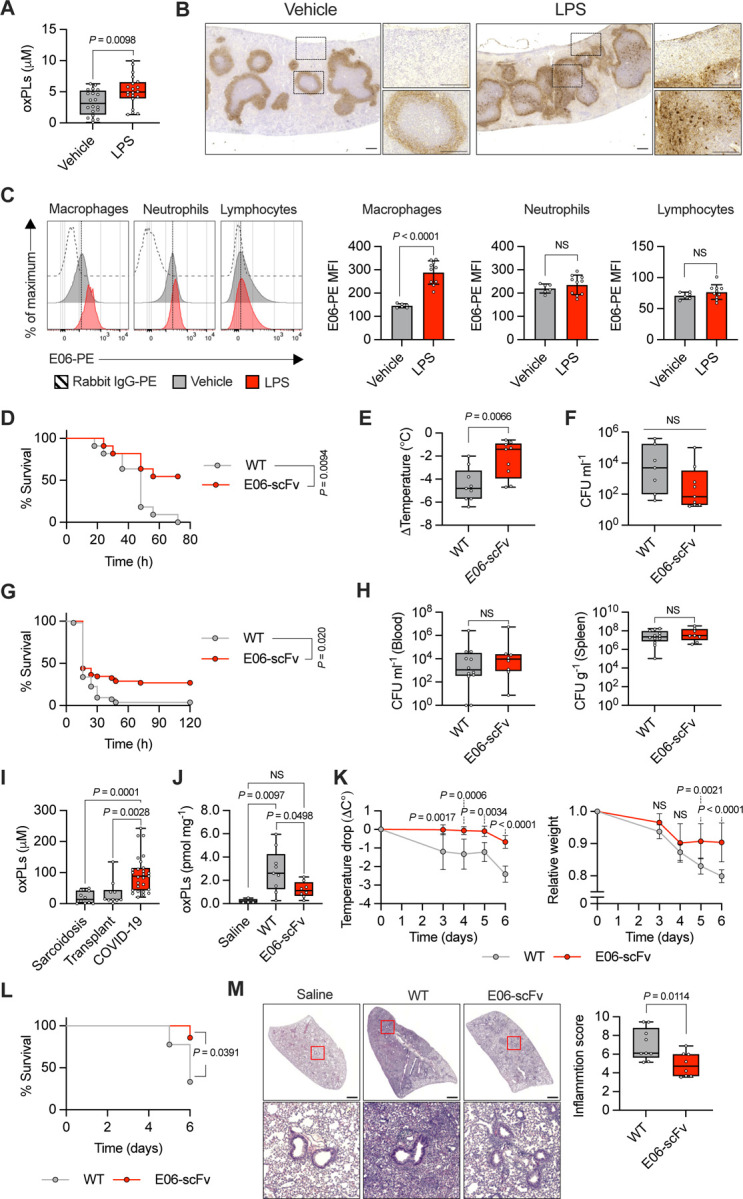
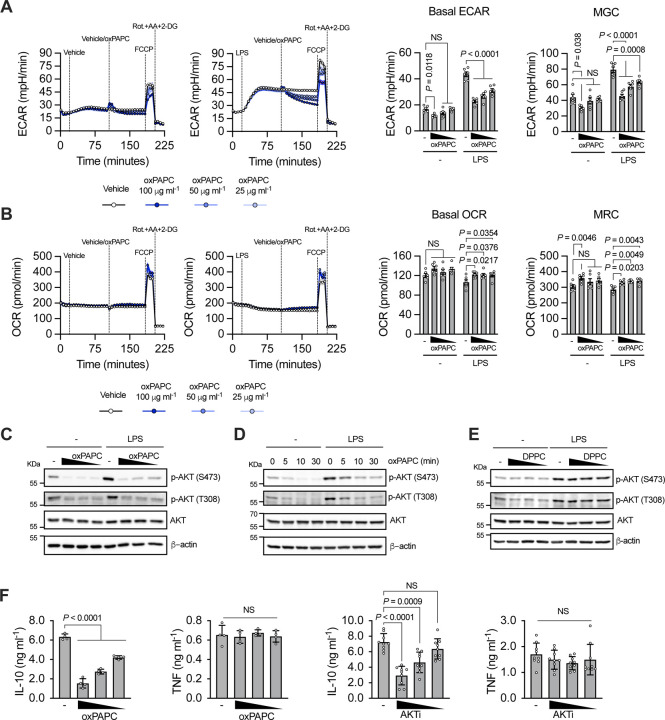
Macrophages detect invading microorganisms via pattern recognition receptors that recognize pathogen-associated molecular patterns, or via sensing the activity of virulence factors that initiates effector-triggered immunity (ETI). Tissue damage that follows pathogen encounter leads to the release of host-derived factors that participate to inflammation. How these self-derived molecules are sensed by macrophages and their impact on immunity remain poorly understood. Here we demonstrate that, in mice and humans, host-derived oxidized phospholipids (oxPLs) are formed upon microbial encounter. oxPL blockade restricts inflammation and prevents the death of the host, without affecting pathogen burden. Mechanistically, oxPLs bind and inhibit AKT, a master regulator of immunity and metabolism. AKT inhibition potentiates the methionine cycle, and epigenetically dampens Il10, a pluripotent anti-inflammatory cytokine. Overall, we found that host-derived inflammatory cues act as "self" virulence factors that initiate ETI and that their activity can be targeted to protect the host against excessive inflammation upon microbial encounter.


Figures

Figure 1:
Figure 1:
A) oxPLs quantification in serum of mice treated with vehicle (saline) or LPS (2 mg Kg−1) for 8h. n = 20 mice per group. Graph shows means ± SD. Statistical significance was calculated using two-tailed t test. B) Spleens of mice treated with vehicle (saline) or LPS (2 mg Kg−1) for 24h were immunostained with E06 antibody (brown). Representative photomicrographs are shown. Scale bar = 200 μm. C) Representative histograms (left) and quantification (right) of oxPLs accumulation (E06-PE MFI) in the indicated cell populations of the spleens of mice treated with vehicle (saline) or LPS (2 mg Kg−1) for 24h. n = 6 mice (vehicle), n = 10 mice (LPS). Graphs show means ± SD. Statistical significance was calculated using two-tailed t test. D-F) WT (n = 11) and E06-scFv (n = 11) mice were subjected to CLP. Survival was followed over time. Kaplan–Meier curves with log-rank (Mantel-Cox) test are shown (D). Body temperature loss was measured 8h after surgery (E). Bacteria loads in serum were analyzed 24h after CLP (F). Graphs show means ± SD. Statistical significance was calculated using two-tailed t test. G-H) WT (n = 53) and E06-scFv (n = 52) mice were injected with MRSA (1.8 × 10⁸ CFU/mouse) and monitored for lethality over 120 hours. Kaplan–Meier curves with log-rank (Mantel-Cox) test are shown (G). Bacteria loads in serum (left) and spleen (right) were analyzed 24h after MRSA injection (H). Graphs show means ± SD. Statistical significance was calculated using two-tailed t test. I) oxPLs levels were measured in the BAL of COVID-19 (n = 27) and non-microbially infected (subjects affected by sarcoidosis, n = 10 and transplant, n = 10) patients. Graphs show mean ± SD. Statistical significance was calculated using two-tailed t test. J-M) WT (n = 9) and E06-scFv (n = 8) mice were intratracheally administered with poly(I:C) (2.5 mg Kg−1) or saline (WT, n = 4) daily for 6 days. oxPLs were quantify from lung homogenates. Graph shows means ± SD. Statistical multiple comparisons were calculated by one-way ANOVA and Tukey’s test (J). Body temperature (left) and weight (right) loss were measured at the indicated time points. Graphs show means ± 95% CL. Statistical comparisons were calculated by two-way ANOVA and Sidak’s test (K). Survival was followed over time. Kaplan–Meier curves with log-rank (Mantel-Cox) test are shown (L). Representative H&E images of control (saline) and poly(I:C) WT and E06-scFv treated mice. Scale bar = 1 mm. (left). Histological inflammation score (right). Graph shows means ± SD. Statistical significance was calculated using two-tailed t test (M).
Figure 2:
Figure 2:
A) Scatter plot of transcript fold-change expression with s-value < 0.01 (RNA-seq) in LPS-primed BMDMs treated, or not, with oxPAPC (100 μg ml−1) for 3h (x-axis) or 18h (y-axis). Points correspond to genes. B) BMDMs were primed with LPS (1 μg ml−1) and then treated, or not, with oxPAPC (100 μg ml−1). Il10 mRNA levels were measured at the indicated time points by qPCR. n = 3, statistical significance was calculated using two-way ANOVA and Sidak’s multiple comparisons test. C-E) WT (n =16) and E06-scFv mice (n =10, isotype control n = 10, anti-IL10R) undergoing CLP were treated with anti-IL-10R antibody or isotype control, as indicated. Survival was followed over time. Kaplan–Meier curves with log-rank (Mantel-Cox) test are shown (C). (D) Body temperature loss was measured 8h after surgery (left) and bacteria loads in serum were analyzed 24h after CLP (right). Statistical significance was calculated using two-tailed t test. (E) WT and E06-scFv mice undergoing CLP were treated with anti-IL-10R antibody or isotype control, as indicated, and serum levels of IL-10, TNF, IL-1β and IL-6 were analyzed 8h after CLP. n =10 mice per group. Graph show means ± SD. Statistical significance was calculated using two-tailed t test.
Figure 3:
Figure 3:
A) Real-time changes in ECAR (left), basal ECAR and maximal glycolytic capacity (MGC) quantifications (right) of BMDMs untreated or treated with LPS (1 μg ml−1) and then challenged with different doses of oxPAPC, as indicated. B) Real-time changes in OCR (left), basal OCR and maximal respiratory capacity (MRC) quantifications (right) of BMDMs treated as in A. n = 6, graphs are representative of three independent experiments and show means ± SEM. Statistical significance was calculated using two-way ANOVA and Dunnett’s multiple comparisons test. C) BMDMs were primed, or not, with LPS and then stimulated with oxPAPC (100, 50 or 25 μg ml−1). AKT phosphorylation was analyzed after 1h by immunoblotting. D) BMDMs were primed, or not, with LPS and then stimulated with oxPAPC (100 μg ml−1). AKT phosphorylation was analyzed at the indicate time points by immunoblotting. E) BMDMs were primed, or not, with LPS and then treated with DPPC (100, 50 or 25 μM). AKT phosphorylation was analyzed after 1h by immunoblotting. Images are representative of three independent experiments. F) BMDMs were primed with LPS and then stimulated with oxPAPC (100, 50 or 25 μg ml−1) (n = 4) (left) or AKTi (10, 5, 25 μM) (n = 9) (right). IL-10 and TNF production was quantified by ELISA 18h later. Graphs are representative of four independent experiments and show means ± SEM. Statistical multiple comparisons were calculated by two-way ANOVA and Dunnett’s test.
Figure 4.
Figure 4.
A) Human monocytes were primed, or not, with LPS and treated or not with oxPAPC (50, 12 or 12.5 μg ml−1) for 1h. AKT phosphorylation was assessed by immunoblot. Data are representative of three independent experiments. B) ECAR of human monocytes, treated as indicated, was measured using a Seahorse analyzer. oxPAPC was used at 50 μg ml−1. Data are representative of three independent experiments. C) Human monocytes were treated as in A and TNF and IL-10 release was quantified by ELISA after 18h. n = 8, from 4 different donors. Graphs show means ± SEM. Statistical multiple comparisons were calculated by two-way ANOVA and Dunnett’s test. D) Human mo-DCs were primed, or not, with LPS and treated or not with oxPAPC (50, 12 or 12.5 μg ml−1) for 1h. AKT phosphorylation was assessed by immunoblot. Data are representative of three independent experiments. E) ECAR of human mo-DCs, treated as indicated, was measured using a Seahorse analyzer. oxPAPC was used at 50 μg ml−1. Data are representative of three independent experiments. F) Human mo-DCs were treated as in D and TNF and IL-10 release was quantified by ELISA after 18h. n = 10, from 5 different donors. Graphs show means ± SEM. Statistical multiple comparisons were calculated by two-way ANOVA and Dunnett’s test. G) Human macrophages were primed, or not, with LPS and treated or not with oxPAPC (50, 12 or 12.5 μg ml−1) for 1h. AKT phosphorylation was assessed by immunoblot. Data are representative of three independent experiments. H) ECAR of human macrophages was measured using a Seahorse analyzer. oxPAPC was used at 50 μg ml−1. Data are representative of three independent experiments. I) Human macrophages were treated as in G and TNF and IL-10 release was quantified by ELISA after 18h. n = 6, from 3 different donors. Graphs show means ± SEM. Statistical multiple comparisons were calculated by two-way ANOVA and Dunnett’s test. J) Scatter plot of oxPLs and IL-10 levels in plasma of patients with organism-defined sepsis (left, n = 13) and critically ill patients without sepsis (right, n = 14), obtained within 48 hours of admission to the intensive care unit. Plots show results of Spearman’s rank correlation tests and a linear regression line with 95% confidence intervals.
Figure 5:
Figure 5:
A-E) WT and Tlr4−/− (A), Tlr2−/− (B), Cd14−/− (C), Cd36−/− (D) or Nfe2l2−/− (E) BMDMs were primed, or not, with R848 (1 μg ml−1) (A, C) or LPS (1 μg ml−1) (B-E) and treated or not with oxPAPC (100 μg ml−1) for 1h (left, center) or 24h (right). AKT phosphorylation (A-E) or NRF2 accumulation (E) were assessed by immunoblot (left). Data are representative of three independent experiments. ECAR (center) was measured using a Seahorse analyzer. n = 6 (A-C, E), n = 5 (D), data are representative of three independent experiments and show means ± SEM. Statistical multiple comparisons were calculated by two-way ANOVA and Tukey’s test. IL-10 and TNF release (right) was quantified by ELISA. n = 3, graphs are representative of three independent experiments and show means ± SEM. Statistical multiple comparisons were calculated by two-way ANOVA and Tukey’s test. F) oxPAPC binding capacity of AKT was determined by pull down assay. Cellular lysate of 293T cells expressing HA-tagged human AKT1 was incubated with oxPAPE-N-Biotin and the indicated doses of oxPAPC. AKT associated with biotinylated lipids was captured by streptavidin beads and revealed by immunoblotting using anti-HA antibody. β-actin was used as a negative control. Data are representative of three independent experiments. G) Microscale thermophoresis (MST) analysis of oxPAPC and AKT interactions. Traces of fluorescently labeled human recombinant AKT1 incubated with oxPAPC (1000, 500, 250,125, 62.5, 31.25, 15.62, 7.8, 3.9, 1.9, 0.97, 0.488, 0.24, 0.12, 0.0061 and 0.030 μM) or DPPC (500, 250,125, 62.5, 31.25, 15.62, 7.8, 3.9, 1.9, 0.97, 0.488, 0.24, 0.12, 0.0061 and 0.030 μM) (left and central). oxPAPC-AKT binding curve was derived from the quantification of normalized fluorescence changes (right). n = 3, graph shows means ± SD. Images are representative of three independent experiments. H) Cellular lysate of 293T cells expressing the indicated HA-tagged AKT1 truncated forms were incubated with oxPAPE-N-Biotin. HA-proteins associated with biotinylated lipid were captured by streptavidin beads and revealed by immunoblotting. Data shown are representative of three independent experiments. I) Active human recombinant AKT1 or PDK1 were incubated with oxPAPC or DPPC (1000, 500, 250,125, 62.5, 31.25, 15.62, 7.8, 3.9, and 1.9 μM) and kinase-specific FRET-peptide substrates (Z-’LYTE). Kinase inhibition was measured as the ability of lipid to block substrate phosphorylation. n = 4, graph shows means ± SD. Data are representative of three independent experiments.
Figure 6.
Figure 6.
A-C) BMDMs were primed, or not, with LPS (1 μg ml−1) treated or not with oxPAPC (100 μg ml−1) or AKTi (10 μM). Mass-spectrometry polar metabolomics analysis was performed 3h later. sPLS-DA plot showing the effect on variance during oxPAPC (A) or AKTi (B) treatments. Each point represents an independent biological sample. KEGG pathway enrichment analysis of the indicated treatments (C). D) Schematic showing the interconnection between methionine cycle and histone methylation processes. E) BMDMs were primed with LPS and then stimulated with oxPAPC (100 μg ml−1) (n = 3) (left) or AKTi (10 μM) (n = 3) (right). Volcano plots show the change of polar metabolites after 3h. F) BMDMs were treated as in E and EZH2 phosphorylation was measured by flow cytometry after 1h. Left: cytofluorimetry histograms. Right: bar graphs. Bars represent the MFI of p-EZH2. n = 3, graph shows means ± SEM. Statistical multiple comparisons were calculated by two-way ANOVA and Tukey’s test. Data are representative of three independent experiments.
Figure 7:
Figure 7:
A) BMDMs were primed, or not, with LPS and then stimulated with oxPAPC (100 μg ml−1). Chromatin immunoprecipitation and quantitative PCR (ChIP–qPCR) of H3K27me2me3 at CNS regions related to the Il10 locus (indicated in the scheme), was performed 3h later. Hoxc10 and Gapdh were used as positive and negative controls, respectively. n = 3 independent immunoprecipitations, graphs show means ± SEM. Statistical significance was calculated using two-way ANOVA. B) BMDMs were incubated with GSK343 (10 μM) for 30 minutes, primed with LPS and then stimulated with oxPAPC (100 μg ml−1). IL-10 and TNF production was quantified by ELISA after 18h. n = 6, graphs are representative of four independent experiments and show means ± SEM. Statistical multiple comparisons were calculated by two-way ANOVA and Tukey’s test. C-F) WT mice (n = 10) were treated with GSK343 and subjected to CLP. Survival was followed over time. Kaplan–Meier curves with log-rank (Mantel-Cox) test are shown (C). Body temperature loss was measured 8h later after surgery (D). Serum levels of IL-10, TNF, IL-1β and IL-6 were analyzed 8h after CLP (E). Bacteria loads in serum were analyzed 24h after CLP (F). Statistical significance was calculated using two-tailed t test. G) Schematic showing how oxPLs control IL-10 production by guarding the activity of AKT.

Comment in

References

    1. Brubaker S.W., et al., Innate Immune Pattern Recognition: A Cell Biological Perspective. Annu Rev Immunol, 2015. - PMC - PubMed
    1. Gong T., et al., DAMP-sensing receptors in sterile inflammation and inflammatory diseases. Nat Rev Immunol, 2020. 20(2): p. 95–112. - PubMed
    1. Janeway C.A. Jr., Approaching the asymptote? Evolution and revolution in immunology. Cold Spring Harb Symp Quant Biol, 1989. 54 Pt 1: p. 1–13. - PubMed
    1. Matzinger P., Tolerance, danger, and the extended family. Annu Rev Immunol, 1994. 12: p. 991–1045. - PubMed
    1. Medzhitov R., Approaching the asymptote: 20 years later. Immunity, 2009. 30(6): p. 766–75. - PubMed

Publication types

LinkOut - more resources