[Preprint]. 2023 Nov 21:2023.11.20.567272.
doi: 10.1101/2023.11.20.567272.

A novel thin plate spline methodology to model tissue surfaces and quantify tumor cell invasion in organ-on-chip models

Affiliations

A novel thin plate spline methodology to model tissue surfaces and quantify tumor cell invasion in organ-on-chip models

Elizabeth Elton et al. bioRxiv. .

Update in

Abstract

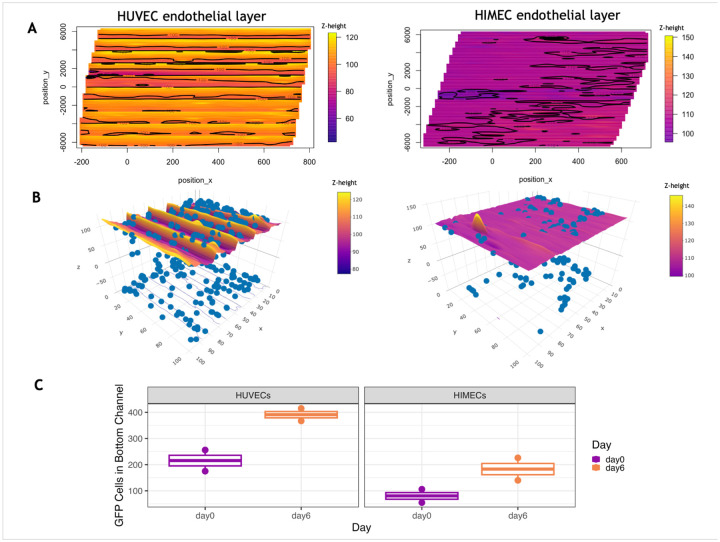
Organ-on-chip (OOC) models can be useful tools for cancer drug discovery. Advances in OOC technology have led to the development of more complex assays, yet analysis of these systems does not always account for these advancements, resulting in technical challenges. A challenging task in the analysis of these two-channel microfluidic models is to define the boundary between the channels so objects moving within and between channels can be quantified. We propose a novel imaging-based application of a thin plate spline method - a generalized cubic spline that can be used to model coordinate transformations - to model a tissue boundary and define compartments for quantification of invaded objects, representing the early steps in cancer metastasis. To evaluate its performance, we applied our analytical approach to an adapted OOC developed by Emulate, Inc., utilizing a two-channel system with endothelial cells in the bottom channel and colorectal cancer (CRC) patient-derived organoids (PDOs) in the top channel. Initial application and visualization of this method revealed boundary variations due to microscope stage tilt and ridge and valley-like contours in the endothelial tissue surface. The method was functionalized into a reproducible analytical process and web tool - the Chip Invasion and Contour Analysis (ChICA) - to model the endothelial surface and quantify invading tumor cells across multiple chips. To illustrate applicability of the analytical method, we applied the tool to CRC organoid-chips seeded with two different endothelial cell types and measured distinct variations in endothelial surfaces and tumor cell invasion dynamics. Since ChICA utilizes only positional data output from imaging software, the method is applicable to and agnostic of the imaging tool and image analysis system used. The novel thin plate spline method developed in ChICA can account for variation introduced in OOC manufacturing or during the experimental workflow, can quickly and accurately measure tumor cell invasion, and can be used to explore biological mechanisms in drug discovery.


Figures

Figure 1.
Figure 1.
Workflow schematic. Multiple OOCs are seeded with GFP+ colorectal cancer patient-derived organoids in the top channel and RPF+ endothelial cells in the bottom channel and imaged on a high content imaging platform. Image analysis is performed to extract positional and morphological data for each cell type. Data analysis is performed using novel methodology and the Chip invasion and Contour Analysis web tool (ChICA) to quantify tumor cell invasion.
Figure 2.
Figure 2.
Endothelial surface modelling using topographical method enhances data extraction from high-throughput OOC experiments. (A) The topographical surface method is applied to an OOC seeded with HUVECs and imaged on day 0. A surface is generated by fitting a thin plate spline to positional endothelial data and is visualized in 2-D, with x and y position shown on the x and y axes and z-height shown using a gradual color scale. The surface demonstrates wave-like contours and a gradual decline in z-height from high x positions to low x positions. (B) The topographical surface method from A is compared to the use of a flat surface to quantify tumor invasion. In the flat line method (left), objects that are below the mean z-height plus standard error of the endothelial centroids are labelled as invading. The topographical method (right) labels objects as invading when they are below the endothelial surface plus standard error. In either method, objects labelled as invading are denoted in blue. Objects not labelled as invading are denoted in orange. (C) The topographical surface workflow was built into a publicly available web tool requiring no computational background to use. The user interface of the tool (left) provides options to upload data and visualize results in a table or graph form. The tool includes options to plot invaded tumor cell objects by their x and y position (right upper) and x and z position (right lower) for quality control. These plots captured invaded objects on the edge of the OOC model missed in image analysis quality control, indicated with arrows.
Figure 3.
Figure 3.
The topographical method labels and quantifies invading cells when applied to endothelial layers. (A) The topographical method is applied to OOCs with different endothelial cells and visualized in 2-D, with x and y position shown on the x and y axes and z-height shown using a gradual color scale. The surfaces formed from different endothelial cells demonstrate different contour patterns. The HUVEC endothelial surface (left) shows regular, wave-like contours of a similar height across the surface. The HIMEC endothelial surface (right) demonstrates irregular contours with occasional endothelial objects sitting above or below the center surface. (B) 3-D reconstructions of endothelial surfaces formed from HUVECs (left) or HIMECs (right) showing the boundary used to label tumor cell objects as invading or non-invading. The tumor cells are labeled blue. (C) Numbers of invaded GFP+ tumor cells as measured using the ChICA tool. CRC OOCs with either HUVECs (left) or HIMECs (right) in the endothelial compartment were imaged on day 0 and day 6 of the experiment and invaded cells were identified based on the relative position to the endothelial surface.

References

    1. Ahn J., Sei Y., Jeon N., & Kim Y. (2017). Tumor Microenvironment on a Chip: The Progress and Future Perspective. Bioengineering, 4(4), 64. 10.3390/bioengineering4030064 - DOI - PMC - PubMed
    1. Amini A. A., Chen Yasheng, Curwen R. W., Mani V., & Sun J. (1998). Coupled B-snake grids and constrained thin-plate splines for analysis of 2-D tissue deformations from tagged MRI. IEEE Transactions on Medical Imaging, 17(3), 344–356. 10.1109/42.712124 - DOI - PubMed
    1. Boyd S. K., Ronsky J. L., Lichti D. D., Šalkauskas D., & Chapman M. A. (1999). Joint Surface Modeling With Thin-Plate Splines. Journal of Biomechanical Engineering, 121(5), 525–532. 10.1115/1.2835083 - DOI - PubMed
    1. Caballero D., Kaushik S., Correlo V. M., Oliveira J. M., Reis R. L., & Kundu S. C. (2017). Organ-on-chip models of cancer metastasis for future personalized medicine: From chip to the patient. Biomaterials, 149, 98–115. 10.1016/j.biomaterials.2017.10.005 - DOI - PubMed
    1. Chang W, Cheng J, Allaire J, Sievert C, Schloerke B, Xie Y, Allen J, McPherson J, Dipert A, Borges B (2023). shiny: Web Application Framework for R. R package version 1.8.0, https://github.com/rstudio/shiny, https://shiny.posit.co/

Publication types