. 2023 Nov 17;5(4):478-491.
doi: 10.1007/s42995-023-00202-0. eCollection 2023 Nov.

Comparative analysis of the cardiac structure and transcriptome of scallop and snail, perspectives on heart chamber evolution

Affiliations

Comparative analysis of the cardiac structure and transcriptome of scallop and snail, perspectives on heart chamber evolution

Meina Lu et al. Mar Life Sci Technol. .

Abstract

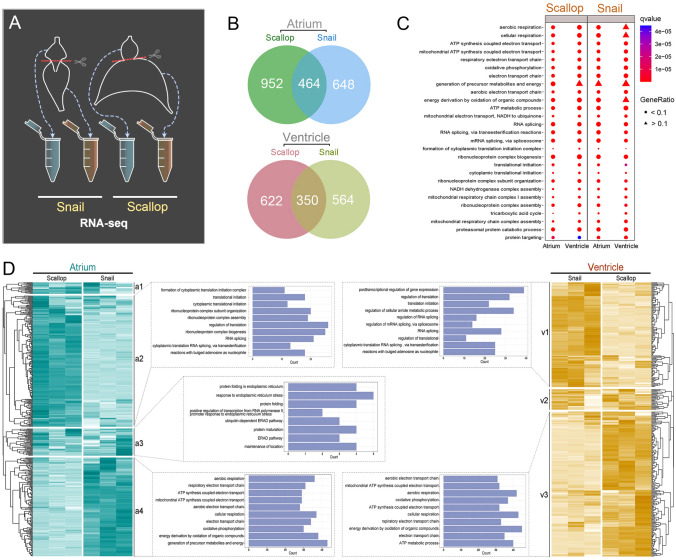
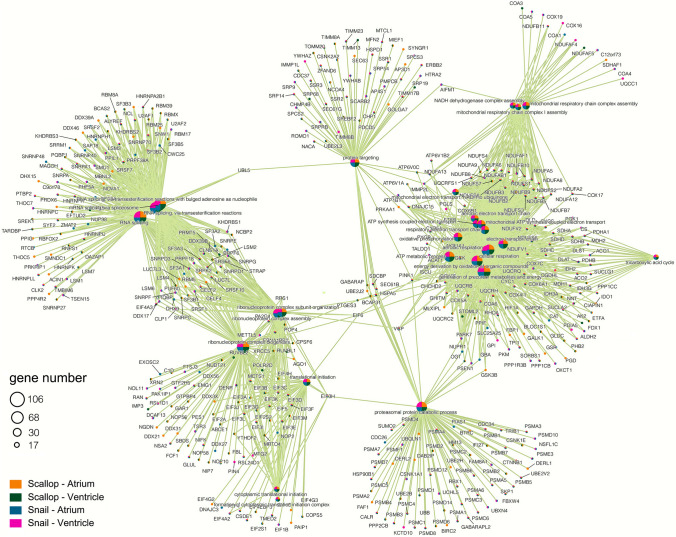
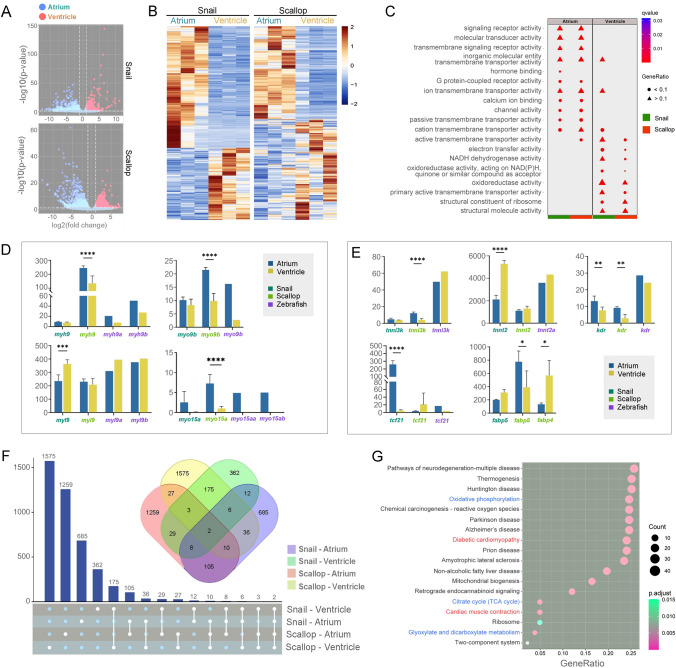
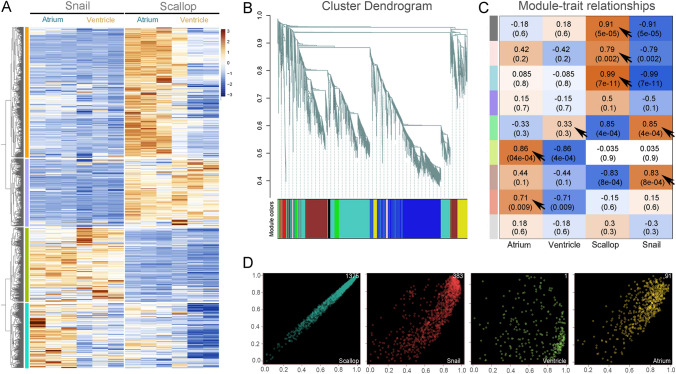
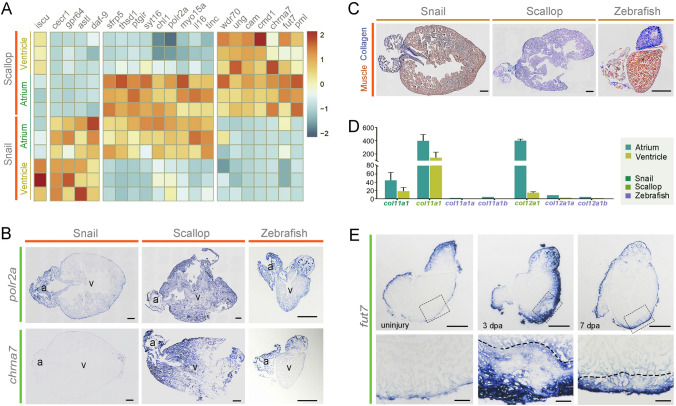
The evolution of a two-chambered heart, with an atrium and a ventricle, has improved heart function in both deuterostomes (vertebrates) and some protostomes (invertebrates). Although studies have examined the unique structure and function of these two chambers, molecular comparisons are few and limited to vertebrates. Here, we focus on the two-chambered protostome heart of the mollusks, offering data that may provide a better understanding of heart evolution. Specifically, we asked if the atrium and ventricle differ at the molecular level in the mollusk heart. To do so, we examined two very different species, the giant African land snail (Lissachatina fulica) and the relatively small, aquatic yesso scallop (Mizuhopecten yessoensis), with the assumption that if they exhibited commonality these similarities would likely reflect those across the phylum. We found that, although the hearts of these two species differed histologically, their cardiac gene function enrichments were similar, as revealed by transcriptomic analysis. Furthermore, the atrium and ventricle in each species had distinct gene function clusters, suggesting an evolutionary differentiation of cardiac chambers in mollusks. Finally, to explore the relationship between vertebrate and invertebrate two-chambered hearts, we compared our transcriptomic data with published data from the zebrafish, a well-studied vertebrate model with a two-chambered heart. Our analysis indicated a functional similarity of ventricular genes between the mollusks and the zebrafish, suggesting that the ventricle was differentiated to achieve the same functions in invertebrates and vertebrates. As the first such study on protostomes, our findings offered initial insights into how the two-chambered heart arose, including a possible understanding of its occurrence in both protostomes and deuterostomes.

Supplementary information: The online version contains supplementary material available at 10.1007/s42995-023-00202-0.

Keywords: Atrium; Heart evolution; Mollusk; RNA sequencing; Ventricle; Zebrafish.


Conflict of interest statement

Conflict of interestThe authors declare no conflicts of interest. Authors Long Zhao and Shi Wang are members of the Editorial Board, but they were not involved in the review of or decision related to this manuscript.

Figures

Fig. 1
Fig. 1
Structures of scallop and snail hearts. A Phylogenetic tree of representative invertebrates and vertebrates, and the diagram of their hearts. B–C’’ HE staining of the snail (B) and scallop (C) heart. Boxed regions in (B) and (C) are shown at higher magnification in (B’B’’) and (C’C’’), respectively. Scale bars for (B) and (C): 1000 μm. Scale bars for (B’B’’) and (C’C’’): 100 μm. DG Immunofluorescence staining with phalloidin (green) and DAPI (blue) in the snail (D, F) and scallop (E, G) heart. Scale bars in D-G: 20 μm. HK Transmission electron microscopy (TEM) images of myocardial fibers in the snail (H, J) and scallop (I, K) heart. Scale bars in H–K: 1 μm
Fig. 2
Fig. 2
Transcriptome expression mapping of each chamber in the snail heart and scallop hearts. A Workflow for the determination of chamber-specific cardiac transcriptome in the snail and scallop. B Venn diagram representing the number of highly expressed genes (HEGs) identified with expression level >  = 50 TPM across the two cardiac chambers in the snail and scallop. C GO enrichment results of these HEGs. D Heatmap of the intersecting HEGs of the snail and scallop. 464 genes in atria and 350 genes in ventricles were included and clustered into distinct groups (a1-4 and v1-3)
Fig. 3
Fig. 3
Gene sets corresponding to different GO terms
Fig. 4
Fig. 4
Analysis of the differentially expressed genes (DEGs) between the atrium and ventricle of the snail and scallop. A Volcano plot illustrating differentially regulated gene expression from RNA-seq analysis between the atrium and ventricle. Genes highly expressed in the atrium or ventricle are shown in blue and red, respectively. B Heatmap of all DEGs in the atrium and ventricle of two species. C GO enrichment of DEGs of snail (green) and scallop (red). D Expression of muscle-related genes in the atrium and ventricle of snail (dark green), scallop (light green), and zebrafish (purple). The X-axis is the gene name, the Y-axis is the expression level (TPM). E Expression of marker genes for major cell types in the heart. F Venn diagram showing the intersection of DEGs in the atrium and ventricle of two species. G KEGG pathway analysis of intersecting genes that screened. The red and blue terms show the pathways related to the heart function and metabolism, respectively
Fig. 5
Fig. 5
Weighted gene co-expression network construction and module preservation analysis. A Heatmap of genes co-expressed in snail and scallop hearts. B Dendrogram of co-expressed genes clustered based on a dissimilarity measure (1-TOM). C Heatmap showing the Pearson correlation of traits with 9 modules identified by WGCNA. The Y-axis corresponds to modules, and the X-axis includes the traits of interest. Associated P values were calculated by the cor.test R function. The color in the heatmap corresponds to the magnitude of the Pearson correlation coefficients. The arrows point to the selected modules. D Scatterplot of module membership vs. gene significance in the selected co-expression module. The upper right corner indicates the number of hub genes, and the lower right corner indicates the corresponding module
Fig. 6
Fig. 6
Expression of candidate cardiac genes in the hearts. A Heatmap of specifically expressed genes in the ventricle and atrium of snail and scallop. B in situ hybridization for polr2a and chrna7 in the hearts of these three species. Scale bars: 500 μm. a, atrium; v, ventricle. C AFOG staining in the hearts of these three species. The heart muscles are stained in orange and collagen in blue color. Scale bars: 500 μm. D Expression of collagen genes in the hearts of these three species. E in situ hybridization for fut7 in the zebrafish hearts during regeneration. Scale bars in the upper panels: 500 μm; scale bars in the lower panels: 100 μm

References

    1. Auman HJ, Coleman H, Riley HE, Olale F, Tsai HJ, Yelon D. Functional modulation of cardiac form through regionally confined cell shape changes. PLoS Biol. 2007;5:e53. doi: 10.1371/journal.pbio.0050053. - DOI - PMC - PubMed
    1. Bettex DA, Pretre R, Chassot PG. Is our heart a well-designed pump? The heart along animal evolution. Eur Heart J. 2014;35:2322–2332. doi: 10.1093/eurheartj/ehu222. - DOI - PubMed
    1. Bini G, Pugliese AM, Pepeu G, Chelazzi G. Neuronal control of the cardiac responses to osmotic stress in the gastropod limpet Patella caerulea. J Exp Zool A Comp Exp Biol. 2006;305:472–479. doi: 10.1002/jez.a.275. - DOI - PubMed
    1. Boogerd CJ, Moorman AF, Barnett P. Protein interactions at the heart of cardiac chamber formation. Ann Anat. 2009;191:505–517. doi: 10.1016/j.aanat.2009.06.004. - DOI - PubMed
    1. Buckett KJ, Peters M, Benjamin PR. Excitation and inhibition of the heart of the snail, Lymnaea, by non-FMRFamidergic motoneurons. J Neurophysiol. 1990;63:1436–1447. doi: 10.1152/jn.1990.63.6.1436. - DOI - PubMed

LinkOut - more resources