. 2023 Oct 3;3(1):vbad134.
doi: 10.1093/bioadv/vbad134. eCollection 2023.

Structome: a tool for the rapid assembly of datasets for structural phylogenetics

Affiliations

Structome: a tool for the rapid assembly of datasets for structural phylogenetics

Ashar J Malik et al. Bioinform Adv. .

Abstract

Summary: Protein structures carry signal of common ancestry and can therefore aid in reconstructing their evolutionary histories. To expedite the structure-informed inference process, a web server, Structome, has been developed that allows users to rapidly identify protein structures similar to a query protein and to assemble datasets useful for structure-based phylogenetics. Structome was created by clustering 94% of the structures in RCSB PDB using 90% sequence identity and representing each cluster by a centroid structure. Structure similarity between centroid proteins was calculated, and annotations from PDB, SCOP, and CATH were integrated. To illustrate utility, an H3 histone was used as a query, and results show that the protein structures returned by Structome span both sequence and structural diversity of the histone fold. Additionally, the pre-computed nexus-formatted distance matrix, provided by Structome, enables analysis of evolutionary relationships between proteins not identifiable using searches based on sequence similarity alone. Our results demonstrate that, beginning with a single structure, Structome can be used to rapidly generate a dataset of structural neighbours and allows deep evolutionary history of proteins to be studied.

Availability and implementation: Structome is available at: https://structome.bii.a-star.edu.sg.


Conflict of interest statement

None declared.

Figures

Figure 1.
Figure 1.
Overview of structural phylogenetics. Protein structures can be obtained from online databases, such as the RCSB PDB. They should be checked for completeness and trimmed or filled as necessary. The software package GESAMT (Krissinel 2012) carries out pairwise structure-based superpositions by aligning vectors representing secondary-structure elements and calculates the Qscore quantifying the quality of the superposition, which depends on the number of amino acid residues in each protein structure that can be superimposed (N1, N2), the Cα RMSD of these residues, and a scaling factor (R0). The Qscore values are converted to distances (1Qscore) and assembled into a distance matrix, which can be used to build a phylogenetic tree showing the evolutionary relationships between the protein structures.
Figure 2.
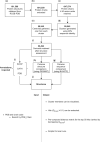
Figure 2.
The Structome database, queries and responses. Protein structures were acquired from RCSB PDB (a), split into individual chains (b) and filtered on protein sequence length, with those longer than 50 amino acids retained (c). The proteins were clustered at 90% sequence identity (d) and cluster centroid structures chosen as representatives of each cluster (e and f). Protein centroids were then pairwise compared to get protein structure similarity and protein sequence similarity (g and h). These data, together with annotations from SCOP, CATH, and the PDB, are included in Structome. The bottom part of the diagram shows how to provide input to Structome using the query format PDB_Chain. The Structome output allows the user to visualize the structures of all members of each cluster superimposed on the cluster centroid, extract centroids with Qscore0.1 compared to the query cluster centroid, and obtain a pre-computed distance matrix in nexus format for the 50 centroids most similar to the query cluster centroid. It is also possible to download scripts to generate distance data locally.
Figure 3.
Figure 3.
The number of centroid pairs with Qscore values greater than a given Qscore cut-off increases rapidly as the cut-off drops. The solid line represents the average number of pairs that score better than a given cut-off. The shaded region represents the amount of variation at each cut-off, for the 55 492 centroids.
Figure 4.
Figure 4.
Histone-fold superposition. (a) Superposition of the structures of PDB ID 4uuz, chain A (red) with the centroid of the cluster to which it belongs (cluster ID 01052), PDB ID 1p3m, chain A (cyan). Of their 136 and 135 amino acids, respectively, 76 can be superimposed. (b) Superposition of the structures of the centroid of cluster 08189, PDB ID 6m4g, chain C (red), and the centroid of cluster 01052, PDB ID 1p3m, chain A (cyan). The Qscore for comparison of these structures is 0.409, and 72 of their 115 and 135 amino acids, respectively, can be structurally aligned; this covers the conserved histone fold (Alva et al. 2007).
Figure 5.
Figure 5.
Histone-fold structural phylogenies of the 50 cluster centroids most structurally similar to centroid 1p3m_A (X.laevis histone H3), the centroid of the cluster to which the query protein (4uuz_A) belongs. (a) Histone-fold phylogeny in the format automatically produced by Structome, coloured by BLASTP E-value as indicated. Each label contains the PDB ID and chain of each cluster centroid, and the query centroid is in orange. (b) A neighbornet network of the histone-fold phylogeny. The query centroid (1p3m_A) is in cyan. Each label contains the PDB ID and chain code followed by a classification obtained from the RCSB PDB or associated literature: H2A, H2B, H3, H4-core histone proteins (solid circles); HMFA, HMFB, HPhA-archaeal histones (diamonds); H-alpha, H-beta, H-gamma-viral histones (hollow circles); TAFF-TATA-Associated Factors; CBC-CCAAT-Box Binding Complex; DBP3, DPB4-DNA Polymerase Binding Protein 3, 4; CHRAC-Chromatin Accessibility Complex; CENP-A, CENP-S, CENP-W-Centromere Protein A, S, W; NC2-Transcription regulator NC2. A comprehensive list of centroids and the taxa from which they derive is available in the Supplementary Material. Departures from tree-likeness in the network indicate the existence of alternative interpretations of the data. The distance matrix was downloaded from Structome and the network was created using SplitsTree (Huson and Bryant 2006), with the compressed protein descriptor and partitions added during post-processing to make the network easily interpretable. The taxa in orange indicate those that are recoverable by BLASTP-based sequence similarity search resulting in E-values below 0.1. The remaining taxa either have very high E-values or are not detectable as hits by BLASTP.

References

    1. Abrescia NG, Bamford DH, Grimes JM. et al. Structure unifies the viral universe. Annu Rev Biochem 2012;81:795–822. - PubMed
    1. Allison JR. Computational methods for exploring protein conformations. Biochem Soc Trans 2020;48:1707–24. - PMC - PubMed
    1. Altschul SF, Gish W, Miller W. et al. Basic local alignment search tool. J Mol Biol 1990;215:403–10. - PubMed
    1. Alva V, Ammelburg M, Söding J. et al. On the origin of the histone fold. BMC Struct Biol 2007;7:17. - PMC - PubMed
    1. Baek M, DiMaio F, Anishchenko I. et al. Accurate prediction of protein structures and interactions using a three-track neural network. Science 2021;373:871–6. - PMC - PubMed