. 2023 Nov 30;5(4):lqad105.
doi: 10.1093/nargab/lqad105. eCollection 2023 Dec.

scPipe: an extended preprocessing pipeline for comprehensive single-cell ATAC-Seq data integration in R/Bioconductor

Affiliations

scPipe: an extended preprocessing pipeline for comprehensive single-cell ATAC-Seq data integration in R/Bioconductor

Shanika L Amarasinghe et al. NAR Genom Bioinform. .

Abstract

scPipe is a flexible R/Bioconductor package originally developed to analyse platform-independent single-cell RNA-Seq data. To expand its preprocessing capability to accommodate new single-cell technologies, we further developed scPipe to handle single-cell ATAC-Seq and multi-modal (RNA-Seq and ATAC-Seq) data. After executing multiple data cleaning steps to remove duplicated reads, low abundance features and cells of poor quality, a SingleCellExperiment object is created that contains a sparse count matrix with features of interest in the rows and cells in the columns. Quality control information (e.g. counts per cell, features per cell, total number of fragments, fraction of fragments per peak) and any relevant feature annotations are stored as metadata. We demonstrate that scPipe can efficiently identify 'true' cells and provides flexibility for the user to fine-tune the quality control thresholds using various feature and cell-based metrics collected during data preprocessing. Researchers can then take advantage of various downstream single-cell tools available in Bioconductor for further analysis of scATAC-Seq data such as dimensionality reduction, clustering, motif enrichment, differential accessibility and cis-regulatory network analysis. The scPipe package enables a complete beginning-to-end pipeline for single-cell ATAC-Seq and RNA-Seq data analysis in R.


Figures

Figure 1.
Figure 1.
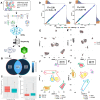
Overview of the scPipe scATAC-Seq module and its QC outputs. (A) The pipeline is shown on the left and the QC metrics gathered during preprocessing are shown on the right. Purple coloured boxes denote the inputs and light colour purple define the inputs that are optionally accepted as they are not incorporated into current scATAC-Seq library preparations yet. Blue colour box depicts the final output. Black boxes denote the main pipeline steps that should be followed. Green boxes denote the steps that are running within these the main pipeline without having to call them specifically, still can also be called separately if needed. (B) QC plot showing the separation of ‘cell’ and ‘non-cell’ based on the fraction of fragments overlappping peaks (y-axis) vs total number of fragments (x-axis) after cell calling step of scPipe. (C) QC plot showing the separation of cell and ‘non-cell’ based on read density (y-axis) versus total number of fragments (x-axis) after cell calling step of scPipe. (D) QC plot showing the fraction of features overlapping different functional regions (i.e., Peaks, TSS, Promoter, Enhancer, Mitochondrial genes).
Figure 2.
Figure 2.
Comparing scPipe and Cell Ranger on a 10× dataset. (A) Summary of experimental design, which used cells from five distinct lung adenocarcinoma cell lines. An equal mixture of cells and nuclei were captured by the 10X protocol, and sequenced on the Illumina platform (see Materials and Methods). FASTQ files were generated by Cell Ranger ARC 2.0.0 and these reads were processed by scPipe and Cell Ranger. The panels of this figure pertain to the 80% results. (B) Venn diagram showing the overlap of cell barcodes detected by Cell Ranger and scPipe. (C) Box plot showing the percentage of mitochondrial gene counts in cells that are called by Cell Ranger and are common with/unique in comparison to scPipe or (C’) scPipe and are common with/unique in comparison to Cell Ranger output. (D) Scatter plot of the per cell total counts and (D’) number of features per cell obtained from Cell Ranger and scPipe in cells called in common between the two and cells that were unique to each of the two pipelines. Marginal density plots show the count distributions for each category. (E) UMAP plot generated for Cell Ranger and (E’)scPipe output. Cell barcodes that only exist in (E) Cell Ranger or (E’) scPipe are highlighted in red. (F) UMAP coloured by the ground truth for Cell Ranger and (F’)scPipe. Seurat identified clusters are demarcated by coloured lines and numbered. The ARI and NMI values calculated per dataset are shown in the top right of the panels.

References

    1. Buenrostro J.D., Wu B., Litzenburger U.M., Ruff D., Gonzales M.L., Snyder M.P., Chang H.Y., Greenleaf W.J. Single-cell chromatin accessibility reveals principles of regulatory variation. Nature. 2015; 523:486–490. - PMC - PubMed
    1. Baek S., Lee I. Single-cell ATAC sequencing analysis: from data preprocessing to hypothesis generation. Comput. Struct. Biotechnol. J. 2020; 18:1429–1439. - PMC - PubMed
    1. Cusanovich D.A., Hill A.J., Aghamirzaie D., Daza R.M., Pliner H.A., Berletch J.B., Filippova G.N., Huang X., Christiansen L., DeWitt W.S. et al. . A Single-cell atlas of in vivo mammalian chromatin accessibility. Cell. 2018; 174:1309–1324. - PMC - PubMed
    1. Mezger A., Klemm S., Mann I., Brower K., Mir A., Bostick M., Farmer A., Fordyce P., Linnarsson S., Greenleaf W. High-throughput chromatin accessibility profiling at single-cell resolution. Nat. Commun. 2018; 9:6–11. - PMC - PubMed
    1. Satpathy A.T., Granja J.M., Yost K.E., Qi Y., Meschi F., McDermott G.P., Olsen B.N., Mumbach M.R., Pierce S.E., Corces M.R. et al. . Massively parallel single-cell chromatin landscapes of human immune cell development and intratumoral T cell exhaustion. Nat. Biotechnol. 2019; 37:925–936. - PMC - PubMed