. 2023 Nov 2:34:102071.
doi: 10.1016/j.omtn.2023.102071. eCollection 2023 Dec 12.

Circular RNA circSMAD4 regulates cardiac fibrosis by targeting miR-671-5p and FGFR2 in cardiac fibroblasts

Affiliations

Circular RNA circSMAD4 regulates cardiac fibrosis by targeting miR-671-5p and FGFR2 in cardiac fibroblasts

Anna Jeong et al. Mol Ther Nucleic Acids. .

Abstract

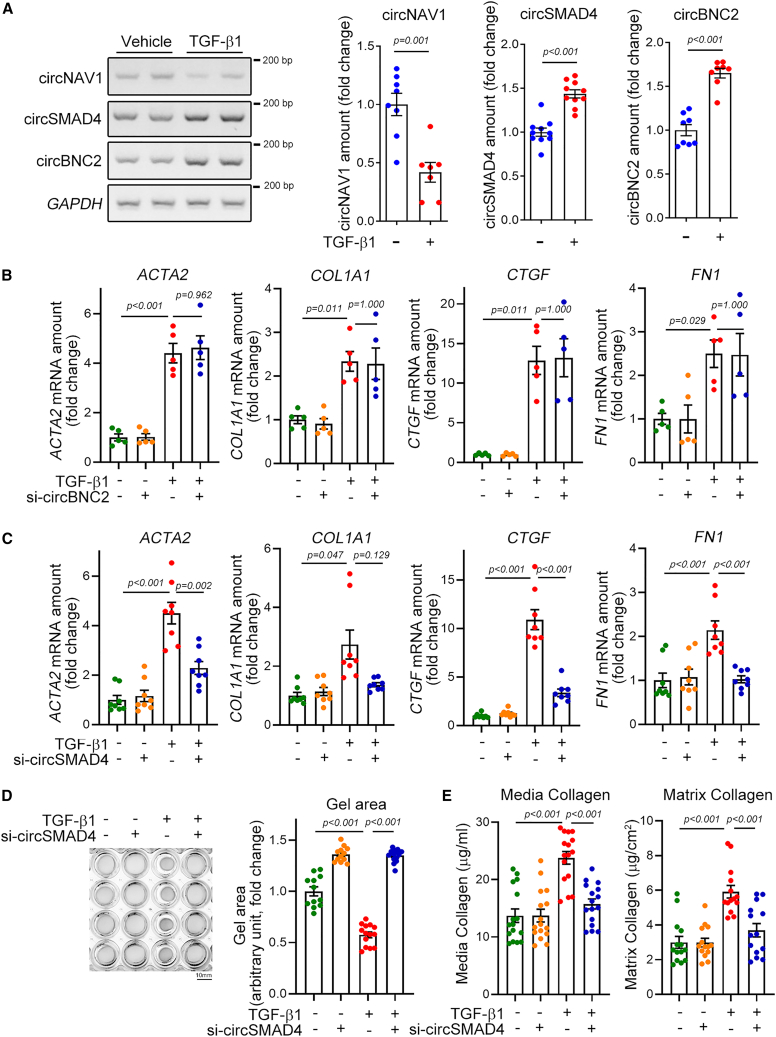
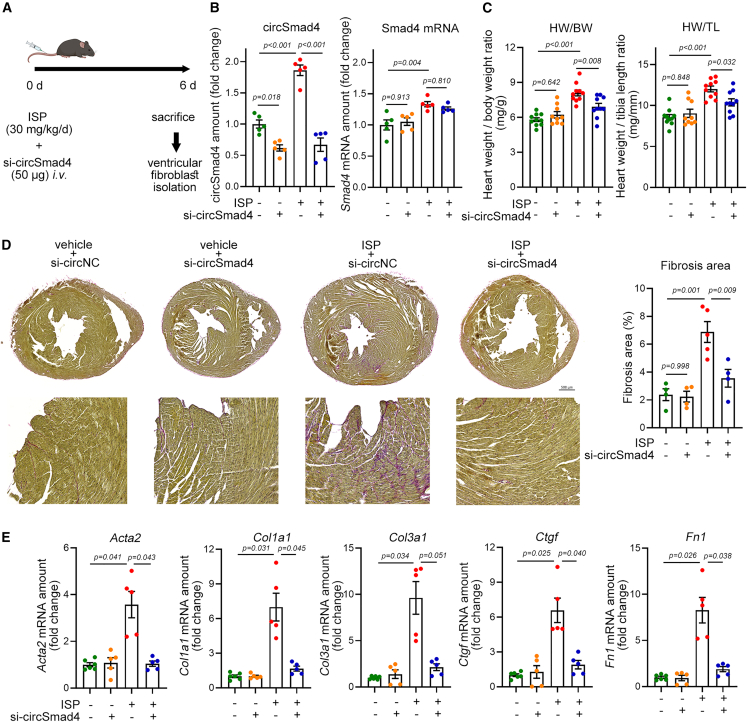
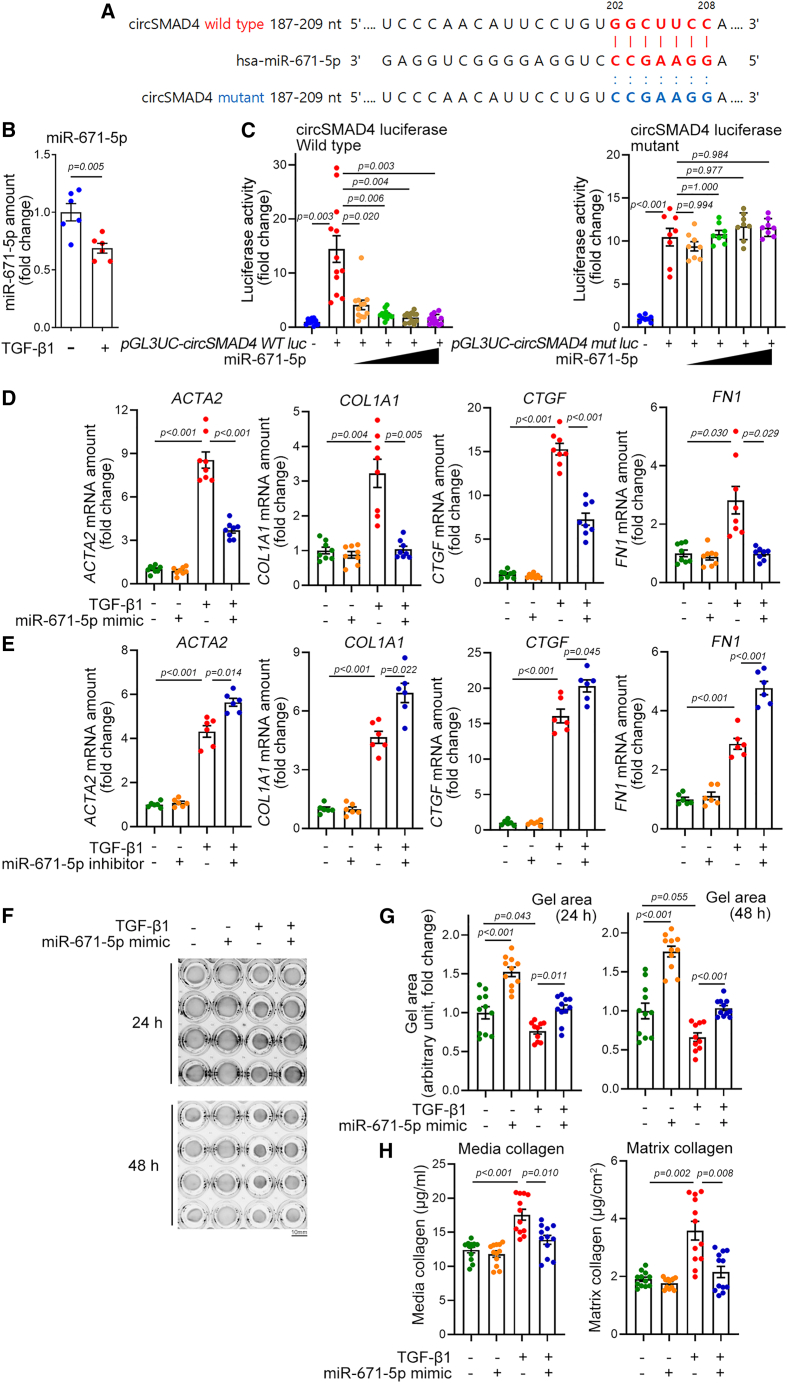
Heart failure is a leading cause of death and is often accompanied by activation of quiescent cardiac myofibroblasts, which results in cardiac fibrosis. In this study, we aimed to identify novel circular RNAs that regulate cardiac fibrosis. We applied transverse aortic constriction (TAC) for 1, 4, and 8 weeks in mice. RNA sequencing datasets were obtained from cardiac fibroblasts isolated by use of a Langendorff apparatus and then further processed by use of selection criteria such as differential expression and conservation in species. CircSMAD4 was upregulated by TAC in mice or by transforming growth factor (TGF)-β1 in primarily cultured human cardiac fibroblasts. Delivery of si-circSMAD4 attenuated myofibroblast activation and cardiac fibrosis in mice treated with isoproterenol (ISP). si-circSmad4 significantly reduced cardiac fibrosis and remodeling at 8 weeks. Mechanistically, circSMAD4 acted as a sponge against the microRNA miR-671-5p in a sequence-specific manner. miR-671-5p was downregulated during myofibroblast activation and its mimic form attenuated cardiac fibrosis. miR-671-5p mimic destabilized fibroblast growth factor receptor 2 (FGFR2) mRNA in a sequence-specific manner and interfered with the fibrotic action of FGFR2. The circSMAD4-miR-671-5p-FGFR2 pathway is involved in the differentiation of cardiac myofibroblasts and thereby the development of cardiac fibrosis.

Keywords: FGFR2; MT: Non-coding RNAs; cardiac fibrosis; circSMAD4; circular RNA; miR-671-5p; transverse aortic constriction.


Conflict of interest statement

The authors declare no competing interests.

Figures

None
Graphical abstract
Figure 1
Figure 1
Screening of circRNAs in cardiac fibroblasts obtained after TAC for 1, 4, or 8 weeks in mouse (A) Schematic diagram of screening flow. (B) Ten upregulated candidate circRNAs in cardiac fibroblasts. circRNAs with a p value less than 0.1 were selected as shown in Table S2. The values were expressed as fold changes in TAC groups relative to their matched sham controls. (C) Expression of circRNAs in human ventricular cardiac fibroblasts. One out of three samples shown. (D) Checking of circularity by RNase R treatment. Note that circRNAs were resistant to RNase R treatment, whereas linear host mRNAs were easily degraded. One out of three samples shown. (E) Sanger sequence to see the backsplice junctional sequence. Sequencing results of circNAV1, circSMAD4, and circBNC2 are shown on the left and the junctions are marked with a red arrow. The exon structures are shown on the right.
Figure 2
Figure 2
CircSmad4 activates cardiac myofibroblasts (A) Confirmation of changes of expression amounts of candidate circRNAs in TGF-β1-treated human cardiac fibroblasts. Band intensity was calculated after conventional RT-PCR as described in section “materials and methods” and the quantification results are shown in the bar graphs on the right. Note that circNAV1 was ruled out, because it was decreased, opposite to the initial screening after TAC. circNAV1: n = 7∼8 from four independent experimental sets with unpaired Student’s t test. circSMAD4: n = 10 from five sets with unpaired Student’s t test. circBNC2: n = 8 from four sets with Mann-Whitney’s U test. (B) Effects of si-circBNC2 on the expression of fibrosis-associated genes: ACTA2, actin alpha 2, smooth muscle, encodes α-smooth muscle actin (SMA); COL1A1, collagen type I alpha 1 chain; CTGF, connective tissue growth factor; FN1, fibronectin 1. Note that si-circBNC2 did not affect TGF-β1-induced myofibroblast differentiation. All four genes: n = 5 from two independent experimental sets. Each sample duplicated. ACTA2: one-way ANOVA with post hoc Tukey’s test. COL1A1, CTGF, and FN1: one-way ANOVA with post hoc Dunnett T3 test. (C) Effects of si-circSMAD4 on the expression of fibrosis-associated genes. All four genes: n = 8 from three sets. Each sample duplicated. ACTA2 and FN1: one-way ANOVA with post hoc Tukey’s test. COL1A1 and CTGF: one-way ANOVA with post hoc Dunnett’s T3 test. (D) Effects of si-circSMAD4 on TGF-β1-induced gel contraction. Left: representative gel picture. Right: quantification results. n = 12∼14 from four independent experimental sets. One-way ANOVA with post hoc Dunnett’s T3 test. Scale bar, 10 mm. (E) Effects of si-circSMAD4 on TGF-β1-induced releases of media collagen (left) and matrix collagen (right). Media collagen: n = 16 from four sets. One-way ANOVA with post hoc Tukey’s test. Matrix collagen: n = 14 from four sets. One-way ANOVA with post hoc Tukey’s test. Data are represented as mean ± SEM.
Figure 3
Figure 3
Effects of si-circSmad4 on acute cardiac fibrosis induced by ISP administration (A) Experimental scheme. si-circSmad4 was intravenously administered through a tail vein. (B) Efficiency of si-circSmad4. si-circSmad4 successfully reduced the expression of circSmad4 (left graph), whereas it failed to reduce the amount of linear mRNA of host Smad4 (right graph). Band intensity was calculated after conventional RT-PCR. n = 5 from two experimental sets. One-way ANOVA with post hoc Tukey’s test. (C) Effects of si-circSmad4 on the ISP-induced increase in heart weight. n = 5 from two experimental sets. Each sample duplicated. One-way ANOVA with post hoc Tukey’s test. (D) Picrosirius red staining and quantification of cardiac fibrosis. n = 4∼5. Each sample duplicated. One-way ANOVA with post hoc Bonferroni’s test. Scale bar, 500 µM. (E) Changes in cardiac fibrosis-associated genes. Col3a1, collagen type III alpha 1 chain. n = 5∼6 from two sets. Each sample duplicated. One-way ANOVA with post hoc Dunnett T3. Data are represented as mean ± SEM.
Figure 4
Figure 4
Effects of si-circSmad4 on the pre-established cardiac fibrosis induced by TAC for 8 weeks (A) Experimental scheme. si-circSmad4 was intravenously administered every 3 days from 5 weeks after TAC (establishment of fibrosis after TAC for 4 weeks is shown in Figure S5). (B) Efficiency of circSmad4 knockdown. Band intensity was calculated after conventional RT-PCR. n = 6∼7. Each sample duplicated. One-way ANOVA with post hoc Dunnett’s T3 test. (C) Changes in heart weight. Unlike the effects seen with ISP administration (Figure 3), si-circSmad4 did not result in a significant reduction of heart weight, although there was a trend toward reduction (third bar vs. fourth bar). n = 14∼16. One-way ANOVA with post hoc Dunnett’s T3 test. (D) Representative one-dimensional echocardiogram. (E) Quantitative results of EF and FS. Note that TAC-induced reduction of contractility was recovered by si-circSmad4 administration. n = 10∼14. Both parameters: one-way ANOVA with post hoc Bonferroni’s test. (F) Changes in lung weight. si-circSmad4 significantly reduced the TAC-induced increase in lung weight (third bar vs. fourth bar). n = 8∼9. One-way ANOVA with post hoc Bonferroni’s test. (G) Effect of si-circSmad4 on TAC-induced cardiac fibrosis. Note that even pre-established fibrosis was reversed by knocking down circSmad4. n = 5∼14. Each sample duplicated. One-way ANOVA with post hoc Dunnett’s T3 test. Scale bar, 500 µM. (H) Changes in expression of fibrosis genes by si-circSmad4. n = 8∼9. Each sample duplicated. All analysis except Col3a1: one-way ANOVA with post hoc Dunnett’s T3 test. Col3a1: one-way ANOVA with post hoc Bonferroni’s test. Data are represented as mean ± SEM.
Figure 5
Figure 5
circSmad4 targets miR-671-5p (A) Sequence alignment of human circSMAD4 with has-miR-671-5p. Binding sequences are shown in red. The mutant sequence in which the binding element is disrupted is shown in blue. (B) TGF-β1 reduced the amount of miR-671-5p. n = 6 from three independent experimental sets. Each sample duplicated. Unpaired Student’s t test. (C) Effects of miR-671-5p on circSMAD4-luciferase activity. Note that circSMAD4 wild-type luciferase was inhibited in a dose-dependent fashion (left panel, miRNA-671-mimic, 10–60 nM), whereas circSMAD4 mutant was not (right panel, miRNA-671-mimic, 10–60 nM). Wild type: n = 12 from three sets. One-way ANOVA with post hoc Dunnett’s T3 test. Mutant: n = 8 from two sets. One-way ANOVA with post hoc Dunnett’s T3 test. (D) miR-671-5p mimic attenuated the TGF-β1-induced increase in fibroblast genes. n = 8 from three sets. Each sample duplicated. One-way ANOVA with post hoc Dunnett’s T3 test. (E) miR-671-5p inhibitor potentiated the TGF-β1 effects. n = 6 from three sets. Each sample duplicated. ACTA2, COL1A1, and CTGF: one-way ANOVA with post hoc Dunnett’s T3 test. FN1: one-way ANOVA with post hoc Tukey’s test. (F and G) Representative gel pictures to show effects of miR-671-5p mimic on TGF-β1-induced gel contraction (F). Scale bar, 10 mm. Quantification results (G). Twenty-four hours: n = 10∼11 from three sets. One-way ANOVA with post hoc Bonferroni’s test. Forty-eight hours: n = 10∼11 from three sets. One-way ANOVA with post hoc Dunnett’s T3 test. (H) Effects of miR-671-5p mimic on TGF-β1-induced releases of media collagen (left) and matrix collagen (right). n = 12 from three sets. Both: one-way ANOVA with post hoc Dunnett’s T3 test. Data are represented as mean ± SEM.
Figure 6
Figure 6
Effects of circSmad4 overexpression and miR-671-5p on fibroblast differentiation (A) Transfection of pcDNA3.1-zkscan1-circSMAD4 increased the expression of fibrosis genes, whereas co-transfection of miR-671-5p mimic blunted it. n = 9∼11 from approximately three to five independent experimental sets. Each sample duplicated. ACTA and FN1: one-way ANOVA with post hoc Bonferroni’s test. COL1A1 and CTGF: one-way ANOVA with post hoc Dunnett’s T3 test. (B) Representative gel pictures. Scale bar, 10 mm. (C) Quantification results of gel contraction. Transfection of zkscan1-circSMAD4 reduced the gel area, which represents contraction of the gel. However, co-transfection of miR-671-5p relieved the contraction. n = 9∼11 from three sets. Each sample duplicated. One-way ANOVA with post hoc Bonferroni’s test. Data are represented as mean ± SEM.
Figure 7
Figure 7
miR-671-5p targets FGFR2 (A) Sequence alignment of miR-671-5p and wild-type or mutant FGFR2 3′ UTR. (B) miR-671-5p dose dependently reduced the 3′ UTR luciferase activity (left, miRNA-671-mimic, 10–60 nM). In contrast, it failed to inhibit the mutant luciferase (right, miRNA-671-mimic, 10–60 nM). n = 8 from two independent experimental sets. Wild type: one-way ANOVA with post hoc Dunnett’s T3 test. Mutant: one-way ANOVA with post hoc Tukey’s test. (C and D) Effect of miR-671-5p mimic (C) or inhibitor (D) on TGF-β1-induced increase in FGFR2 mRNA expression. Mimic (C): n = 7 from three sets. One-way ANOVA with post hoc Dunnett’s T3 test. Inhibitor (D): n = 6 from two sets. One-way ANOVA with post hoc Dunnett’s T3 test. (E) Effect of si-circSMAD4 on TGF-β1-induced increase in FGFR2 mRNA expression. n = 8∼13 from approximately three to five sets. One-way ANOVA with post hoc Dunnett’s T3 test. (F and G) Effect of intravenous injection of si-circSmad4 on the increase in Fgfr2 expression induced by ISP for 6 days (F) or by TAC for 8 weeks (G). The experimental schemes of those animal models are identical to Figures 3A and 4A. ISP: n = 5∼9 from two ∼ three sets. One-way ANOVA with post hoc Bonferroni’s test. TAC: n = 9∼11 from two sets. One-way ANOVA with post hoc Bonferroni’s test. (H) Schematic diagram of working mechanism. Data are represented as mean ± SEM.

References

    1. Hinderer S., Schenke-Layland K. Cardiac fibrosis - A short review of causes and therapeutic strategies. Adv. Drug Deliv. Rev. 2019;146:77–82. - PubMed
    1. Liu T., Song D., Dong J., Zhu P., Liu J., Liu W., Ma X., Zhao L., Ling S. Current Understanding of the Pathophysiology of Myocardial Fibrosis and Its Quantitative Assessment in Heart Failure. Front. Physiol. 2017;8:238. - PMC - PubMed
    1. Nwabuo C.C., Vasan R.S. Pathophysiology of Hypertensive Heart Disease: Beyond Left Ventricular Hypertrophy. Curr. Hypertens. Rep. 2020;22:11. - PubMed
    1. Leask A. Getting to the heart of the matter: new insights into cardiac fibrosis. Circ. Res. 2015;116:1269–1276. - PubMed
    1. Hentze M.W., Preiss T. Circular RNAs: splicing's enigma variations. EMBO J. 2013;32:923–925. - PMC - PubMed