. 2024 Mar 1;14(3):446-467.
doi: 10.1158/2159-8290.CD-23-0954.

INX-315, a Selective CDK2 Inhibitor, Induces Cell Cycle Arrest and Senescence in Solid Tumors

Affiliations

INX-315, a Selective CDK2 Inhibitor, Induces Cell Cycle Arrest and Senescence in Solid Tumors

Catherine Dietrich et al. Cancer Discov. .

Erratum in

Abstract

Cyclin-dependent kinase 2 (CDK2) is thought to play an important role in driving proliferation of certain cancers, including those harboring CCNE1 amplification and breast cancers that have acquired resistance to CDK4/6 inhibitors (CDK4/6i). The precise impact of pharmacologic inhibition of CDK2 is not known due to the lack of selective CDK2 inhibitors. Here we describe INX-315, a novel and potent CDK2 inhibitor with high selectivity over other CDK family members. Using cell-based assays, patient-derived xenografts (PDX), and transgenic mouse models, we show that INX-315 (i) promotes retinoblastoma protein hypophosphorylation and therapy-induced senescence (TIS) in CCNE1-amplified tumors, leading to durable control of tumor growth; (ii) overcomes breast cancer resistance to CDK4/6i, restoring cell cycle control while reinstating the chromatin architecture of CDK4/6i-induced TIS; and (iii) delays the onset of CDK4/6i resistance in breast cancer by driving deeper suppression of E2F targets. Our results support the clinical development of selective CDK2 inhibitors.

Significance: INX-315 is a novel, selective inhibitor of CDK2. Our preclinical studies demonstrate activity for INX-315 in both CCNE1-amplified cancers and CDK4/6i-resistant breast cancer. In each case, CDK2 inhibition induces cell cycle arrest and a phenotype resembling cellular senescence. Our data support the development of selective CDK2 inhibitors in clinical trials. See related commentary by Watts and Spencer, p. 386. This article is featured in Selected Articles from This Issue, p. 384.


Figures

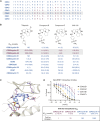
Figure 1. Discovery and characterization of INX-315. A, Amino acid sequence homology at the ATP-binding pockets of several CDKs. B, Derivation of INX-315 through serial modifications of trilaciclib, a CDK4/6i. Table indicates biochemical IC50s (± SEM) to cyclin/CDK pairings shown using the Nanosyn biochemical assay. Trilaciclib IC50 for CDK1/cyclin B1 was ND (for trilaciclib: n = 6 for CDK2/cyclin E1 and CDK2/cyclin A2, n = 9 for CDK4/cyclin D1, n = 3 for other complexes; for compound B: n = 3 for all complexes; for compound C: n = 1 for all complexes; for INX-315: if SEM is 0, n = 1, otherwise n = 6). C, Modeling of INX-315 bound to cyclin E1/CDK2. D, NanoBRET assay quantifying INX-315's intracellular displacement of tracer from the ATP-pocket of the cyclin/CDK pairings shown. Table shows calculated IC50s (two technical replicates per experiment, two biological replicates except for CDK2/Cyclin A1 where n = 1; error bars represent SD).BID, twice daily; QD, once daily.
Figure 1.
Discovery and characterization of INX-315. A, Amino acid sequence homology at the ATP-binding pockets of several CDKs. B, Derivation of INX-315 through serial modifications of trilaciclib, a CDK4/6i. Table indicates biochemical IC50s (± SEM) to cyclin/CDK pairings shown using the Nanosyn biochemical assay. Trilaciclib IC50 for CDK1/cyclin B1 was ND (for trilaciclib: n = 6 for CDK2/cyclin E1 and CDK2/cyclin A2, n = 9 for CDK4/cyclin D1, n = 3 for other complexes; for compound B: n = 3 for all complexes; for compound C: n = 1 for all complexes; for INX-315: if SEM is 0, n = 1, otherwise n = 6). C, Modeling of INX-315 bound to cyclin E1/CDK2. D, NanoBRET assay quantifying INX-315's intracellular displacement of tracer from the ATP-pocket of the cyclin/CDK pairings shown. Table shows calculated IC50s (two technical replicates per experiment, two biological replicates except for CDK2/Cyclin A1 where n = 1; error bars represent SD).BID, twice daily; QD, once daily.
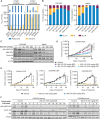
Figure 2. Activity of INX-315 in CCNE1-amplified cancers. A, IC50s for palbociclib and INX-315 for cell lines shown using CellTiter Glo viability assay. All cells were treated for 6 days, n = 3 technical replicates per cell line. B, Cell cycle phase profiles of OVCAR-3 and MKN1 cells treated with INX-315. All cells were treated for 24 hours, n = 3 technical replicates per cell line; error bars are SD. C, Western blots for phosphorylated/total Rb and cyclin A2 in OVCAR3 and MKN1 cells treated with INX-315 for 24 hours. D and E, Tumor growth curves for CCNE1-amplified gastric and ovarian carcinoma models treated with INX-315 at doses shown (GA0103 n = 8 per group; GA0114 n = 8 per group; OVCAR3 n = 10 per group; OV5398 n = 10 per group; error bars represent SEM; P values calculated using two-way ANOVA. all experiments performed once). F, Western blots for phosphorylated/total Rb and cyclin A2 in tumor tissue lysates treated with control vehicle or INX-315. Samples were collected at experimental endpoint from experiments in E.
Figure 2.
Activity of INX-315 in CCNE1-amplified cancers. A, IC50s for palbociclib and INX-315 for cell lines shown using CellTiter Glo viability assay. All cells were treated for 6 days, n = 3 technical replicates per cell line. B, Cell cycle phase profiles of OVCAR-3 and MKN1 cells treated with INX-315. All cells were treated for 24 hours, n = 3 technical replicates per cell line; error bars are SD. C, Western blots for phosphorylated/total Rb and cyclin A2 in OVCAR3 and MKN1 cells treated with INX-315 for 24 hours. D and E, Tumor growth curves for CCNE1-amplified gastric and ovarian carcinoma models treated with INX-315 at doses shown (GA0103 n = 8 per group; GA0114 n = 8 per group; OVCAR3 n = 10 per group; OV5398 n = 10 per group; error bars represent SEM; P values calculated using two-way ANOVA. all experiments performed once). F, Western blots for phosphorylated/total Rb and cyclin A2 in tumor tissue lysates treated with control vehicle or INX-315. Samples were collected at experimental endpoint from experiments in E.
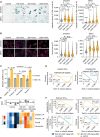
Figure 3. TIS after INX-315 treatment of CCNE1-amplified cancers. A, Left, representative images after staining OVCAR3 and MKN1 cells for beta-galactosidase activity after treatment with INX-315 (scale bar = 100 µm). Experiments performed with three technical replicates. Right, quantification of integrated beta-galactosidase signal per cell. Dashed line indicates cutoff used to define beta-galactosidase positivity, and numbers represent percentage of beta-galactosidase–positive cells. B, Left, representative images after staining OVCAR3 and MKN1 cells with DAPI and phalloidin after treatment with INX-315 (scale bar = 100 µm). Right, quantification of relative nuclear size based on DAPI staining. Experiments performed with three technical replicates. C, ssGSEA scores derived from RNA sequencing of OVCAR3 cells treatment with control or INX-315 300 nmol/L for seven days. Scores are calculated for four independent senescence-associated gene sets; three technical replicates. D, GSEA plots derived from RNA-sequencing performed on tumor tissue from experiments in Fig. 2D and E. Normalized enrichment score (NES) and q value (false discovery rate) were calculated as described in Methods (all P values were calculated using unpaired t tests, error bars represent SD). E, ssGSEA scores for four senescence-associated gene signatures were calculated from RNA-sequencing on OV5398 PDX tumor tissue. Heat map shows z-scores for these. Bar plot above shows mean z-score for each sample across all signatures. F, GSEA plots derived from RNA-sequencing performed on tumor tissue from experiments in Fig. 2D and E. NES and q value (false discovery rate) were calculated as described in Methods (all P values were calculated using unpaired t tests, error bars represent SD).
Figure 3.
TIS after INX-315 treatment of CCNE1-amplified cancers. A, Left, representative images after staining OVCAR3 and MKN1 cells for beta-galactosidase activity after treatment with INX-315 (scale bar = 100 µm). Experiments performed with three technical replicates. Right, quantification of integrated beta-galactosidase signal per cell. Dashed line indicates cutoff used to define beta-galactosidase positivity, and numbers represent percentage of beta-galactosidase–positive cells. B, Left, representative images after staining OVCAR3 and MKN1 cells with DAPI and phalloidin after treatment with INX-315 (scale bar = 100 µm). Right, quantification of relative nuclear size based on DAPI staining. Experiments performed with three technical replicates. C, ssGSEA scores derived from RNA sequencing of OVCAR3 cells treatment with control or INX-315 300 nmol/L for seven days. Scores are calculated for four independent senescence-associated gene sets; three technical replicates. D, GSEA plots derived from RNA-sequencing performed on tumor tissue from experiments in Fig. 2D and E. Normalized enrichment score (NES) and q value (false discovery rate) were calculated as described in Methods (all P values were calculated using unpaired t tests, error bars represent SD). E, ssGSEA scores for four senescence-associated gene signatures were calculated from RNA-sequencing on OV5398 PDX tumor tissue. Heat map shows z-scores for these. Bar plot above shows mean z-score for each sample across all signatures. F, GSEA plots derived from RNA-sequencing performed on tumor tissue from experiments in Fig. 2D and E. NES and q value (false discovery rate) were calculated as described in Methods (all P values were calculated using unpaired t tests, error bars represent SD).
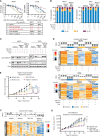
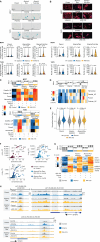
Figure 4. Activity of INX-315 in CDK4/6i–resistant breast cancer. A, Dose–response curves for MCF7 and T47D cell lines treated with INX-315 for 7 days. Parent, parent cells in DMSO; Abema-resistant, abemaciclib-resistant cells growing in 500 nmol/L abemaciclib; Abema/Fulv-resistant, resistant to abemaciclib/fulvestrant growing in 500 nmol/L abemaciclib plus 100 nmol/L fulvestrant; Fulv-resistant, fulvestrant resistant growing in 100 nmol/L fulvestrant; Parent + abema, parental cells treated with 500 nmol/L abemaciclib and INX-315 concurrently. Table shows IC50s for INX-315 in each case, derived from measurement of cell number (error bars represent SD; two biological replicates, six technical replicates each time). B, Cell cycle phase profiles of MCF7 and T47D cells (and parental and drug-resistant) treated with drugs shown for 7 days (500 nmol/L abemaciclib; 100 nmol/L fulvestrant; INX-315, 300 nmol/L for MCF7, 100 nmol/L for T47D; values are mean of experiments performed in duplicate, error bars are SD). C, Western blots for phosphorylated/total Rb in MCF7 and T47D cells treated as in B. D, Heat map showing z scores for individual E2F target genes (RNA-sequencing) in MCF7 and T47D cells treated as in B. Bar plot above shows mean z-score for all genes in each sample. Three technical replicates per condition. E, Tumor growth curves for MMTV-rtTA/tetO-HER2 tumors treated with control vehicle (n = 17 tumors in 6 mice), abemaciclib (n = 17 tumors in 6 mice), INX-315 (n = 20 tumors in 6 mice), or the combination (n = 15 tumors in 6 mice). Tumors were pretreated with abemaciclib for 3ߝ4 weeks prior to randomization, at which point abemaciclib resistance was present. Experiment was repeated twice (error bars represent SEM; P values calculated using two-way ANOVA). F, Heat map showing z scores for individual E2F target genes (RNA-sequencing) in MMTV-rtTA/tetO-HER2 tumors from E. Bar plot above shows mean z-score for all genes in each sample. Six samples for vehicle and INX-315, five samples for abemaciclib and combination. G, Tumor growth curves for ST4316B PDX tumors treated with control, ribociclib, INX-315, or the combination (n = 8 per group; error bars represent SEM; P values calculated using two-way ANOVA).
Figure 4.
Activity of INX-315 in CDK4/6i–resistant breast cancer. A, Dose–response curves for MCF7 and T47D cell lines treated with INX-315 for 7 days. Parent, parent cells in DMSO; Abema-resistant, abemaciclib-resistant cells growing in 500 nmol/L abemaciclib; Abema/Fulv-resistant, resistant to abemaciclib/fulvestrant growing in 500 nmol/L abemaciclib plus 100 nmol/L fulvestrant; Fulv-resistant, fulvestrant resistant growing in 100 nmol/L fulvestrant; Parent + abema, parental cells treated with 500 nmol/L abemaciclib and INX-315 concurrently. Table shows IC50s for INX-315 in each case, derived from measurement of cell number (error bars represent SD; two biological replicates, six technical replicates each time). B, Cell cycle phase profiles of MCF7 and T47D cells (and parental and drug-resistant) treated with drugs shown for 7 days (500 nmol/L abemaciclib; 100 nmol/L fulvestrant; INX-315, 300 nmol/L for MCF7, 100 nmol/L for T47D; values are mean of experiments performed in duplicate, error bars are SD). C, Western blots for phosphorylated/total Rb in MCF7 and T47D cells treated as in B. D, Heat map showing z scores for individual E2F target genes (RNA-sequencing) in MCF7 and T47D cells treated as in B. Bar plot above shows mean z-score for all genes in each sample. Three technical replicates per condition. E, Tumor growth curves for MMTV-rtTA/tetO-HER2 tumors treated with control vehicle (n = 17 tumors in 6 mice), abemaciclib (n = 17 tumors in 6 mice), INX-315 (n = 20 tumors in 6 mice), or the combination (n = 15 tumors in 6 mice). Tumors were pretreated with abemaciclib for 3–4 weeks prior to randomization, at which point abemaciclib resistance was present. Experiment was repeated twice (error bars represent SEM; P values calculated using two-way ANOVA). F, Heat map showing z scores for individual E2F target genes (RNA-sequencing) in MMTV-rtTA/tetO-HER2 tumors from E. Bar plot above shows mean z-score for all genes in each sample. Six samples for vehicle and INX-315, five samples for abemaciclib and combination. G, Tumor growth curves for ST4316B PDX tumors treated with control, ribociclib, INX-315, or the combination (n = 8 per group; error bars represent SEM; P values calculated using two-way ANOVA).
Figure 5. INX-315 treatment of CDK4/6i–resistant breast cancer reinstates a senescence phenotype. A, Representative images (top) and quantification (bottom) of staining MCF7 and T47D cells for beta-galactosidase activity after treatment with agents shown (500 nmol/L abemaciclib, INX-315: 300 nmol/L for MCF7 and 100 nmol/L for T47D) for 7 days (scale bar = 100 µm). Resistant cells were cultured continuously in drugs to which they were resistant (500 nmol/L abemaciclib ± 100 nmol/L fulvestrant). Experiments performed with three technical replicates. Quantification is for integrated beta-galactosidase signal per cell. Dashed line indicates cutoff used to define beta-galactosidase positivity. B, Representative images (top) and quantification of nuclear size (bottom) upon staining MCF7 and T47D cells with DAPI and phalloidin after treatment as in A (scale bar = 100 µm). Experiments performed with three technical replicates. C, Heat map shows z-scores for ssGSEA scores for four senescence-associated gene signatures, calculated from RNA-sequencing of MCF7 and T47D cells treated as in A. Bar plot above shows mean z-score for each sample across all signatures. Three technical replicates for all conditions except abemaciclib-resistant MCF7 in abemaciclib, which had two technical replicates. D, Heat map as in C, but for RNA-sequencing from abemaciclib-resistant MMTV-rtTA/tetO-HER2 tumors treated as in Fig. 4E. Six samples for vehicle and INX-315, five samples for abemaciclib and combination. E, Violin plots showing log2-transformed normalized ATAC-seq counts for genomic regions that significantly increased chromatin accessibility after abemaciclib treatment of parental cells. Cells treated as in A, two technical replicates. F, Scatter plots showing significant enrichment of AP-1 motifs in the ATAC-seq up peaks after treatment with drugs as in A. G, Heat map showing z-scores for individual SASP genes (RNA-sequencing) in MCF7 cells treated as in A. Bar plot above shows mean z-score for all genes in each sample. Three technical replicates for all conditions except abemaciclib-resistant MCF7 in abemaciclib, which had two technical replicates. H, Representative ATAC-seq tracks at regions near SASP genes (IGFBP3 and VEGFA) in cells treated as in A (all P values calculated using unpaired t tests except F, determined using HOMER package).
Figure 5.
INX-315 treatment of CDK4/6i–resistant breast cancer reinstates a senescence phenotype. A, Representative images (top) and quantification (bottom) of staining MCF7 and T47D cells for beta-galactosidase activity after treatment with agents shown (500 nmol/L abemaciclib, INX-315: 300 nmol/L for MCF7 and 100 nmol/L for T47D) for 7 days (scale bar = 100 µm). Resistant cells were cultured continuously in drugs to which they were resistant (500 nmol/L abemaciclib ± 100 nmol/L fulvestrant). Experiments performed with three technical replicates. Quantification is for integrated beta-galactosidase signal per cell. Dashed line indicates cutoff used to define beta-galactosidase positivity. B, Representative images (top) and quantification of nuclear size (bottom) upon staining MCF7 and T47D cells with DAPI and phalloidin after treatment as in A (scale bar = 100 µm). Experiments performed with three technical replicates. C, Heat map shows z-scores for ssGSEA scores for four senescence-associated gene signatures, calculated from RNA-sequencing of MCF7 and T47D cells treated as in A. Bar plot above shows mean z-score for each sample across all signatures. Three technical replicates for all conditions except abemaciclib-resistant MCF7 in abemaciclib, which had two technical replicates. D, Heat map as in C, but for RNA-sequencing from abemaciclib-resistant MMTV-rtTA/tetO-HER2 tumors treated as in Fig. 4E. Six samples for vehicle and INX-315, five samples for abemaciclib and combination. E, Violin plots showing log2-transformed normalized ATAC-seq counts for genomic regions that significantly increased chromatin accessibility after abemaciclib treatment of parental cells. Cells treated as in A, two technical replicates. F, Scatter plots showing significant enrichment of AP-1 motifs in the ATAC-seq up peaks after treatment with drugs as in A. G, Heat map showing z-scores for individual SASP genes (RNA-sequencing) in MCF7 cells treated as in A. Bar plot above shows mean z-score for all genes in each sample. Three technical replicates for all conditions except abemaciclib-resistant MCF7 in abemaciclib, which had two technical replicates. H, Representative ATAC-seq tracks at regions near SASP genes (IGFBP3 and VEGFA) in cells treated as in A (all P values calculated using unpaired t tests except F, determined using HOMER package).
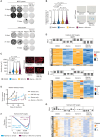
Figure 6. INX-315 delays the onset of acquired CDK4/6i resistance. A, Representative images from a clonogenic assay in which MCF7 and T47D cells were treated with control vehicle, abemaciclib (500 nmol/L), INX-315 (300 nmol/L for MCF7, 100 nmol/L for T47D), or the combination. Six technical replicates per condition. B, Representative images (right) and quantification (left) after treating MCF7 cells as in A for 7 days followed by staining for beta-galactosidase (β-gal) activity (scale bar = 100 µm). Note that representative images for control and abemaciclib group are identical to those used in Fig. 5A. C, Representative images (right) and quantification of relative nuclear size (left) for cells treated as in B (scale bar = 100 µm). Note that representative images of control and abemaciclib group are identical to those used in Fig. 5B. D, Heat map showing z scores for individual E2F target genes (RNA-sequencing) in MCF7 and T47D cells treated with drugs shown for 7 days at concentrations as in A. Bar plot above shows mean z-score for all genes in each sample. Three technical replicates per condition. E, Tumor growth curves for MMTV-rtTA/tetO-HER2 tumors treated with control vehicle (n = 41 tumors in 5 mice), abemaciclib (n = 40 tumors in 5 mice), INX-315 (n = 39 tumors in 5 mice), or the combination (n = 29 tumors in 5 mice). Experiment was repeated twice. F, GSEA plots derived from RNA-sequencing performed on tumor tissue from experiment (E). Normalized enrichment score (NES) and q value (false discovery rate) were calculated as described in Methods. For B and C, P values calculated using unpaired t test; for E, error bars represent SEM; P values calculated using two-way ANOVA). G, Heat map showing z scores for individual E2F target genes (RNA-sequencing) in MMTV-rtTA/tetO-HER2 tumors from E. Bar plot above shows mean z-score for all genes in each sample. Five samples for vehicle, abemaciclib, and combination; four samples for INX-315.
Figure 6.
INX-315 delays the onset of acquired CDK4/6i resistance. A, Representative images from a clonogenic assay in which MCF7 and T47D cells were treated with control vehicle, abemaciclib (500 nmol/L), INX-315 (300 nmol/L for MCF7, 100 nmol/L for T47D), or the combination. Six technical replicates per condition. B, Representative images (right) and quantification (left) after treating MCF7 cells as in A for 7 days followed by staining for beta-galactosidase (β-gal) activity (scale bar = 100 µm). Note that representative images for control and abemaciclib group are identical to those used in Fig. 5A. C, Representative images (right) and quantification of relative nuclear size (left) for cells treated as in B (scale bar = 100 µm). Note that representative images of control and abemaciclib group are identical to those used in Fig. 5B. D, Heat map showing z scores for individual E2F target genes (RNA-sequencing) in MCF7 and T47D cells treated with drugs shown for 7 days at concentrations as in A. Bar plot above shows mean z-score for all genes in each sample. Three technical replicates per condition. E, Tumor growth curves for MMTV-rtTA/tetO-HER2 tumors treated with control vehicle (n = 41 tumors in 5 mice), abemaciclib (n = 40 tumors in 5 mice), INX-315 (n = 39 tumors in 5 mice), or the combination (n = 29 tumors in 5 mice). Experiment was repeated twice. F, GSEA plots derived from RNA-sequencing performed on tumor tissue from experiment (E). Normalized enrichment score (NES) and q value (false discovery rate) were calculated as described in Methods. For B and C, P values calculated using unpaired t test; for E, error bars represent SEM; P values calculated using two-way ANOVA). G, Heat map showing z scores for individual E2F target genes (RNA-sequencing) in MMTV-rtTA/tetO-HER2 tumors from E. Bar plot above shows mean z-score for all genes in each sample. Five samples for vehicle, abemaciclib, and combination; four samples for INX-315.

References

    1. Goel S, Bergholz JS, Zhao JJ. Targeting CDK4 and CDK6 in cancer. Nat Rev Cancer 2022;22:356–72. - PMC - PubMed
    1. Asghar U, Witkiewicz AK, Turner NC, Knudsen ES. The history and future of targeting cyclin-dependent kinases in cancer therapy. Nat Rev Drug Discov 2015;14:130–46. - PMC - PubMed
    1. Spring LM, Wander SA, Andre F, Moy B, Turner NC, Bardia A. Cyclin-dependent kinase 4 and 6 inhibitors for hormone receptor-positive breast cancer: past, present, and future. Lancet 2020;395:817–27. - PubMed
    1. Choi YJ, Li X, Hydbring P, Sanda T, Stefano J, Christie AL, et al. The requirement for cyclin D function in tumor maintenance. Cancer Cell 2012;22:438–51. - PMC - PubMed
    1. Tadesse S, Anshabo AT, Portman N, Lim E, Tilley W, Caldon CE, et al. Targeting CDK2 in cancer: challenges and opportunities for therapy. Drug Discov Today 2020;25:406–13. - PubMed

Substances