. 2024 Jan 25;52(2):816-830.
doi: 10.1093/nar/gkad1149.

Dynamic action of an intrinsically disordered protein in DNA compaction that induces mycobacterial dormancy

Affiliations

Dynamic action of an intrinsically disordered protein in DNA compaction that induces mycobacterial dormancy

Akihito Nishiyama et al. Nucleic Acids Res. .

Abstract

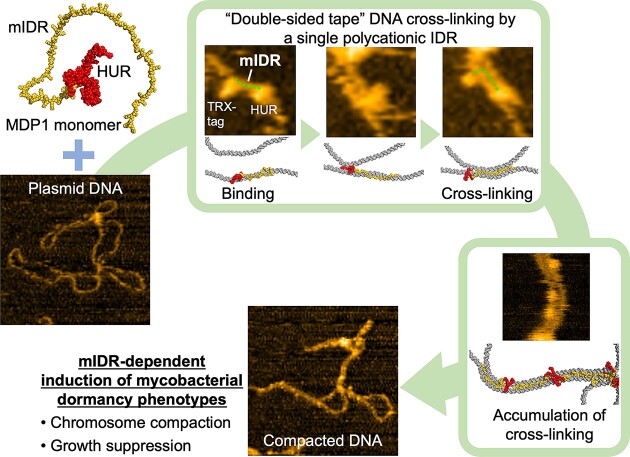
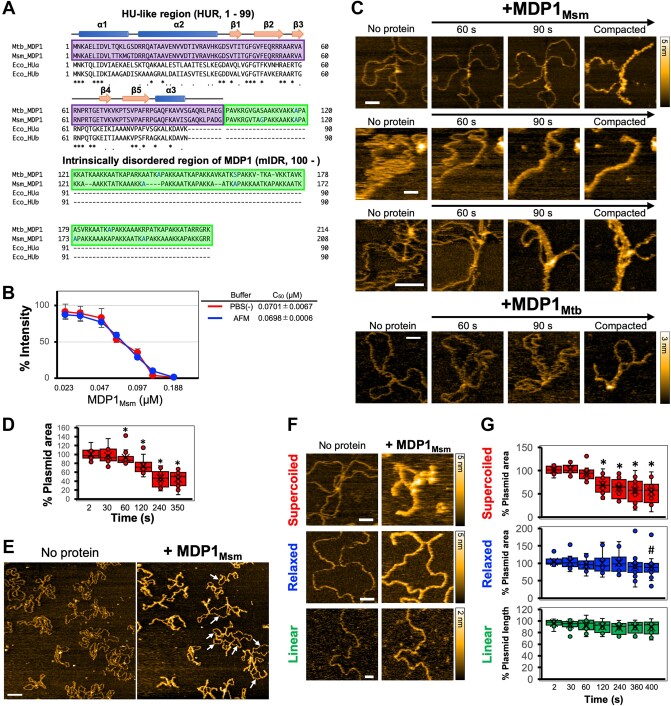
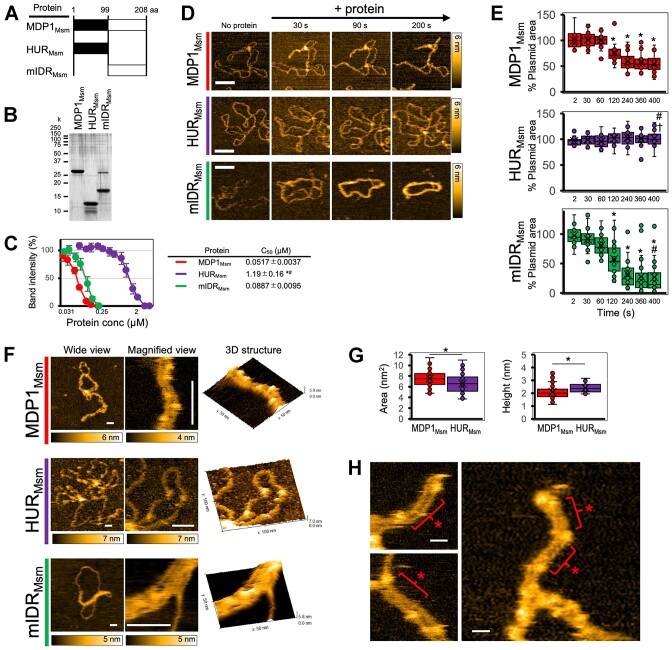
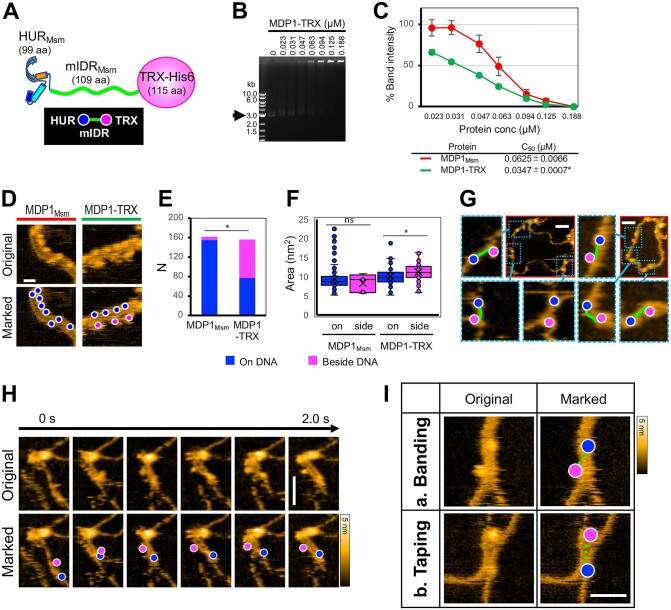
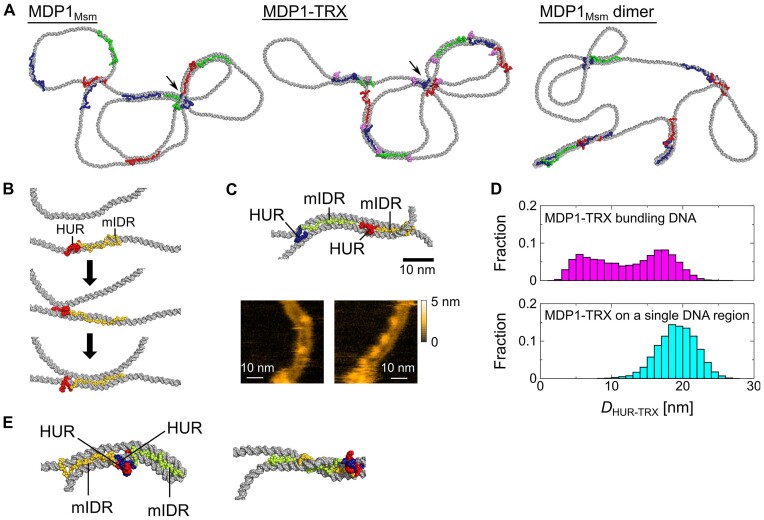
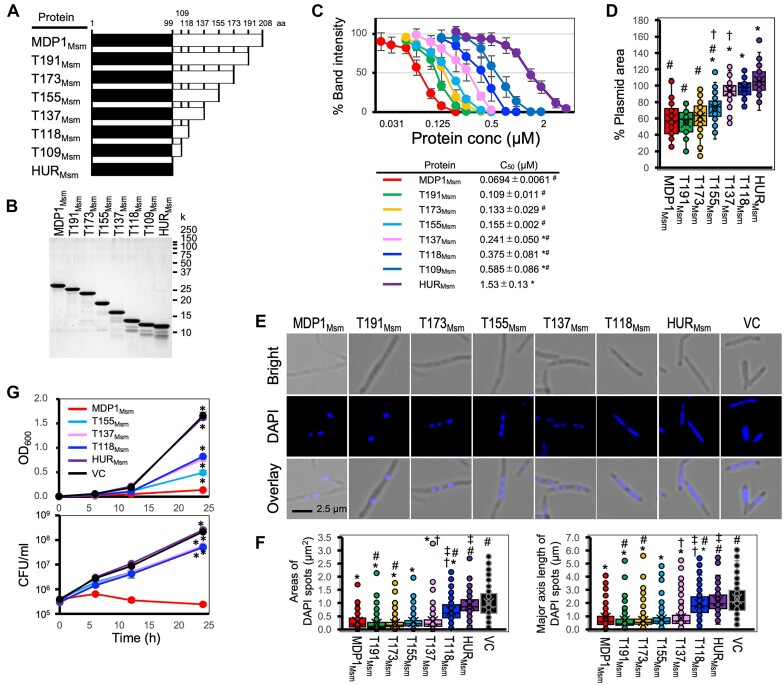
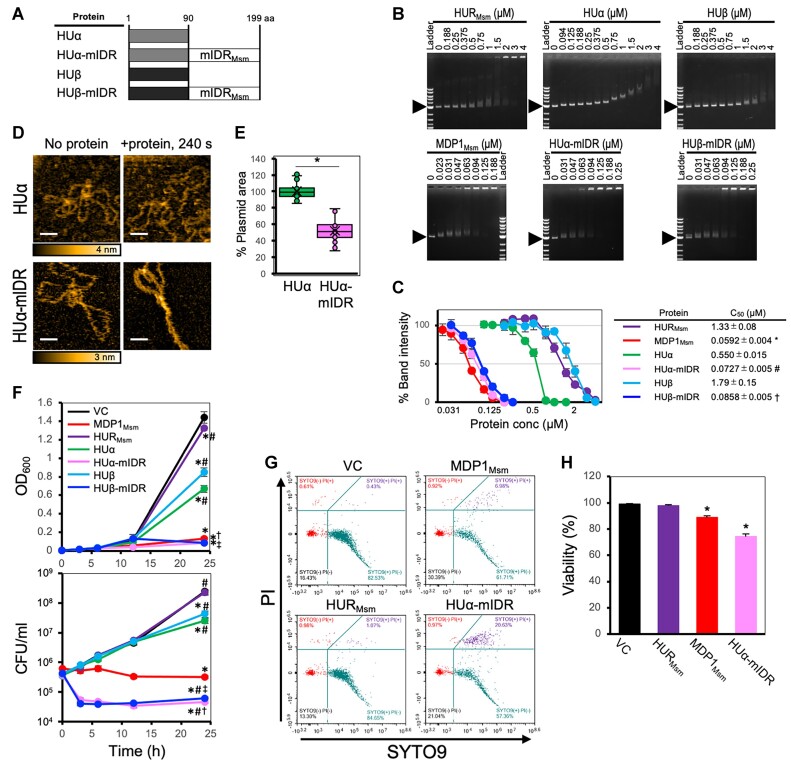
Mycobacteria are the major human pathogens with the capacity to become dormant persisters. Mycobacterial DNA-binding protein 1 (MDP1), an abundant histone-like protein in dormant mycobacteria, induces dormancy phenotypes, e.g. chromosome compaction and growth suppression. For these functions, the polycationic intrinsically disordered region (IDR) is essential. However, the disordered property of IDR stands in the way of clarifying the molecular mechanism. Here we clarified the molecular and structural mechanism of DNA compaction by MDP1. Using high-speed atomic force microscopy, we observed that monomeric MDP1 bundles two adjacent DNA duplexes side-by-side via IDR. Combined with coarse-grained molecular dynamics simulation, we revealed the novel dynamic DNA cross-linking model of MDP1 in which a stretched IDR cross-links two DNA duplexes like double-sided tape. IDR is able to hijack HU function, resulting in the induction of strong mycobacterial growth arrest. This IDR-mediated reversible DNA cross-linking is a reasonable model for MDP1 suppression of the genomic function in the resuscitable non-replicating dormant mycobacteria.


Figures

Graphical Abstract
Graphical Abstract
Figure 1.
Figure 1.
MDP1 induced DNA compaction via side-by-side DNA bundling. (A) Amino acid sequences of MDP1Msm, MDP1Mtb, E. coli HUα and HUβ. Secondary structures of MDP1Mtb HURMtb (18) are presented as α-helices (tubes) and β-strands (arrows) at the top of the alignment. Purple and green boxes indicate MDP1 HUR and mIDR, respectively (2,18). Aligned sequences are as follows: Mtb_MDP1, Mtb H37Rv MDP1Mtb (AL123456, Rv2986c); Msm_MDP1, Msm mc2_155 MDP1Msm (CP000480, MSMEG_2389); Eco_HUa, E. coli K-12 MG1655 HUα (U00096, b4000); and Eco_HUb, E. coli K-12 MG1655 HUβ (b0440). (B) Affinity of MDP1Msm for supercoiled pSO246 (gel retardation assay) in PBS(–) or HS-AFM imaging buffer (AFM). Representative gels are shown in Supplementary Figure S1D. Band intensity of the plasmid migrated at the position indicated by arrows in Supplementary Figure S1D was measured using Image J Fiji and plotted (mean ± SD, n = 3). The protein concentration which induced 50% DNA retardation (C50) was calculated from fitted curves of triplicate gels and indicated in the panel. The difference was not significant. (C) HS-AFM time-lapse imaging of MDP1Msm- and MDP1Mtb-induced morphological changes of 4.5 kb plasmids. A plasmid-bound mica stage was set-up, followed by protein addition to the buffer chamber. Images were then taken [5 frames per second (fps)]. Bars, 60 nm. Corresponding movies are presented in Supplementary Video S1a–c. (D) Plasmid compaction. Time-lapse images were captured by HS-AFM at 0.5 fps (1500 nm × 1500 nm). Plasmid compaction was followed by measuring the areas enclosed by individual plasmids (Image J Fiji). The area of protein-free plasmid was considered as 100% and the % plasmid area at each time point was plotted (n = 18). *P< 0.05 compared with the data at 2 s (Kruskal–Wallis test and Mann–Whitney test). (E) Overview of the plasmids before and after compaction by MDP1Msm (0.5 fps). Arrows, circular regions not compacted by MDP1Msm. Bar, 150 nm. (F) Comparison of MDP1Msm-induced morphological changes of the supercoiled, relaxed and linear plasmids by HS-AFM (5 fps). Left, protein-free; right, incubated with MDP1Msm. Bars, 60 nm. Corresponding movies are presented in Supplementary Video S1d–f. (G) Compaction of supercoiled, relaxed and linear plasmids was quantified as described in (C) (n ≥ 13). *P< 0.05 compared with the data at 2 s; #P < 0.05 compared with the supercoiled plasmid (Kruskal–Wallis test and Mann–Whitney test). See also Supplementary Figure S1 and Supplementary Video S1.
Figure 2.
Figure 2.
mIDR plays a crucial role in MDP1-induced DNA compaction. (A and B) Schematic representation (A) and sodium dodecylsulfate–polyacrylamide gel electrophoresis (SDS–PAGE) (B) of MDP1Msm, HURMsm and mIDRMsm. (C) Affinity of MDP1Msm, HURMsm and mIDRMsm for the supercoiled plasmid (gel retardation assay). Representative gels are shown in Supplementary Figure S2C. Band intensity (mean ± SD, n = 3) and C50 (mean ± SD, n = 3) were calculated as described in Figure 1B. *P < 0.05 compared with MDP1Msm and #P< 0.05 compared with mIDRMsm [analysis of variance (ANOVA)]. (D) HS-AFM time-lapse imaging of plasmid morphological changes caused by MDP1Msm, HURMsm or mIDRMsm performed as described in Figure 1C (5 fps). Bars, 100 nm. Corresponding movies are presented in Supplementary Video S2. (E) Plasmid compaction was quantified as described in Figure 1D (n ≥ 18). *P< 0.05 compared with data at 2 s. #P < 0.05 compared with MDP1Msm and P< 0.05 compared with  mIDRMsm (Kruskal–Wallis test and Mann–Whitney test). (F) Detailed images of DNA/protein complexes, captured by HS-AFM (5 fps). Bars, 30 nm. 3D structures of DNA/protein complexes were generated using Gwyddion (http://www.gwyddion.net). (G) The area and height of the globules detected on DNA/MDP1Msm and DNA/HURMsm complexes were measured using Image J Fiji and Kodec, respectively. MDP1Msm, median area 7.50 nm2, median height 2.00 nm; HURMsm, median area 6.55 nm2, median height, 2.36 nm. *P< 0.05 (Student t-test for area and Mann–Whitney test for height). (H) Sporadic localization of MDP1Msm globules on DNA/MDP1Msm complexes. *Cross-linked DNA regions between MDP1Msm globules. Bars, 10 nm. See also Supplementary Figure S2; Supplementary Videos S2 and S3; and Supplementary Table S3.
Figure 3.
Figure 3.
Following the mIDR action during DNA cross-linking by HS-AFM time-lapse imaging using a globular tag. (A) Cartoon image of MDP1-TRX [referring to HURMtb (PDB ID: 4DKY)]. In the following HS-AFM images, HURMsm and TRX globules are marked with blue and magenta, respectively. The deduced position of mIDRMsm is marked with green. (B and C) Affinity of MDP1Msm and MDP1-TRX for the supercoiled plasmid (gel retardation assay). A representative of triplicate gels is shown (B). Band intensity (mean ± SD, n = 3) and C50 (mean ± SD, n = 3) were calculated (C), as described in Figure 1B. *P< 0.05, compared with MDP1Msm (ANOVA). (D–F) Comparison of DNA/MDP1Msm and DNA/MDP1-TRX complexes by HS-AFM. Representative HS-AFM images are shown (D, 5 fps). Bar, 10 nm. In the lower panels, HURMsm and TRX are marked. Using the HS-AFM images (5 fps) of DNA/MDP1Msm and DNA/MDP1-TRX complexes, the number (N) of globules localized on and beside DNA were counted (E). N = 161 for MDP1Msm and 155 for MDP1-TRX (*P < 0.05, χ2 test). The size distribution of the globules found on and beside dsDNA were also measured using Image J Fiji (F), as described in the Materials and methods (*P< 0.05; ns, not significant; Mann–Whitney test). (G) Examples of 1HUR-1TRX sets. Red boxes, original HS-AFM time-lapse images of DNA/MDP1-TRX complexes (5 fps, formed in the presence of 1.4–12.5 nM MDP1-TRX); blue-dashed boxes, examples of 1HUR (blue)–1TRX (magenta) sets magnified from the red boxes. Bars, 30 nm. (H) The movement of the single 1HUR–1TRX set during DNA cross-linking, captured by HS-AFM at 5 fps. Upper, original images; lower, marked images. The corresponding movie is presented in Supplementary Video S4. Bar, 30 nm. (I) mIDRMsm positions deduced from the arrays of HURMsm and TRX on cross-linked dsDNAs. Left, original images; right, marked images. Deduced mIDRMsm positions are indicated as dashed green lines. Bar, 20 nm. Other examples are also shown in Supplementary Figure S5A. See also Supplementary Figures S3–S5; Supplementary Video S4; and Supplementary Table S3.
Figure 4.
Figure 4.
Double-sided tape-like DNA cross-linking model by MDP1 mIDR. (A) CGMD snapshots of the virtual HS-AFM system. Representative snapshot of plasmid and MDP1Msm monomers (left), plasmid and MDP1-TRX monomers (middle) and plasmid and MDP1Msm dimers (right). A simulation movie is also presented in Supplementary Videos S5–S7. These views are from above; the structures are viewed from the direction perpendicular to the virtual AFM substrate. DNAs are drawn in silver. For visibility, each MDP1Msm molecule was drawn in red, dark blue or green. TRX-tags are drawn in pink. Arrows indicate DNA intersections where MDP1Msm and MDP1-TRX molecules are bound. (B) Magnified view of DNA compaction by a single MDP1Msm monomer. A simulation movie is presented in Supplementary Video S8a. Here, HURMsm and mIDRMsm of MDP1Msm are drawn in red and yellow, respectively. (C) Upper: a structural model of DNA compaction by multiple MDP1Msm monomers observed in the CGMD simulations. A simulation movie is presented in Supplementary Video S8b. One MDP1 monomer is drawn in red (HURMsm) and yellow (mIDRMsm), and the other is drawn in dark blue (HURMsm) and yellowish green (mIDRMsm). Lower: examples of HS-AFM images. Bars, 10 nm. (D) Distance distributions between the HURMsm and TRX-tag (DHUR-TRX). Upper: the distribution for MDP1-TRX which bundles multiple DNA regions. Lower: the distribution for MDP1-TRX bound to a DNA region without bundling the DNA. (E) Representative structures of dimeric MDP1Msm cross-linking DNA duplexes. The two mIDRs are bound to the DNA in the opposite direction (left), or they are bound to the DNA in the same direction (right). The color code is the same as in (C). See also Supplementary Figures S6 and S7; and Supplementary Videos S5–S8.
Figure 5.
Figure 5.
mIDR length-dependent DNA binding and compaction by MDP1. (A and B) Schematic representation (A) and SDS–PAGE (B) of mIDRMsm-truncated mutants of MDP1Msm. (C) Affinity of mIDRMsm-truncated mutants for supercoiled plasmid (gel retardation assay). Representative gels are shown in Supplementary Figure S8A. Band intensity (mean ± SD, n = 3) and C50 (mean ± SD, n = 3) were calculated as described in Figure 1B. * and #,P< 0.05 compared with MDP1Msm and HURMsm, respectively (ANOVA). (D) Plasmid compaction by each mutant, as described in Figure 1D (n ≥ 22). *P < 0.05 compared with MDP1Msm and #P< 0.05 compared with HURMsm. P< 0.05 (Kruskal–Wallis test and Mann–Whitney test). (E and F) Chromosome compaction after 24 h induction of mIDRMsm-truncated MDP1Msm mutants in the Msm Δmdp1 strain. Representative fluorescence microscopic images are presented (E). The area and major axis length of individual 4′,6-diamidino-2-phenylindole (DAPI)-stained spots were measured and plotted (n ≥ 220 each, F). VC, vector control. *P< 0.05 compared with VC. #P< 0.05 compared with MDP1Msm. and , P< 0.05 (Kruskal–Wallis test and Wilcoxon test). (G) Bacterial growth (OD600 and CFU) after induction of each protein. Mean ± SD, n = 3. *P< 0.05 compared with MDP1Msm (ANOVA). See also Supplementary Figure S8 and Supplementary Table S3.
Figure 6.
Figure 6.
mIDR-mediated DNA cross-linking induces bacterial dormancy phenotype by hijacking the HU functions. (A) Schematic representation of E. coli HUs and their fusion proteins with mIDRMsm. (Band C) Affinity of E. coli HUs and their fusion proteins for supercoiled plasmid (gel retardation assay). Representatives of triplicate gels are shown (B). Band intensity (mean ± SD, n = 3) and C50 (mean ± SD, n = 3) were calculated (C), as described in Figure 1B. *P< 0.05, compared with HURMsm. #P< 0.05, compared with HUα. P< 0.05, compared with HUβ (ANOVA). (D) HS-AFM time-lapse imaging of plasmid morphological changes induced by HUα and HUα-mIDR (5 fps). Left, protein-free; right, incubated with the proteins. Bars, 60 nm. Time-lapse movies are presented in Supplementary Video S9. (E) Plasmid compaction as described in Figure 1D (n = 23). *P< 0.05 (Mann–Whitney test). (F) Bacterial growth (OD600 and CFU) after induction of the indicated protein. *P< 0.05, compared with VC; #P< 0.05, compared with MDP1Msm; P< 0.05, compared with HUα; P< 0.05, compared with HUβ (mean ± SD, n = 3, ANOVA). (Gand H). Flow cytometric analysis of the viability of mycobacterial cells expressing MDP1Msm, HURMsm and HUα-mIDR. After 24 h induction of the indicated protein, mycobacterial cells were stained with SYTO9 and PI. Representative flow cytometry plots of triplicate cultures are shown (G). Bacterial viability was calculated from flow cytometric data (H). Both PI+/SYTO9 and PI+/SYTO9+ mycobacterial cells were considered as dead cells, whereas PI/SYTO9+ were considered as live cells. Unidentified cells (PI/SYTO9) were excluded from the calculation. Mean ± SD (n = 3). *P< 0.05, compared with VC (ANOVA). See also Supplementary Video S9 and Supplementary Table S3.

Similar articles

Cited by

References

    1. Pirofski L., Casadevall A.. The state of latency in microbial pathogenesis. J. Clin. Invest. 2020; 130:4525–4531. - PMC - PubMed
    1. Savitskaya A., Nishiyama A., Yamaguchi T., Tateishi Y., Ozeki Y., Nameta M., Kon T., Kaboso S.A., Ohara N., Peryanova O.V.et al. .. C-terminal intrinsically disordered region-dependent organization of the mycobacterial genome by a histone-like protein. Sci. Rep. 2018; 8:8197. - PMC - PubMed
    1. Wolf S.G., Frenkiel D., Arad T., Finkel S.E., Kolter R., Minsky A.. DNA protection by stress-induced biocrystallization. Nature. 1999; 400:83–85. - PubMed
    1. Loiko N., Danilova Y., Moiseenko A., Kovalenko V., Tereshkina K., Tutukina M., El-Registan G., Sokolova O., Krupyanskii Y.. Morphological peculiarities of the DNA–protein complexes in starved Escherichia coli cells. PLoS One. 2020; 15:e0231562. - PMC - PubMed
    1. Frenkiel-Krispin D., Ben-Avraham I., Englander J., Shimoni E., Wolf S.G., Minsky A.. Nucleoid restructuring in stationary-state bacteria. Mol. Microbiol. 2004; 51:395–405. - PubMed

LinkOut - more resources