. 2023 Dec 4;21(12):e3002402.
doi: 10.1371/journal.pbio.3002402. eCollection 2023 Dec.

Deletion of IFT20 exclusively in the RPE ablates primary cilia and leads to retinal degeneration

Affiliations

Deletion of IFT20 exclusively in the RPE ablates primary cilia and leads to retinal degeneration

Viola Kretschmer et al. PLoS Biol. .

Abstract

Vision impairment places a serious burden on the aging society, affecting the lives of millions of people. Many retinal diseases are of genetic origin, of which over 50% are due to mutations in cilia-associated genes. Most research on retinal degeneration has focused on the ciliated photoreceptor cells of the retina. However, the contribution of primary cilia in other ocular cell types has largely been ignored. The retinal pigment epithelium (RPE) is a monolayer epithelium at the back of the eye intricately associated with photoreceptors and essential for visual function. It is already known that primary cilia in the RPE are critical for its development and maturation; however, it remains unclear whether this affects RPE function and retinal tissue homeostasis. We generated a conditional knockout mouse model, in which IFT20 is exclusively deleted in the RPE, ablating primary cilia. This leads to defective RPE function, followed by photoreceptor degeneration and, ultimately, vision impairment. Transcriptomic analysis offers insights into mechanisms underlying pathogenic changes, which include transcripts related to epithelial homeostasis, the visual cycle, and phagocytosis. Due to the loss of cilia exclusively in the RPE, this mouse model enables us to tease out the functional role of RPE cilia and their contribution to retinal degeneration, providing a powerful tool for basic and translational research in syndromic and non-syndromic retinal degeneration. Non-ciliary mechanisms of IFT20 in the RPE may also contribute to pathogenesis and cannot be excluded, especially considering the increasing evidence of non-ciliary functions of ciliary proteins.


Conflict of interest statement

The authors have declared that no competing interests exist.

Figures
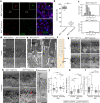
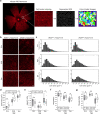
Fig 1
Fig 1. Conditional knockout of Ift20 ablates primary cilia in the RPE without affecting other retinal layers and causes subtle alterations in RPE ultrastructure.
(a) Representative fluorescent images of E16.5 RPE flatmounts stained for ARL13B (red) and GT335 (green) to visualize primary cilia. Staining for F-Actin (magenta) was used to visualize the cytoskeleton, DAPI to stain nuclear DNA. Scale bars: 10 μm. (b) Quantification of primary cilia in E16.5 RPE revealed that Ift20null;Tyrp2-Cre RPE showed significantly less ciliated cells (13% n = 4 eyes (1,039 cells)) compared to controls (84.3% n = 4 eyes (816 cells)). Statistical analysis was performed using ROUT test (Q = 0.1%) before using unpaired t test (p < 0.001). Median: Ift20+/+;Tyrp2-Cre 84.75% Ift20null;Tyrp2-Cre 13.21%. (c) Cilia length data binned at intervals of 0.5 μm. Cilia remaining in the mutant where more likely to be longer than in control. Ift20+/+;Tyrp2-Cre (n = 4 eyes 191 cilia, Ift20null;Tyrp2-Cre n = 4 eyes 43 cilia). (d) Representative images of histological eye sections from 1-month-old mice. In both Ift20null;Tyrp2-Cre and control RPE, no differences in retinal layers could be observed. Scale bar: 25 μm. (e) Representative TEM image of a photoreceptor connecting cilium from control and mutant mice. Photoreceptor connecting cilia remained intact. Scale bar: 1 μm. (f) Schematic showing a typical photoreceptor primary cilium. (g) Representative TEM images of eye sections showing subretinal gaps in Ift20null;Tyrp2-Cre mice at 1 month of age, while they appear to be gone by 4 months. Scale bars: 10 μm. (h) Representative TEM images of eye sections from 4-month-old mice showing multilayered RPE cells (top), as well as the absence of microvilli and accumulation of debris (bottom, red outline, arrow highlights the continuous apical membrane) in Ift20null;Tyrp2-Cre mice. Scale bars: 10 μm. (i) Measurements taken from TEM images: Bruch’s membrane, RPE thickness and RPE to POS distance. (j) Quantification of RPE thickness measured in Ift20+/+;Tyrp2-Cre and Ift20null;Tyrp2-Cre revealed significant differences between 1 and 4 months, but no differences between control and knockout. Median: 1 month Ift20+/+;Tyrp2-Cre 6.0 μm, Ift20null;Tyrp2-Cre 5.0 μm. 4 months: Ift20+/+;Tyrp2-Cre 6.8 μm, Ift20null;Tyrp2-Cre 6.5 μm. (k) Quantification of RPE to POS distance measured in Ift20+/+;Tyrp2-Cre and Ift20null;Tyrp2-Cre shows highly significant differences between control and knockout. Median: 1 month Ift20+/+;Tyrp2-Cre 0.77 μm, Ift20null;Tyrp2-Cre 1.38 μm. 4 months: Ift20+/+;Tyrp2-Cre 1.24 μm, Ift20null;Tyrp2-Cre 2.09 μm. (l) Quantification of Bruch’s membrane thickness measured in Ift20+/+;Tyrp2-Cre and Ift20null;Tyrp2-Cre reveals only slight increase in the mutant at 1 month of age. Median: 1 month Ift20+/+;Tyrp2-Cre 0.65 μm, Ift20null;Tyrp2-Cre 0.75 μm. 4 months: Ift20+/+;Tyrp2-Cre 0.46 μm, Ift20null;Tyrp2-Cre 0.48 μm. Statistical analysis was performed using an unpaired two-tailed t test. (For j–l: 1 month Ift20+/+;Tyrp2-Cre n = 6 eyes, >60 measurements, Ift20null;Tyrp2-Cre n = 6 eyes, >60 measurements; 4 months Ift20+/+;Tyrp2-Cre n = 4 eyes, >50 measurements, Ift20null;Tyrp2-Cre n = 4 eyes, >50 measurements). Significance levels: >0.05 not significant (ns), <0.05 *, <0.01 **, <0.001 ***. Box plots: Box limits represent the first and third quartile, the central line shows the median and the whiskers indicate the 5th and 95th percentile. RPE, retinal pigment epithelium; OS, outer segments; IS, inner segments; ONL, outer nuclear layer; OPL, outer plexiform layer, INL, inner nuclear layer; IPL, inner plexiform layer; Ce, centriole; CC, connecting cilium; Ax, axoneme; TZ, transition zone; BB, basal body; BM: Bruch’s membrane; POS, photoreceptor outer segment; TEM, transmission electron microscopy. Numerical data can be found in S6 Table.
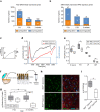
Fig 2
Fig 2. Single-cell-resolution analysis of RPE flatmounts revealed only minor changes to cellular morphology.
(a) Ift20+/+;Tyrp2-Cre and Ift20null;Tyrp2-Cre RPE flatmounts stained with Phalloidin (red), cell borders were automatically analyzed, segmented, and visualized by color-coded images. (b) Representative images showing Phalloidin staining (red) at P11, P29, and 3M of Ift20+/+;Tyrp2-Cre and Ift20null;Tyrp2-Cre RPE flatmounts. Scale bar: 20 μm. (c) Cell area data binned at intervals of 50 μm2. Binned profiles look remarkably similar between control and mutant across all 3 ages examined. (d–g) Quantification of the cell size, AR, number of neighbors, and hexagonality of Ift20+/+;Tyrp2-Cre and Ift20null;Tyrp2-Cre RPE flatmounts. Analysis of cell size revealed a modest increase in cell size in the mutant starting from P29 onwards, while AR was decreasing. No changes were detected in number of neighbors and hexagonality. Median: cell area P11 Ift20+/+;Tyrp2-Cre 208.67 μm2, Ift20null;Tyrp2-Cre 218.08 μm2. P29: Ift20+/+;Tyrp2-Cre 249.7 μm2, Ift20null;Tyrp2-Cre 271.84 μm2. 3m: Ift20+/+;Tyrp2-Cre 287.82 μm2, Ift20null;Tyrp2-Cre 303.72 μm2. Median: aspect ratio P11 Ift20+/+;Tyrp2-Cre 1.375, Ift20null;Tyrp2-Cre 1.365. P29: Ift20+/+;Tyrp2-Cre 1.331, Ift20null;Tyrp2-Cre 1.335. 3m: Ift20+/+;Tyrp2-Cre 1.375, Ift20null;Tyrp2-Cre 1.363. Median: neighbors P11 Ift20+/+;Tyrp2-Cre 5.61, Ift20null;Tyrp2-Cre 5.68. P29: Ift20+/+;Tyrp2-Cre 5.51, Ift20null;Tyrp2-Cre 5.59. 3m: Ift20+/+;Tyrp2-Cre 5.34, Ift20null;Tyrp2-Cre 5.43. Median: hexagonality P11 Ift20+/+;Tyrp2-Cre 8.70, Ift20null;Tyrp2-Cre 8.73. P29: Ift20+/+;Tyrp2-Cre 8.88, Ift20null;Tyrp2-Cre 8.86. 3m: Ift20+/+;Tyrp2-Cre 8.60, Ift20null;Tyrp2-Cre 8.64 μm2. n numbers P11: Ift20+/+;Tyrp2-Cre (7 flat mounts, 163,530 cells); Ift20null;Tyrp2-Cre (14 flat mounts 295,059 cells), P29: Ift20+/+;Tyrp2-Cre (11 flat mounts, 274,428 cells); Ift20null;Tyrp2-Cre (9 flat mounts, 227,064 cells), 3m: Ift20+/+;Tyrp2-Cre (13 flat mounts, 510,473 cells); Ift20null;Tyrp2-Cre (18 flat mounts 675,748 cells). Significance levels: >0.05 not significant (ns), <0.05 *, <0.01 **, <0.001 ***. Box plots: Box limits represent the first and third quartile, the central line shows the median and the whiskers indicate the 5th and 95th percentile. Numerical data can be found in S6 Table. AR, aspect ratio; RPE, retinal pigment epithelium.
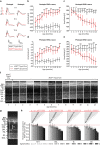
Fig 3
Fig 3. Transcriptomic analysis reveals maturation defects leading to defective function in mutant RPE.
(a) Bar chart showing DEGs obtained via transcriptomic analysis. The number of specific and common DEGs and the orientation of expression are shown. (b) Bar chart depicting the number up- and down-regulated genes for RPE signature genes. At all ages, the number of differentially expressed RPE signature genes decreased; however, across all ages more genes were down-regulated than up-regulated compared to controls. (c) Representative DC-ERG trace showing all components of a DC-ERG response (c-wave, FO, LP, and Off). (d) Averaged trace of DC-ERG response from P25 Ift20null;Tyrp2-Cre mice (red) versus Ift20+/+;Tyrp2-Cre mice (black). Traces were drift-corrected and smoothed by a moving average filter (see Material and methods). Stimulus = 10 cd*s/m2. (e) Quantification of DC-ERG responses. Significant differences were observed in c-wave (p = 0.045), FO (p = 0.029), and LP (p = 0.0056). The off-response showed no significance (p = 0.15). Median: c-wave Ift20+/+;Tyrp2-Cre 1.94 mV, Ift20null;Tyrp2-Cre 1.56 mV. FO Ift20+/+;Tyrp2-Cre 2.42 mV, Ift20null;Tyrp2-Cre 1.92 mV. LP Ift20+/+;Tyrp2-Cre 1.48 mV, Ift20null;Tyrp2-Cre 1.06 mV. Off Ift20+/+;Tyrp2-Cre 0.45 mV, Ift20null;Tyrp2-Cre 0.22 mV. Statistical analysis was performed using the unpaired two-tailed t test. Ift20+/+;Tyrp2-Cre n = 12 eyes, 6 mice, Ift20null;Tyrp2-Cre n = 12 eyes, 6 mice. (f) Schematic of experimental procedure of retinal adhesion assay. After enucleation and removal of the lens, the retina was separated from eyecup ripping off melanin containing apical microvilli. After lysis the melanin was quantified. (g) Quantification of melanin attached to the retina was significantly increased in P16 Ift20null;Tyrp2-Cre compared to controls (p < 0.05). This effect increased over time (3 months of age, p < 0.001). In contrast, the melanin concentration in Ift20+/+;Tyrp2-Cre retinas remained stable between both ages (p > 0.05). Median: P16 Ift20+/+;Tyrp2-Cre 6.47 μg melanin/mg protein, Ift20null;Tyrp2-Cre 5.22 μg melanin/mg protein; 3 months Ift20+/+;Tyrp2-Cre 5.96 μg melanin/mg protein, Ift20null;Tyrp2-Cre 2.29 μg melanin/mg protein. P16 Ift20+/+;Tyrp2-Cre (n = 12 retina); Ift20null;Tyrp2-Cre (n = 6 retina), 3 months Ift20+/+;Tyrp2-Cre (n = 6 retina); Ift20null;Tyrp2-Cre (n = 6 retina). (f) Representative fluorescent images of in vitro phagocytosis assay. Scale bar: 30 μm. (h) In vitro phagocytosis assay. Representative images of fluorescently labeled POS-fed Ift20+/+;Tyrp2-Cre and Ift20null;Tyrp2-Cre RPE cultures. Counterstained with ZO-1 (cell borders) and DAPI (nuclei). (i) Quantification of POS uptake revealed a significant decrease in POS phagocytosis (p = 0.0025) in isolated and cultured Ift20null;Tyrp2-Cre RPE primary cells compared to controls. Statistical analysis was performed using the Welch-corrected parametric unpaired t test (P < 0.05). Experiment 1: Ift20+/+;Tyrp2-Cre = 4 wells/3,396 cells, Ift20null;Tyrp2-Cre = 8 wells/3,904 wells. Experiment 2: Ift20+/+;Tyrp2-Cre = 5 wells/3,608 cells, mutant = 9 wells/4,322 cells. Experiment 3: Ift20+/+;Tyrp2-Cre = 4 wells/2,346 cells, mutant = 6 wells/2,962 cells. POS, photoreceptor outer segments; FO, fast oscillation; LP, light peak; Off, off-response. Significance levels: >0.05 not significant (ns), <0.05 *, <0.01 **, <0.001 ***. Box plots: Box limits represent the first and third quartile, the central line shows the median and the whiskers indicate the 5th and 95th percentile. Numerical data can be found in S6 Table. DC-ERG, direct-coupled electroretinography; DEG, differentially expressed gene; RPE, retinal pigment epithelium.
Fig 4
Fig 4. Loss of IFT20 in the RPE ultimately leads to visual impairment in mice.
(a) Representative traces of the electric responses upon light stimulation of photoreceptors and downstream cells of Ift20+/+;Tyrp2-Cre (black) and Ift20null;Tyrp2-Cre (red) mice in photopic (100 cd*s/m2) and scotopic (10 cd*s/m2) conditions. From 1 month of age until 12 months of age, a degression of the responses was seen. (b) The scotopic a-wave of Ift20null;Tyrp2-Cre rods was significantly lower compared to controls. Over the course of a year, the scotopic a-wave declined to approximately 50%. (c) By the age of 3 months, the scotopic b-wave response of the secondary neurons was significantly lower in Ift20null;Tyrp2-Cre mice compared to controls. The scotopic b-wave also declined to approximately 50% within 1 year. (d) From 3 months of age, the photopic a-wave response of Ift20null;Tyrp2-Cre cones was significantly lower and declined by approximately 50% over the course of a year. (e) From 3 months of age, the photopic b-wave response of Ift20null;Tyrp2-Cre secondary neurons was significantly lower and declined by approximately 50% within 1 year. Statistical analysis was performed using unpaired t test. (f) Representative images of in vivo OCT scans of Ift20null;Tyrp2-Cre mice from 1 to 12 months compared to 1-month-old Ift20+/+;Tyrp2-Cre. Scale bar: 25 μm. (g) Retinal thickness (RET), as well as ONL, IS, and OS were measured 500 μm off the center of the optic nerve. (h) Quantification revealed a reduction in retina thickness of Ift20null;Tyrp2-Cre mice over time, which was accompanied by thinning of the POSs, while inner segment thickness did not significantly decline until 10 months of age. Statistical analysis was performed using Holm–Sidak test (Ift20null;Tyrp2-Cre vs. Ift20+/+;Tyrp2-Cre) and Dunnet’s multiple comparison (age comparison), both followed by a one-way ANOVA. BM, Bruch’s membrane; RPE, retinal pigment epithelium; OS, outer segments; IS, inner segments; OLM, outer limiting membrane; ONL, outer nuclear layer; OPL, outer plexiform layer; INL, Inner nuclear layer; IPL, inner plexiform layer; GCL, ganglion cell layer. For all experiments n > 4 animals. Significance levels: >0.05 not significant (ns), <0.05*, <0.01**, <0.001***. Numerical data can be found in S6 Table. IFT, intraflagellar transport; OCT, optical coherence tomography; RET, retinal thickness.

References

    1. May-Simera HL, Kelley MW. Cilia, Wnt signaling, and the cytoskeleton. Cilia. 2012;1(1):7. doi: 10.1186/2046-2530-1-7 - DOI - PMC - PubMed
    1. May-Simera H, Nagel-Wolfrum K, Wolfrum U. Cilia—The sensory antennae in the eye. Prog Retin Eye Res. 2017;60:144–180. doi: 10.1016/j.preteyeres.2017.05.001 - DOI - PubMed
    1. Ishikawa H, Marshall WF. Ciliogenesis: building the cell’s antenna. Nat Rev Mol Cell Biol. 2011;12(4):222–234. doi: 10.1038/nrm3085 - DOI - PubMed
    1. Pala R, Alomari N, Nauli SM. Primary cilium-dependent signaling mechanisms. Int J Mol Sci. 2017;18(11). doi: 10.3390/ijms18112272 - DOI - PMC - PubMed
    1. Fliegauf M, Benzing T, Omran H. When cilia go bad: cilia defects and ciliopathies. Nat Rev Mol Cell Biol. 2007;8(11):880–893. doi: 10.1038/nrm2278 - DOI - PubMed