. 2024 Mar 14;120(3):249-261.
doi: 10.1093/cvr/cvad179.

'Trapped re-entry' as source of acute focal atrial arrhythmias

Affiliations

'Trapped re-entry' as source of acute focal atrial arrhythmias

Tim De Coster et al. Cardiovasc Res. .

Abstract

Aims: Diseased atria are characterized by functional and structural heterogeneities, adding to abnormal impulse generation and propagation. These heterogeneities are thought to lie at the origin of fractionated electrograms recorded during sinus rhythm (SR) in atrial fibrillation (AF) patients and are assumed to be involved in the onset and perpetuation (e.g. by re-entry) of this disorder. The underlying mechanisms, however, remain incompletely understood. Here, we tested whether regions of dense fibrosis could create an electrically isolated conduction pathway (EICP) in which re-entry could be established via ectopy and local block to become 'trapped'. We also investigated whether this could generate local fractionated electrograms and whether the re-entrant wave could 'escape' and cause a global tachyarrhythmia due to dynamic changes at a connecting isthmus.

Methods and results: To precisely control and explore the geometrical properties of EICPs, we used light-gated depolarizing ion channels and patterned illumination for creating specific non-conducting regions in silico and in vitro. Insight from these studies was used for complementary investigations in virtual human atria with localized fibrosis. We demonstrated that a re-entrant tachyarrhythmia can exist locally within an EICP with SR prevailing in the surrounding tissue and identified conditions under which re-entry could escape from the EICP, thereby converting a local latent arrhythmic source into an active driver with global impact on the heart. In a realistic three-dimensional model of human atria, unipolar epicardial pseudo-electrograms showed fractionation at the site of 'trapped re-entry' in coexistence with regular SR electrograms elsewhere in the atria. Upon escape of the re-entrant wave, acute arrhythmia onset was observed.

Conclusions: Trapped re-entry as a latent source of arrhythmogenesis can explain the sudden onset of focal arrhythmias, which are able to transgress into AF. Our study might help to improve the effectiveness of ablation of aberrant cardiac electrical signals in clinical practice.

Keywords: Atrial arrhythmias; Cell culture; Computer modelling; Fibrosis; Optogenetics.


Conflict of interest statement

Conflict of interest: none declared.

Figures

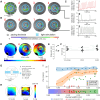
Graphical Abstract
Graphical Abstract
Figure 1
Figure 1
In silico realization of trapped re-entry (2D model). (A) Procedure to initiate a trapped re-entrant wave. Blue dashed lines demarcate the inner circle and outer ring in which the CatCh channels are activated. Light-coloured areas are depolarized, dark-coloured areas are repolarized. (B) Escape of a trapped re-entrant wave following reduction of gap junctional coupling. (C) Voltage traces of three selected representative points showing trapped re-entry with SR in the surrounding bulk tissue in A4 and escape of the re-entrant wave through an isthmus in B8. (D) Line analysis of the electrical activity through the centre of the circuit (vertical axis) over time (horizontal axis). Different release rhythms are observed depending on the global parameters used in the model (see the signals in the bulk tissue at the top and bottoms of each panel). Scale bar: 400 ms. (E) Escape and rotational frequency of trapped waves at different levels of gap junctional coupling (GNa = 100%). (F) Escape and rotational frequency of trapped waves at different sodium conductances (Ggap = 100%).
Figure 2
Figure 2
In vitro realization of trapped re-entry (2D model). (A) Procedure to initiate a trapped re-entrant wave (n = 8 biological replicates). The light blue colour shows the illumination pattern used to locally inactivate the tissue. White arrows superimposed on the optical mapping data depict wave propagation. The radially moving waves in A1 occur upon the onset of illumination. (B) Opening of the optogenetically isolated circuit of conduction with non-illuminated areas (isthmi) of increasing width, such that escape of the trapped wave can occur. (C) Voltage traces at representative points showing trapped re-entry with SR in the surrounding bulk tissue in A4 and escape of the re-entrant wave through an isthmus in B8. (D) Activation map of CatCh-expressing NRAM monolayer showing trapped re-entry. (E) Rotational frequencies of trapped excitation waves. (F) Conduction velocities (CVs) in different regions of the trapped re-entry circuit. The paired Wilcoxon groups signed rank test with α = 0.05 showed no significant difference in CV comparing SR and trapped re-entry. (G) Scheme showing how funnel CVs were measured in CatCh-expressing NRAM monolayers (n = 5 biological replicates). (H) Activation maps of CatCh-expressing NRAM monolayer exposed (right) or not exposed (left) to the illumination pattern shown in (G). (I) CVs as a function of funnel width for the experiments shown in (A–F) and in (G–H). The red and green dots represent failed and successful release of excitation waves from the re-entrant circuits, respectively. The blue and orange dots correspond to NRAM monolayers without and with an optogenetically imposed rectangular conduction block [i.e. before and after blue light stimulation as shown in (G)], respectively. Data of the experiment of (G–H) are presented as average ± standard deviation (blue and orange shaded areas, n = 5 biological replicates).
Figure 3
Figure 3
Optogenetic vs. fibrotic realization of trapped re-entry. (A) The isthmus of a trapped re-entry (TR) circuit can be characterized by the ratio between its inner and outer width (left). Overview of the 15 different isthmus geometries that were tested with their specific d2/d1 ratios (right). (B) Release percentage of a re-entrant wave as a function of circuit geometry and GNa when the geometry is realized through the establishment of an optogenetic conduction block. (C) Release percentage of a re-entrant wave as a function of circuit geometry and GNa when the geometry is realized through fibrotic non-conducting regions. (D, E) Voltage (Vm) line scans through the isthmus under the optogenetically imposed (D) and fibrosis-related (E) conditions of trapped re-entry red square box outlined in (B) and (C).
Figure 4
Figure 4
Design of the 3D funnel-shaped isthmus and the trapped re-entry circuit in human atria. (A) 3D funnel-shaped isthmus between the circuit of trapped re-entry and the bulk tissue. The funnel is gradually widening towards the inner circuit and has a sharp transition into the bulk of the atria. (B) Rotating view of human atria with a circuit of trapped re-entry. The central pictures are enlarged versions of the leftmost pictures in both panels. Atrial structures are indicated by different colours and labels. 1, Middle: anterosuperior view of the atria. For clarity, the circuit of trapped re-entry is indicated in black. When not visible, circuit location is indicated with an arrow. 2, Middle: slightly tilted view relative to (A) that better visualizes the circuit of trapped re-entry. Non-conducting tissue is made transparent for better visualization.
Figure 5
Figure 5
The conditions for trapped re-entry differ between 3D models of healthy and diseased atria. (A) Overview of the three key aspects of trapped re-entry: entrance of an excitation wave into an electrically isolated circuit (left), confinement of the trapped wave inside the circuit (middle) and release of the excitation wave from the circuit (right). (B) Conditions allowing entrapment and release of a re-entrant wave from an isolated circuit. The upper lines in each panel indicate the range (in green colour) of GNa in which the wave can enter the circuit during SR. The lower lines indicate the range (in red colour) of GNa in which the wave can be trapped inside the circuit. The overlaps of both lines (light green boxes) mark the regions in which trapped re-entry is possible. The regions in which release of the re-entrant waves is possible by reduction of Ggap (see Supplementary material online, Table T1) are indicated by dashed lines.
Figure 6
Figure 6
3D realization of trapped re-entry linked to unipolar electrograms. (A) Visualization of the steps involved in trapped re-entry through representative voltage maps (3 pictures/s, 12 s in total). The horizontal red bar denotes the moment an extrasystole and subsequent trapping occurs, while the horizontal green bar marks the escape of the trapped excitation wave. (B) Enlargement of the human atria with anatomical regions indicated by different colours. (C) Relative sodium conductance. (D) Relative gap junctional coupling efficiency. (E) Unipolar electrogram showing SR and tachyarrhythmia in the bulk atrial tissue. (F, G) Unipolar electrograms next to the circuit of trapped re-entry showing fractionation during SR.
Figure 7
Figure 7
Unipolar electrograms recorded around the circuit of trapped re-entry. A total of 85 epicardial unipolar electrograms were taken, 10 of which are visualized for the process shown in Figure 6 with their location indicated on two different views of the atria (1, right lateral view; 2, superior view). Black: atrial bulk tissue, light green: periphery of the circuit, orange: outer fibrotic region, dark green: tissue inside the circuit, and red: inner fibrotic region.

Comment in

References

    1. Odutayo A, Wong CX, Hsiao AJ, Hopewell S, Altman DG, Emdin CA. Atrial fibrillation and risks of cardiovascular disease, renal disease, and death: systematic review and meta-analysis. BMJ 2016;354:i4482. - PubMed
    1. Centurión OA, Isomoto S, Shimizu A, Konoe A, Kaibara M, Hirata T, Hano O, Sakamoto R, Hayano M, Yano K. The effects of aging on atrial endocardial electrograms in patients with paroxysmal atrial fibrillation. Clin Cardiol 2003;26(9):435–438. - PMC - PubMed
    1. Spach MS, Heidlage JF, Dolber PC, Barr RC. Mechanism of origin of conduction disturbances in aging human atrial bundles: experimental and model study. Heart Rhythm 2007;4(2):175–185. - PMC - PubMed
    1. Spach MS, Dolber PC. Relating extracellular potentials and their derivatives to anisotropic propagation at a microscopic level in human cardiac muscle. Evidence for electrical uncoupling of side-to-side fiber connections with increasing age. Circ Res 1986;58(3):356–371. - PubMed
    1. Spach MS, Boineau JP. Microfibrosis produces electrical load variations due to loss of side-to-side cell connections; a major mechanism of structural heart disease arrhythmias. Pacing Clin Electrophysiol 1997;20(2):397–413. - PubMed

Publication types