. 2024 Feb 22;143(8):721-733.
doi: 10.1182/blood.2023022385.

Impaired O2 unloading from stored blood results in diffusion-limited O2 release at tissues: evidence from human kidneys

Affiliations

Impaired O2 unloading from stored blood results in diffusion-limited O2 release at tissues: evidence from human kidneys

Richard Dumbill et al. Blood. .

Abstract

The volume of oxygen drawn from systemic capillaries down a partial pressure gradient is determined by the oxygen content of red blood cells (RBCs) and their oxygen-unloading kinetics, although the latter is assumed to be rapid and, therefore, not a meaningful factor. Under this paradigm, oxygen transfer to tissues is perfusion-limited. Consequently, clinical treatments to optimize oxygen delivery aim at improving blood flow and arterial oxygen content, rather than RBC oxygen handling. Although the oxygen-carrying capacity of blood is increased with transfusion, studies have shown that stored blood undergoes kinetic attrition of oxygen release, which may compromise overall oxygen delivery to tissues by causing transport to become diffusion-limited. We sought evidence for diffusion-limited oxygen release in viable human kidneys, normothermically perfused with stored blood. In a cohort of kidneys that went on to be transplanted, renal respiration correlated inversely with the time-constant of oxygen unloading from RBCs used for perfusion. Furthermore, the renal respiratory rate did not correlate with arterial O2 delivery unless this factored the rate of oxygen-release from RBCs, as expected from diffusion-limited transport. To test for a rescue effect, perfusion of kidneys deemed unsuitable for transplantation was alternated between stored and rejuvenated RBCs of the same donation. This experiment controlled oxygen-unloading, without intervening ischemia, holding all non-RBC parameters constant. Rejuvenated oxygen-unloading kinetics improved the kidney's oxygen diffusion capacity and increased cortical oxygen partial pressure by 60%. Thus, oxygen delivery to tissues can become diffusion-limited during perfusion with stored blood, which has implications in scenarios, such as ex vivo organ perfusion, major hemorrhage, and pediatric transfusion. This trial was registered at www.clinicaltrials.gov as #ISRCTN13292277.


Conflict of interest statement

Conflict-of-interest disclosure: P.F. and C.C. are founders, shareholders, and directors of OrganOx Ltd, and serve, respectively, as its Chief Medical and Technical Officers for which they receive consultancy fees. R.D., S.K., and J.F. have received consultancy fees from OrganOx Ltd. The remaining authors declare no competing financial interests.

Figures

None
Graphical abstract
Figure 1.
Figure 1.
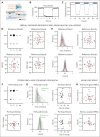
Experimental design for testing oxygen delivery to perfused kidneys. (A) Higher arterial blood flow increases oxygen delivery to the kidney (O2 supply). This also increases glomerular filtration and hence tubular reabsorption (O2 demand). In a perfusion-limited scenario, O2 supply and demand should be matched and a linear relationship is expected between arterial oxygen flow and renal respiration. Otherwise, if oxygen exchange from blood to the kidney was diffusion-limited, then the relationship between arterial oxygen flow and renal respiration is expected to tail off. Thus, it is possible to test for diffusion-limited oxygen exchange by relating measurements of renal respiration with arterial oxygen flow. (B) Image of machine for normothermic kidney perfusion and schematic diagram of the circuit in the kidney perfusion machine: 1, kidney; 2, organ containing with perforated kidney sling; 3, arterial cannula at kidney inlet; 4, venous cannula at kidney outlet; 5, ureter outlet duct; 6, urine flow meter; 7, duct for recirculation of fluids leaked by the kidney; 8, soft-shell reservoir; 9, centrifugal perfusion pump; 10, oxygenator and heat exchanger; 11, heat exchanger water inlet; 12, heat exchanger water outlet; 13, oxygenator has inlet; 14, in-line blood gas analysis sensor; 15, arterial flow meter; 16, arterial pressure sensor; and 17, infusion or syringe pump.
Figure 2.
Figure 2.
Normothemic kidney perfusion provides comprehensive data on renal function. (A) Data on kidney weight, perfusion time, time-averaged arterial blood flow, arterial Na+, creatinine clearance, and arterial Hb. (B) Analysis of arterial and venous gases. (C) Time course of blood flow for first 6 hours of perfusion. (D) Time course of arterial pH for first 6 hours of perfusion. (E) Renal respiration calculated from blood gases.
Figure 3.
Figure 3.
Single-cell oxygen saturation imaging characterizes RBC O2-handling kinetics. (A) Microfluidic chamber for producing rapid solution exchange in imaged RBCs under superfusion. (B) Rapid exchange is achieved in the millisecond scale (frame acquisition: 51 ms). (C) Experiment on freshly drawn venous blood showing time course of oxygen unloading from imaged RBCs, quantified in terms of time constant (τ) and capacity (κ). (D) Reference blood freshly drawn from veins of healthy volunteers. Distribution by blood group, donor age, mean corpuscular volume (MCV), and mean corpuscular Hb concentration (MCHC). On each box, the central mark indicates the median; bottom and top edges indicate the 25th over 75th percentiles; the whiskers extend to the most extreme data points not considered outliers. (E) Analysis of reference blood. (Top) Time constant frequency distribution (red curve shows mean) and summary statistics; (bottom) capacity frequency distribution and summary statistics. (F) Stored blood used for perfusions. Distribution by blood group and distribution of storage time (days). (G) Analysis of stored blood. (Top) Time constant frequency distribution (green line shows reference blood mean) and summary statistics; (bottom) capacity frequency distribution and statistics. (H) Analysis of venous blood obtained from recipient of the kidney. (Top) Time constant statistics; (bottom) capacity statistics.
Figure 4.
Figure 4.
Evolution of changes in RBC O2-handling kinetics during kidney perfusion. (A) RBC O2-unloading time constant measured at various points (x-axis) during perfusion for the 30 cases (along y-axis). (B) RBC O2-unloading capacity measured at various points (x-axis) during perfusion for the 30 cases (along y-axis). (C) Analysis of stored blood at the end of perfusion. Time constant frequency distribution (green line shows reference blood mean). (D) Analysis of stored blood at the end of perfusion. Capacity frequency distribution (green line shows reference blood mean). (E) Effect of kidney perfusion on RBC oxygen-unloading time constant (significant decrease; paired t test) and capacity (no significant change; paired t test). (F) Initial oxygen-unloading rate calculated from the time constant and capacity. “End” denotes measurement towards end of perfusion; “pre” denotes packed RBCs prior to perfusion.
Figure 5.
Figure 5.
Relating blood-borne O2 delivery with renal respiratory rate. (A) Strong linear relationship between arterial blood flow and arterial oxygen delivery calculated assuming perfusion-limited gas exchange. Statistical testing by the Pearson correlation coefficient. (B) Nonsignificant relationhip between arterial oxygen delivery (DO2PL) and renal respiratory rate (v′R,O2), assuming perfusion-limited transport. (C) Strong, negative correlation between the RBC oxygen-unloading time constant and renal respiration (v'RO2). Reference range (red) determined from reference blood. (D) Strong, positive correlation between arterial DO2 scaled by RBC initial oxygen-unloading rate (κ/τ) to model a diffusion-limited process, and renal respiration.
Figure 6.
Figure 6.
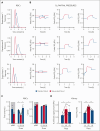
Evaluating the effect of biochemical rejuvenation on the ex vivo perfused kidney. Data shown for 3 independent experiments. (A) Single-cell oxygen saturation imaging of RBCs that had been biochemically rejuvenated or sham treated. Rejuvenation robustly restores the unloading time constant of long-stored RBCs toward reference values. (B) Matched time courses of partial pressures of O2 (PO2) in arterial blood, kidney cortex, and urine during the 3 experimental phases: perfusion with standard (sham-treated) blood, rejuvenated blood, and back to standard blood. Significant improvements are observed in cortical and urine PO2 during perfusion with rejuvenated red cells. (C) Oxygen-unloading kinetics (top) and its carrying capacity (bottom) measured in samples taken during the 3 phases of the experiment, in comparison to packed blood prior to perfusion. Significant effect of rejuvenation on kinetics during phase 2 (paired t test). (D) Oxygen diffusion capacity is significantly enhanced by rejuvenation, as is cortical oxygenation (paired t test).

Comment in

References

    1. Boron WF. In: Medical Physiology. Boulpaep EL, Boron WF, editors. Saunders Elsevier; 2009. Chapter 30: “Ventilation and perfusion of the lungs”; pp. 690–692.
    1. Kobayashi H, Pelster B, Piiper J, Scheid P. Diffusion and perfusion limitation in alveolar O2 exchange: shape of the blood O2 equilibrium curve. Respir Physiol. 1991;83(1):23–34. - PubMed
    1. Piiper J, Scheid P. Model for capillary-alveolar equilibration with special reference to O2 uptake in hypoxia. Respir Physiol. 1981;46(3):193–208. - PubMed
    1. Leach RM, Treacher DF. The pulmonary physician in critical care ∗ 2: oxygen delivery and consumption in the critically ill. Thorax. 2002;57(2):170–177. - PMC - PubMed
    1. Rivers E, Nguyen B, Havstad S, et al. Early goal-directed therapy in the treatment of severe sepsis and septic shock. N Engl J Med. 2001;345(19):1368–1377. - PubMed

Publication types