. 2024 Jan:190:106370.
doi: 10.1016/j.nbd.2023.106370. Epub 2023 Dec 2.

PI3K signaling promotes formation of lipid-laden foamy macrophages at the spinal cord injury site

Affiliations

PI3K signaling promotes formation of lipid-laden foamy macrophages at the spinal cord injury site

Christine B Ryan et al. Neurobiol Dis. 2024 Jan.

Abstract

After spinal cord injury (SCI), infiltrating macrophages undergo excessive phagocytosis of myelin and cellular debris, forming lipid-laden foamy macrophages. To understand their role in the cellular pathology of SCI, investigation of the foamy macrophage phenotype in vitro revealed a pro-inflammatory profile, increased reactive oxygen species (ROS) production, and mitochondrial dysfunction. Bioinformatic analysis identified PI3K as a regulator of inflammation in foamy macrophages, and inhibition of this pathway decreased their lipid content, inflammatory cytokines, and ROS production. Macrophage-specific inhibition of PI3K using liposomes significantly decreased foamy macrophages at the injury site after a mid-thoracic contusive SCI in mice. RNA sequencing and in vitro analysis of foamy macrophages revealed increased autophagy and decreased phagocytosis after PI3K inhibition as potential mechanisms for reduced lipid accumulation. Together, our data suggest that the formation of pro-inflammatory foamy macrophages after SCI is due to the activation of PI3K signaling, which increases phagocytosis and decreases autophagy.

Keywords: Autophagy; Foamy macrophages; Lipids; Neuroinflammation; PI3K; Spinal cord injury.


Conflict of interest statement

Declaration of Competing Interest The authors declare no competing interests exist.

Figures

Fig. 1.
Fig. 1.. Lipid-laden foamy macrophages express increased levels of pro-inflammatory cytokines and reactive oxygen species that is associated with mitochondrial dysfunction.
(A) Representative images and cytokine array blot in non-foamy (media) and foamy (Homogenate) macrophages. Neutral lipid droplets stained with Nile Red (green) and nuclei with DAPI (blue). Scale Bar = 20 μm. (B) Quantification of cytokine expression in foamy and non-foamy macrophages (Student’s t-test per cytokine, n = 4 biological replicates per group). Pixel Density normalized to Reference Spot Intensity, all shown are statistically significant. (C) Representative images of cells treated with Mitosox ROS indicator (red). (Scale Bar = 50 μm). (D) Quantification of Mitosox+ cells as a percentage of total cells (One-way ANOVA with Tukey’s post-hoc test, n = 4 biological replicates per group, *p ≤ 0.05 compared to media treated cells, error bars = SEM). (E) Schematic of Seahorse Mitochondrial Stress Test injection scheme and outcome measures. (F) Oxygen Consumption Rate (OCR, normalized to cell number) was measured in media (non-foamy) versus homogenate-treated (foamy) macrophages. (Student’s t-test, n = 5 biological replicates per group, *p ≤ 0.05 compared to media treated cells, error bars = SEM). (G-M) OCR quantifications for: Non-mitochondrial Oxygen Consumption, Basal Respiration, ATP-Dependent Respiration, Proton Leak, Maximal Respiration, Spare Respiratory Capacity (%), and Coupling Efficiency. Y-axis represents OCR in units of pmol/min/105 cells, unless otherwise specified. (Student’s t-test, n = 5 biological replicates per group, *p ≤ 0.05 relative to media treated cells, error bars = SEM).
Fig. 2.
Fig. 2.. Inhibition of PI3K/Akt/mTOR pathway identified by pathway analysis reduces lipid accumulation in foamy macrophages.
(A-B) Enriched KEGG pathways from the STRING Protein Network Database using significantly upregulated cytokines in foamy macrophages identifies 3 target pathways: AGE-RAGE, Jak-STAT, and PI3K/Akt/mTOR. “Count in network” refers to the number of input genes present in the KEGG term, “Strength” denotes the enrichment effect and is defined as Log10(observed / expected). The node colors correspond to the highlighted pathways and connecting nodes indicate documented protein-protein interactions, from either experimental validation or curated databases. (C) Representative images from cells treated with inhibitors against the AGE-RAGE, PI3K/Akt/ mTOR, and Jak/STAT pathways at 1 μM or 10 μM. Neutral lipid droplets stained with Nile Red (green), cell membrane with Cell Mask (pseudo-colored red), and nuclei with DAPI (blue). Scale Bar = 50 μm. (D) Quantification of lipid content demonstrates that inhibiting the PI3K/Akt/mTOR pathway significantly reduces lipid droplet accumulation. (One way ANOVA with Tukey’s post-test, n = 4 biological replicates per group, *p < 0.05 relative to vehicle-treated cells).
Fig. 3.
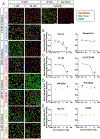
Fig. 3.. PI3K is the likely target of Torin-2 that leads to reduced lipid accumulation in foamy macrophages.
(A) Representative images from foamy macrophages treated with vehicle or indicated inhibitors at 10 nM, 100 nM, 1 μM, 10 μM. Neutral lipid droplets stained with Nile Red (green), cell membrane with Cell Mask (pseudo-colored red), and nuclei with DAPI (blue). Scale Bar = 50 μm. (B-E) Dose response with 4-parameter nonlinear regression fit for lipid droplet intensity. x-axis is expressed in logarithmic form. (One Way ANOVA with Tukey’s post-test, n = 3 biological replicates per group, *p ≤ 0.05 compared to Hom + Vehicle treated cells, error bars = SEM.) (B) mTOR inhibitors, Torin-2 and rapamycin. (C) PI3K inhibitors, PI-103 and CH5132799. (D) CSFR1 inhibitors, PLX-5622 and GW-2580. (E) CLK4 inhibitors, ML-167 and TG003.
Fig. 4.
Fig. 4.. Activation of PI3K/mTOR pathways in foamy macrophages.
(A) Representative Western blot of Phospho-S6 (32 kDa, mTOR activation) and Beta-actin (42 kDa, loading control) obtained from foamy macrophages incubated with (or without) spinal cord homogenate and treated with PI3K/mTOR inhibitors (PI-103 and CH5132799 are PI3K inhibitors) for 24 h. (B) Western blot intensity values were normalized to loading controls. (One Way ANOVA with Tukey’s post-test, n = 2 biological replicates, *p ≤ 0.05 compared to Vehicle+Homogenate treated cells, error bars SEM). (CD) Torin-2 and rapamycin dose response with 4-parameter nonlinear regression fit for lipid droplet intensity*number and cell number. x-axis is expressed in logarithmic form. (One Way ANOVA with Tukey’s post-hoc test, n = 3 per condition, biological replicates, *p ≤ 0.05 compared to Hom + Vehicle treated cells, error bars SEM). (E) Representative immunocytochemistry images of p-Akt (Ser473) and total Akt in foamy macrophages treated with vehicle, Torin-2, or rapamycin at 10 μM for 6h. p-Akt and total Akt (green), cell membrane with Cell Mask (pseudo-colored red), and nuclei with DAPI (blue).Scale Bar = 50 μm. (F) Quantification of mean sum immunofluorescence intensity per cell across indicated conditions (One Way ANOVA with Tukey’s post-hoc test, n = 3 per condition, biological replicates, *p ≤ 0.05 compared to Hom + Vehicle treated cells, error bars SEM).
Fig. 5.
Fig. 5.. Lipid accumulation in foamy macrophages is mediated through multiple PI3K isoforms.
(A) Representative images of foamy macrophages treated with the following inhibitors: PI3K-alpha isoform inhibitor BYL-719, PI3K-beta isoform inhibitor TGX-221, PI3K-delta isoform inhibitor Idelalisib, PI3K-gamma isoform inhibitor AS-605240. Concentrations tested include 0.11 μM, 0.33 μM, 1 μM, 3 μM, 9 μM, 27 μM, 81 μM. Neutral lipid droplets stained with Nile Red (green), cell membrane with Cell Mask (pseudo-colored red), and nuclei with DAPI (blue). Scale Bar = 100 μm. (B-E) 4-parameter nonlinear regression fit dose response curves for lipid droplet intensity*number product (left) and cell number (right) with indicated compounds/targets. x-axis is expressed in logarithmic form. (One Way ANOVA with Tukey’s post-hoc test, n = 3–4 biological replicates per inhibitor, *p ≤ 0.05 compared to Hom + Vehicle treated cells, error bars = SEM).
Fig. 6.
Fig. 6.. Inhibition of PDK1, a downstream effector of PI3K, also reduces lipid droplets in foamy macrophages.
(A) Representative images of foamy macrophages treated with the following inhibitors: Pdk1 inhibitor GSK233447, PDK1 inhibitor OSU-03012, Akt inhibitor MK-2206, Akt inhibitor BAY1125976. Concentrations tested include 0.11 μM, 0.33 μM, 1 μM, 3 μM, 9 μM, 27 μM, 81 μM. Neutral lipid droplets stained with Nile Red (green), cell membrane with Cell Mask (pseudo-colored red), and nuclei with DAPI (blue). Scale Bar = 100 μm. (B-E) 4-parameter nonlinear regression fit dose response curves for lipid droplet intensity*number product (left) and cell number (right) with indicated compounds/targets. x-axis is expressed in logarithmic form. (One Way ANOVA with Tukey’s post-hoc test, n = 3–4 biological replicates per group, *p ≤ 0.05 compared to Hom + Vehicle treated cells, error bars = SEM).
Fig. 7.
Fig. 7.. Torin-2 reduces the inflammatory signature of foamy macrophages in vitro, and their lipid content after spinal cord injury in vivo.
(A) Representative images of cells (brightfield) treated with Mitosox ROS indicator (red). Scale Bar = 50 μm. (B) Quantification of Mitosox+ cells as a percentage of total cells (Two-way ANOVA with Bonferonni post-test, n = 4 biological replicates per group, *p ≤ 0.05 compared to vehicle treated cells, error bars SEM.) (C) IL1α, Ccl2, Ccl6 mRNA expression quantified by qPCR analysis (One-way ANOVA with Tukey’s post-hoc, n = 3 biological replicates *p ≤ 0.05 compared to vehicle, error bars = SEM. (D-E) Representative images from 7 dpi lesion epicenter of Oil Red O (ORO, red) lipid content in CD11b + cells (green) in animals treated with PBS or Torin-2 liposomes. Scale Bar = 200 μm in low magnification images, Scale Bar = 50 μm in high magnification images. (F) Injection scheme for 7 dpi timepoint (1, 3, 6 dpi). (G) Oil Red O quantifications normalized to CD11b + cell number. Student’s t-test, n = 9 biological replicates per group, *p ≤ 0.05 compared to PBS, error bar = SEM.
Fig. 8.
Fig. 8.. RNA-seq identifies unique biological processes after Torin-2 treatment in foamy macrophages.
(A) Heatmap of all differentially expressed genes (DEGs). DEGs are taken from all pair-wise comparisons between treatment groups. Expression values are z-scored (i.e. standardized and centered at 0). Biological replicates are indicated numerically (B) Set membership of upregulated and downregulated genes across conditions (C–F) Gene Ontology (GO) term enrichment analysis using genes that were upregulated in (C) Torin vs Vehicle or (E) Rapamycin vs Vehicle, and downregulated in (D) Torin vs Vehicle or (F) Rapamycin vs Vehicle.
Fig. 9.
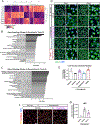
Fig. 9.. Gene cluster enriched in Torin-2 treated foamy macrophages is associated with autophagy.
(A) Hierarchal clustering of differentially-expressed genes. Biological replicates are indicated numerically. (B, C) Gene Ontology terms for genes enriched (Cluster 3) or de-enriched (Cluster 4) in Torin-2 samples. (D) Representative images of LC3II+ puncta in cells that were treated with media or homogenate and vehicle or drug (Torin-2 or rapamycin at 10 μM) for 24 h, followed by 6 h of Bafilomycin A (BafA) treatment. DAPI nuclei in blue. Scale Bar = 50 μm. (E) Quantification of fold-change in LC3II+ intensity*number product in +BafA/−BafA conditions for each treatment group (One-way ANOVA with Tukey post-test, n = 3–5 biological replicates per group, *p ≤ 0.05 compared to vehicle, error bars = SEM). (F) Representative images of p62 immunofluorescence in cells treated with media or homogenate and vehicle or Torin-2 at 10 μM. p62 (pseudo-colored yellow), cell membrane with Cell Mask (pseudo-colored red), and nuclei with DAPI (blue). Scale Bar = 50 μm. (G) Quantification of sum p62 fluorescence intensity per cell for each treatment group (One-way ANOVA with Tukey post-test, n = 3 biological replicates per group, *p ≤ 0.05 compared to vehicle, error bars = SEM).

Similar articles

Cited by

References

    1. Aderem A, Underhill DM, 1999. Mechanisms of phagocytosis in macrophages. Annu. Rev. Immunol 17, 593–623. - PubMed
    1. Ahumada-Castro U, et al., 2019. MTOR-independent autophagy induced by interrupted endoplasmic reticulum-mitochondrial Ca(2+) communication: a dead end in cancer cells. Autophagy. 15, 358–361. - PMC - PubMed
    1. Al-Ali H, et al., 2015. Rational polypharmacology: systematically identifying and engaging multiple drug targets to promote axon growth. ACS Chem. Biol 10, 1939–1951. - PMC - PubMed
    1. Alexa A, Rahnenfuhrer J, 2023. topGO: Enrichment Analysis for Gene Ontology. doi: 10.18129/B9.bioc.topGO. R package version 2.54.0, https://bioconductor.org/packages/topGO. - DOI
    1. Ballesteros-Alvarez J, Andersen JK, 2021. mTORC2: the other mTOR in autophagy regulation. Aging Cell 20, e13431. - PMC - PubMed

Publication types