. 2023 Dec 4;14(1):8010.
doi: 10.1038/s41467-023-43146-w.

Longitudinal development of category representations in ventral temporal cortex predicts word and face recognition

Affiliations

Longitudinal development of category representations in ventral temporal cortex predicts word and face recognition

Marisa Nordt et al. Nat Commun. .

Abstract

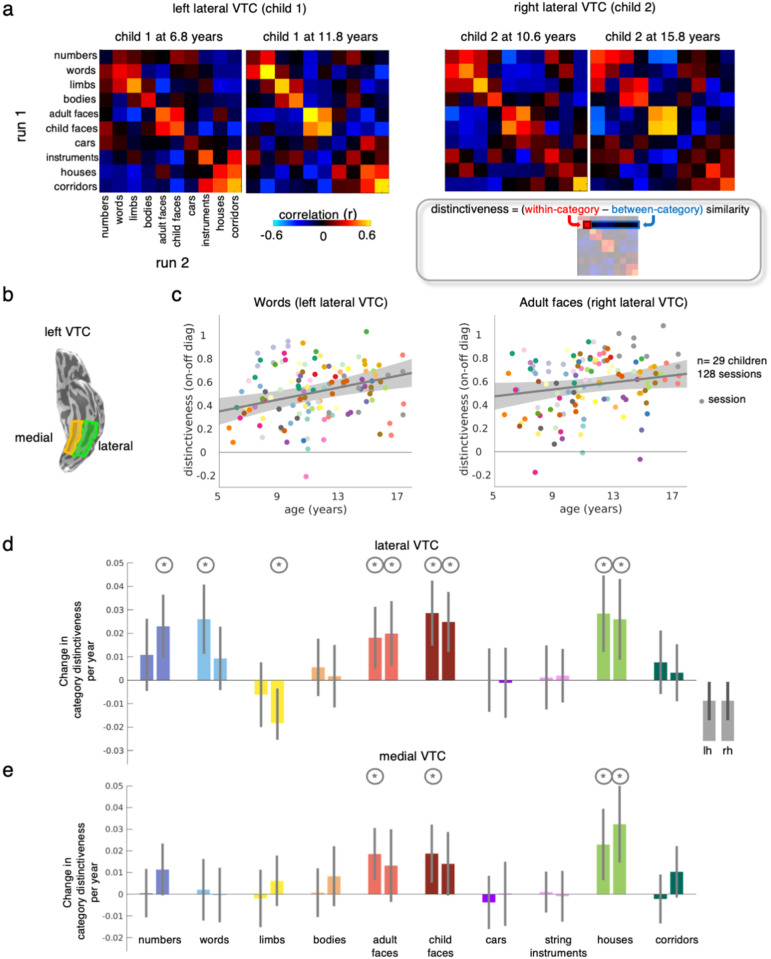
Regions in ventral temporal cortex that are involved in visual recognition of categories like words and faces undergo differential development during childhood. However, categories are also represented in distributed responses across high-level visual cortex. How distributed category representations develop and if this development relates to behavioral changes in recognition remains largely unknown. Here, we used functional magnetic resonance imaging to longitudinally measure the development of distributed responses across ventral temporal cortex to 10 categories in school-age children over several years. Our results reveal both strengthening and weakening of category representations with age, which was mainly driven by changes across category-selective voxels. Representations became particularly more distinct for words in the left hemisphere and for faces bilaterally. Critically, distinctiveness for words and faces across category-selective voxels in left and right lateral ventral temporal cortex, respectively, predicted individual children's word and face recognition performance. These results suggest that the development of distributed representations in ventral temporal cortex has behavioral ramifications and advance our understanding of prolonged cortical development during childhood.


Conflict of interest statement

The authors declare no competing interests.

Figures

Fig. 1
Fig. 1. Differential longitudinal development of category representations in children’s ventral temporal cortex (VTC).
a Representational similarity matrices (RSM) of left and right lateral VTC in individual sessions of two children at different ages. Gray box: Schematic illustrating how distinctiveness is computed for each category. b Left lateral (green) and medial (yellow) VTC on the ventral inflated surface of an example participant. c Scatter plots illustrate the relationship between distinctiveness and age. Gray line: Linear mixed model (LMM) prediction of distinctiveness by age (random intercept model with participant as a random effect). Shaded gray: 95% confidence interval (CI) of the slope. Participants are coded by color. Each dot is a session. Note that the statistics in the text and the data in (d) report developmental results from a LMM that includes two factors: age and tSNR. d LMM slopes indicating a change in distinctiveness per year in lateral VTC (LMM relating distinctiveness to age, with tSNR as an independent factor, and participant as random effect, n = 128 sessions, 29 children) for each category; for space, we refer to pseudowords as words. Error bars: 95% confidence interval (CI) of the slope. If the CI does not cross the y = 0 line, the change in distinctiveness is significantly different than 0. Asterisks: significant development (p < 0.05). Circles around asterisks: significant development after FDR-correction to adjust for multiple comparisons. e same as D but for medial VTC. Full statistics are reported in Tables S1–2.
Fig. 2
Fig. 2. Development of distributed representation in the selective voxels in lateral VTC.
a Bars indicate the change in category distinctiveness per year (LMM relating distinctiveness to age and tSNR, with participant as a random effect, n = 128 sessions, 29 children) in different subsets of voxels of lateral VTC. Maroon bars: the union of voxels that were selective to one of the 10 categories in lateral VTC. Category-selectivity was computed by contrasting responses to a category vs. all other categories except the other category from the same domain (e.g., numbers vs. all other categories except words). A voxel was defined as selective to a category when t > 3. Overall ~36.5% of lateral VTC voxels were selective to one of the categories (see schematic in box). Gray bars: the remainder, non-selective voxels of lateral VTC that were not selective to any of these categories. Darker colors: left hemisphere. Lighter colors: right hemisphere. Error bars: 95% CI. If the CI does not cross the y = 0 line, the change in distinctiveness is significantly different than 0. Asterisks indicate significant development (p< 0.05). Circles around asterisks indicate significant development after FDR-correction to adjust for multiple comparisons. b Same as A but for medial VTC. Full statistics are reported in Tables S3–6.
Fig. 3
Fig. 3. Development of the representational space of the 10 categories in lateral VTC.
Multidimensional scaling (MDS) embeddings for the category representation in different subsets of voxels for two age groups: 5–9-year-olds (n = 16 participants, small circles) and 13–17-year-olds (n = 13 participants, larger circles). These age groups are used to illustrate the change in the representational space and are based on average RSMs of children in two age groups. All statistics are run using the full sample (Figs. 2, 3c, f). One session per child is included per MDS of each age group. a, d MDS embedding of the representational space across the union of selective voxels in left (a) and right (d) lateral VTC. b, e MDS embedding the representational space of the remainder, non-selective voxels of left (b) and right (e) lateral VTC. c, f Line plots depicting the change in representational spaces in individual children in left (c) and right (f) lateral VTC across the selective and non-selective voxels. The change in representation is the mean Euclidian distance between category positions in the MDS embedding of a child’s first session vs their last session. Each line is a participant (n = 29); Gray: larger distances in the selective voxels; Red: larger distances in the non-selective voxels.
Fig. 4
Fig. 4. Distinctiveness for words and faces in left and right lateral VTC, respectively, predict reading and face recognition performance in individual children.
a Linear mixed model (LMM) with random slopes and intercepts relating reading performance of pseudowords (Woodcock Reading Mastery Test, WRMT) to pseudoword distinctiveness over the union of selective voxels of left lateral VTC. Model parameters indicated in the bottom, p-Value adjusted for multiple comparisons (see text). Each dot is a session; Dots are colored by participant. Colored lines: individual slopes and intercepts. Thick gray line: LMM prediction. Shaded gray: 95% CI of the slope. b Left: Median error in predicting the reading performance of a left-out participant from their distinctiveness for pseudowords in left lateral VTC using the parameters derived from the LMM of the rest of the participants (leave-one-out-cross validation). Higher values indicate worse model prediction. The box plots show the prediction error for three different models: Selective: LMM predicting behavior from distinctiveness over the union of selective voxels. Non-selective voxels: LMM predicting behavior from distinctiveness over the non-selective voxels. Selective & age: LMM predicting behavior from distinctiveness over the union of selective voxels with age as an additional factor. Boxplots show the 75% and 25% percentiles (shaded areas) and the median (horizontal lines). Whiskers extend to the most extreme data points not considered outliers (values more than 1.5 times the interquartile range away from the bottom or top of the box). Gray plus signs: outliers. Right: Swarm plots showing the difference between the prediction error for selective vs. non-selective voxels. Each dot is a participant. Statistics of the two-sided t-test (at bottom), n = 26. c Same as (a) but for LMM parameters for a model relating face recognition performance (Cambridge face recognition memory test (CFMT), adult faces) and distinctiveness for adult faces over the selective voxels of right lateral VTC. d Same as (b) but for face recognition performance and distinctiveness for adult faces in right lateral VTC, n = 29.

References

    1. Fausey CM, Jayaraman S, Smith LB. From faces to hands: changing visual input in the first two years. Cognition. 2016;152:101–107. doi: 10.1016/j.cognition.2016.03.005. - DOI - PMC - PubMed
    1. Carey S, Diamond R, Woods B. Development of face recognition - a maturational component? Dev. Psychol. 1980;16:257–269. doi: 10.1037/0012-1649.16.4.257. - DOI
    1. Germine LT, Duchaine B, Nakayama K. Where cognitive development and aging meet: face learning ability peaks after age 30. Cognition. 2011;118:201–210. doi: 10.1016/j.cognition.2010.11.002. - DOI - PubMed
    1. Gaillard R, et al. Direct intracranial, fMRI, and lesion evidence for the causal role of left inferotemporal cortex in reading. Neuron. 2006;50:191–204. doi: 10.1016/j.neuron.2006.03.031. - DOI - PubMed
    1. Mégevand P, et al. Seeing scenes: topographic visual hallucinations evoked by direct electrical stimulation of the parahippocampal place area. J. Neurosci. 2014;34:5399–5405. doi: 10.1523/JNEUROSCI.5202-13.2014. - DOI - PMC - PubMed

Publication types