. 2023 Dec 4;14(1):8003.
doi: 10.1038/s41467-023-43645-w.

CXCL12 targets the primary cilium cAMP/cGMP ratio to regulate cell polarity during migration

Affiliations

CXCL12 targets the primary cilium cAMP/cGMP ratio to regulate cell polarity during migration

Melody Atkins et al. Nat Commun. .

Abstract

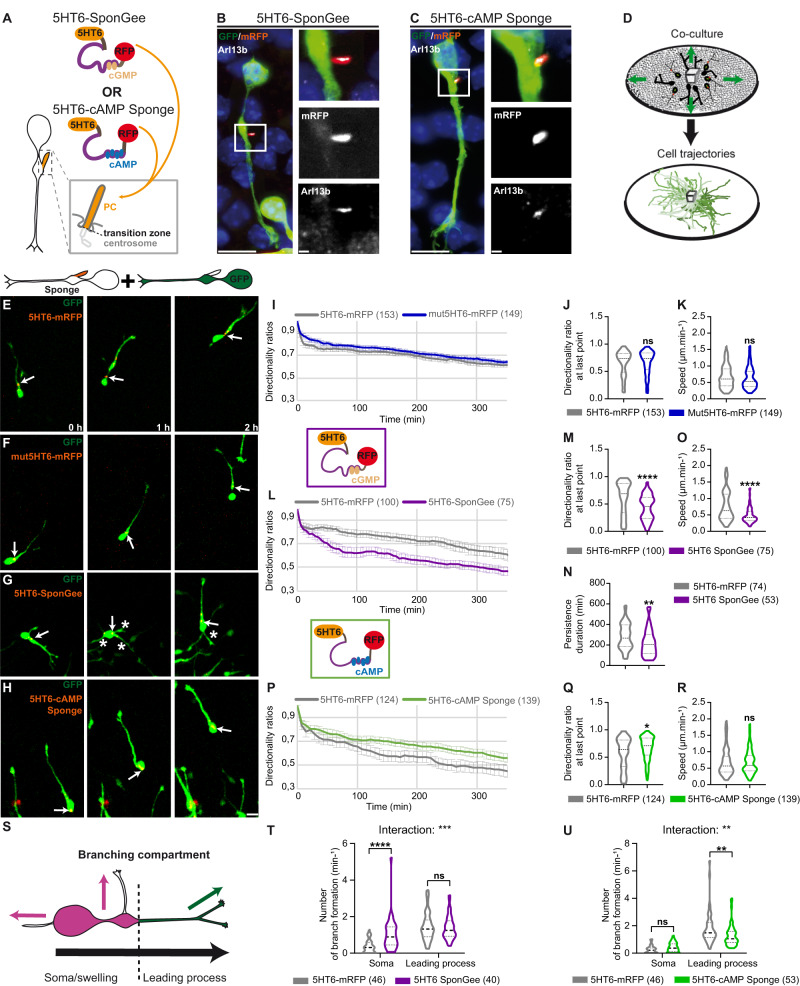
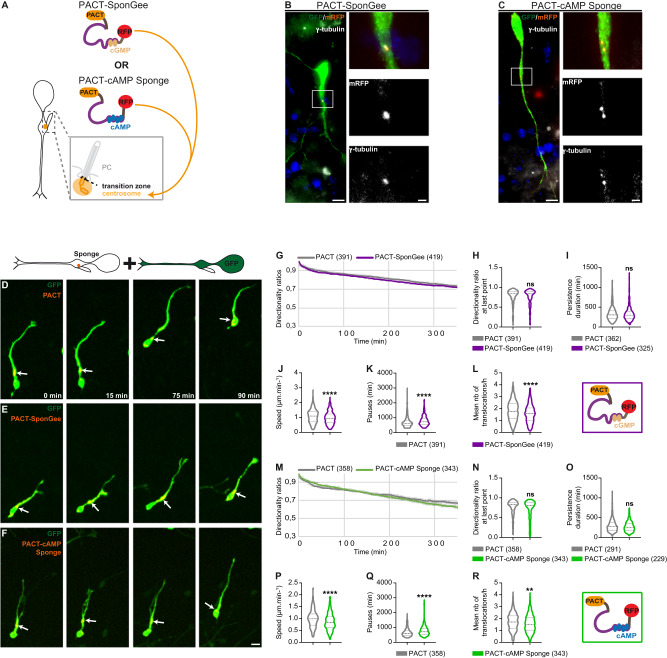
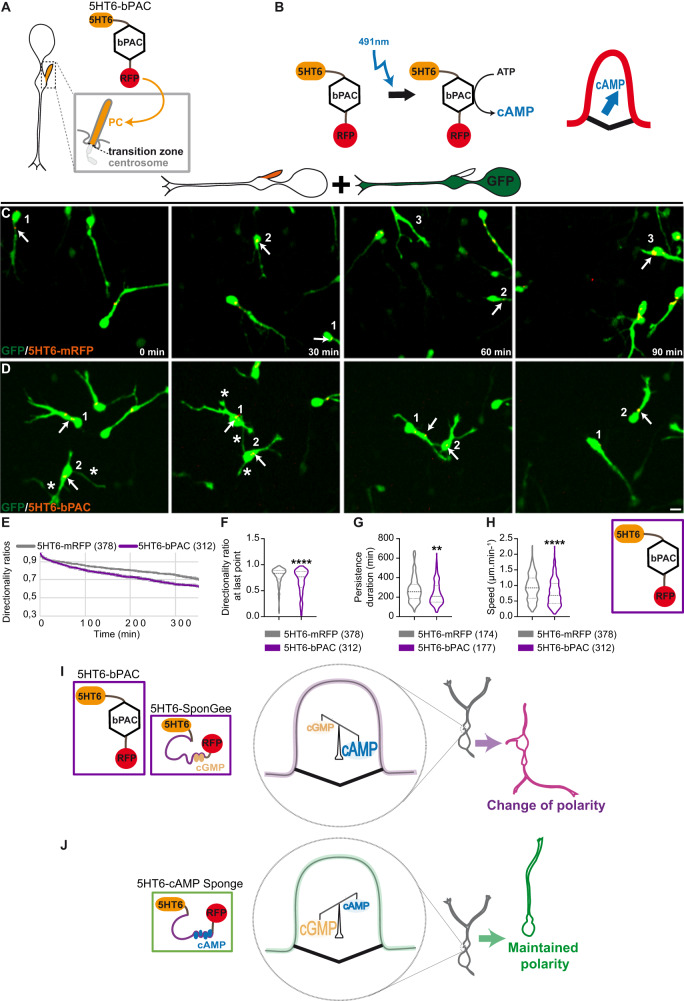
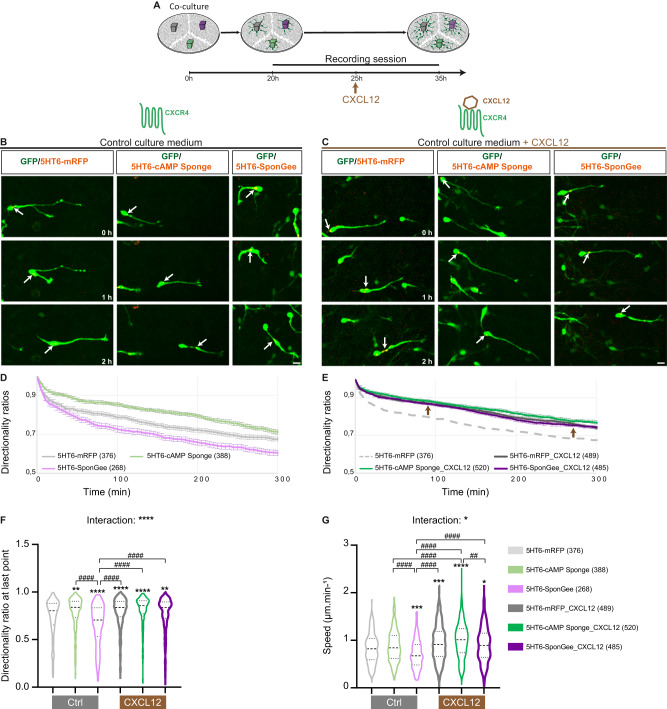
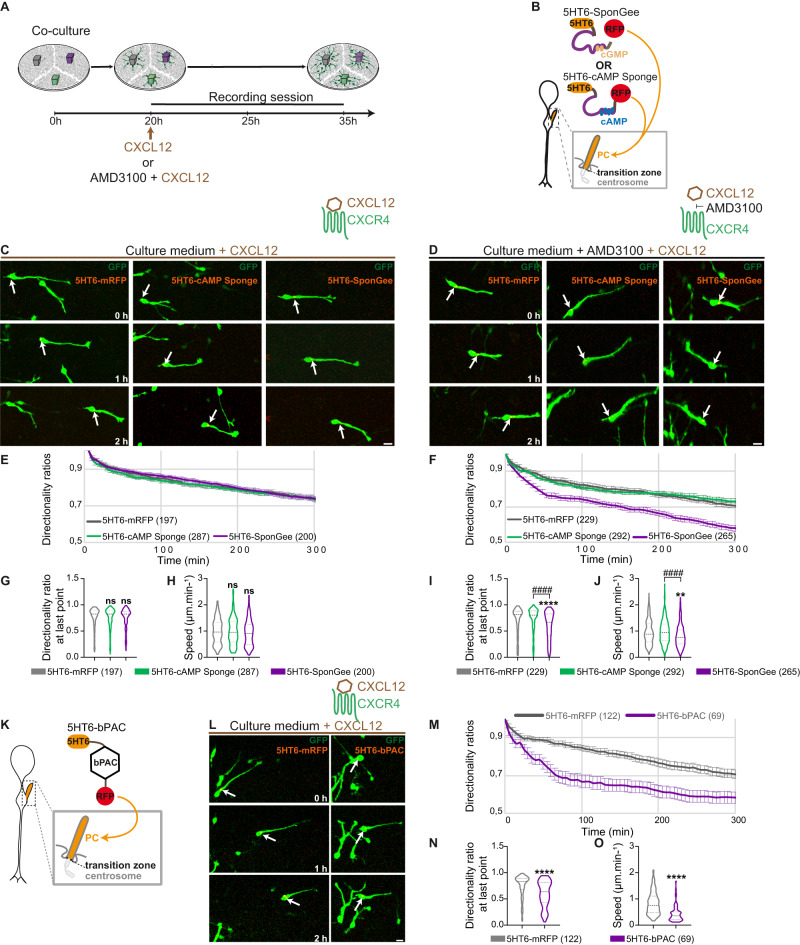
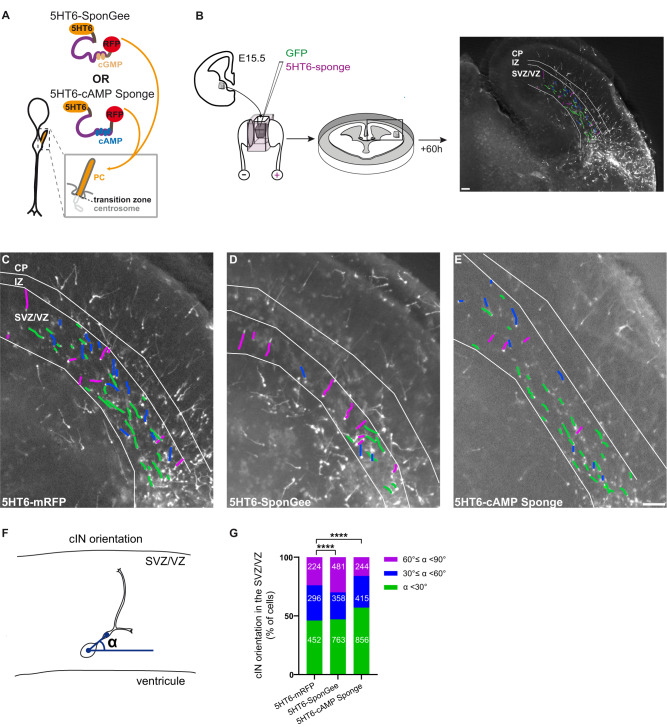
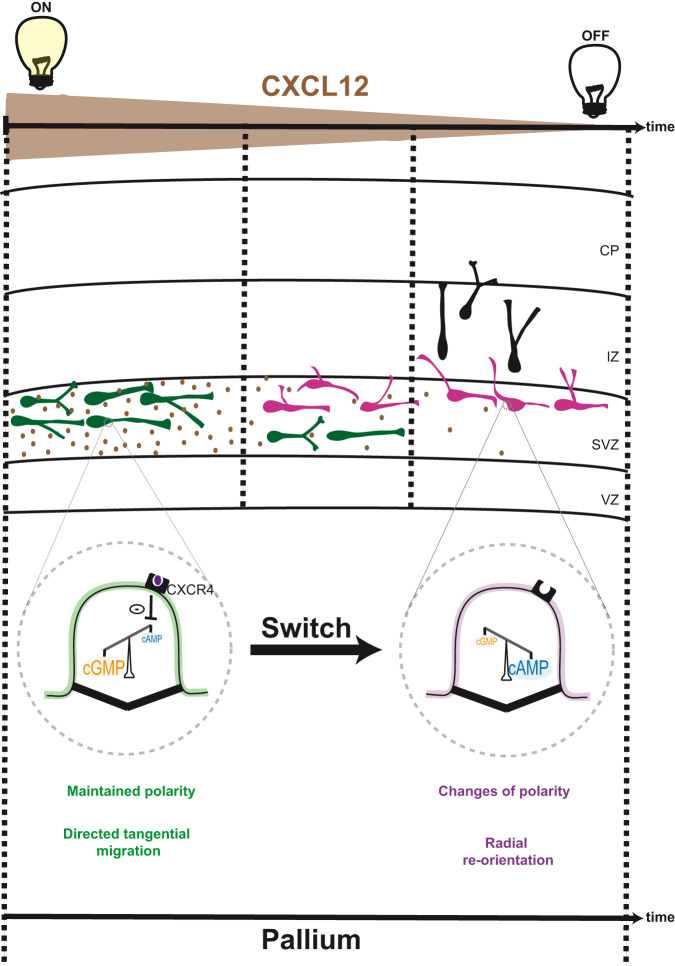
Directed cell migration requires sustained cell polarisation. In migrating cortical interneurons, nuclear movements are directed towards the centrosome that organises the primary cilium signalling hub. Primary cilium-elicited signalling, and how it affects migration, remain however ill characterised. Here, we show that altering cAMP/cGMP levels in the primary cilium by buffering cAMP, cGMP or by locally increasing cAMP, influences the polarity and directionality of migrating interneurons, whereas buffering cAMP or cGMP in the apposed centrosome compartment alters their motility. Remarkably, we identify CXCL12 as a trigger that targets the ciliary cAMP/cGMP ratio to promote sustained polarity and directed migration. We thereby uncover cAMP/cGMP levels in the primary cilium as a major target of extrinsic cues and as the steering wheel of neuronal migration.


Conflict of interest statement

The authors declare no competing interests.

Figures

Fig. 1
Fig. 1. Specific buffering of ciliary cGMP or cAMP signals impairs cortical interneuron migratory behaviours in an opposite manner.
A Cortical interneuron PC, organised by the centrosome and separated from the cytoplasm by the transition zone. The mRFP-tagged SponGee or cAMP Sponge are fused to 5HT6 for PC targeting. B, C High magnification of cortical interneurons co-electroporated with a cytoplasmic GFP construct and 5HT6-SponGee (B) or 5HT6-cAMP Sponge (C). Immunostaining with anti-GFP, anti-RFP and anti-Arl13b antibodies revealed the efficient co-localisation of the mRFP-tagged sponges with Arl13b. Insets are higher magnifications of the boxed region on the left. Scale bar, 5 μm; in insets, 1 μm. Co-localisation was observed in three independent experiments. D MGE explant co-cultured on a dissociated cortical substrate. MGE-derived cortical interneurons display individual trajectories that radiate away from the MGE explant. EH Time-lapse recordings of cortical interneurons co-electroporated with the GFP cytoplasmic construct and the control mRFP-tagged 5HT6 (E) and mut5HT6 constructs (F), 5HT6-SponGee (G, see Supplementary Movie 1) or 5HT6-cAMP Sponge (H, see Supplementary Movie 2). Arrows and asterisks point at the dynamic mRFP-tagged PC and branch formation at the soma, respectively. Scale bar, 10 μm. I–R Mean directionality ratios at each time point (I, L, P) or after a maximum 350-minute migration period (J, M, Q), mean persistence duration (N) and mean migration speed (K, O, R) measured between the 5HT6 and the mut5HT6 (IK), 5HT6-SponGee (LO) or 5HT6-cAMP Sponge conditions (PR). S Schematics of branch quantification in (T, U). Leading process branches (green) initiate milder changes in direction (green arrow) than branches from the soma/swelling (pink; pink arrows). T, U Mean branching frequency from the soma/swelling and leading process for 5HT6-SponGee- (T) and 5HT6-cAMP Sponge-electroporated cells (U) compared to 5HT6 controls. The number of cells is indicated in the graph legends. *, P ≤ 0.05; **, P ≤ 0.01; ***, P ≤ 0.001; ****, P ≤ 0.0001, ns, non significant. Two-tailed Mann–Whitney test (J, K, M, N, O, Q, R). Two-way ANOVA test with Bonferroni’s multiple comparison post test (TU). (T) Interaction: ***; Genotype effect: **; Compartment effect: ****. (U) Interaction: **; Genotype effect: ns; Compartment effect: ****. Error bars are SEM. Source data and p values are provided in the Source data file.
Fig. 2
Fig. 2. Buffering cGMP or cAMP at the centrosome of migrating cortical interneurons similarly dysregulates nucleokinesis without affecting cell polarity.
A Representative scheme of the centrosome located in the cytoplasm at the base of the PC. The mRFP-tagged SponGee or cAMP Sponge scavengers are addressed to the centrosome by fusion to the PACT sequence. B, C High magnification of cortical interneurons co-electroporated with a cytoplasmic GFP construct and PACT-SponGee (B) or PACT-cAMP Sponge (C). Immunostaining with anti-GFP, anti-RFP and anti-γ-tubulin antibodies revealed the efficient co-localisation of the mRFP-tagged sponges with the centrosome. Insets are higher magnifications of the boxed region on the left. Scale bar, 5 μm; in insets, 1 μm. Co-localisation of our scavengers with γ-tubulin was observed in three independent experiments. DF Time-lapse recordings of cortical interneurons co-electroporated with the cytoplasmic GFP construct and the control mRFP-tagged PACT (D), PACT-SponGee (E) or PACT-cAMP Sponge (F). Arrows point at the mRFP-tagged centrosome. Scale bar, 10 μm. GR Mean directionality ratios at each time point (G, M), after a maximum 350- (H) or 300-min migration period (N), mean persistence duration (I,O), mean migration speed (J, P) mean pause duration (K, Q) and mean number of translocations per hour (L, R) measured between the PACT and PACT-SponGee (GL) or PACT-cAMP Sponge (MR) conditions. The number of cells is indicated in the graph legends. **, P ≤ 0.01, ****, P ≤ 0.0001, ns, non significant. Two-tailed Mann–Whitney test (H, I, J, K, L, N, O, P, Q, R). Error bars are SEM. Source data and p values are provided as a Source data file.
Fig. 3
Fig. 3. Increasing ciliary cAMP levels by photo-activation induces frequent changes in polarity.
A Representative scheme of the cortical interneuron PC, anchored to the centrosome via the mother centriole and physically separated from the cytoplasm by the transition zone. The mRFP-tagged bPAC construct is targeted to the PC by fusion to the 5HT6 targeting sequence. B 5HT6-bPAC is photo-activated by blue light (491 nm laser) every minute for 2,1 s, leading to increased ciliary cAMP production. C, D Time-lapse recordings of cortical interneurons co-electroporated with the GFP cytoplasmic construct and the control mRFP-tagged 5HT6 (C) or 5HT6-bPAC (D). Arrows and asterisks point at the dynamic mRFP-tagged PC and branch formation at the soma, respectively. Scale bar, 10 μm. E Graphical representation of the mean directionality ratios at each time point. F Mean directionality ratio after a maximum 350-minute migration period. G, H Mean persistence duration (G) and migration speed (H). I, J Model depicting a ciliary cAMP/cGMP balance mechanism that regulates cortical interneuron polarity. Electroporation with 5HT6-bPAC or 5HT6-SponGee favours a ciliary balance conformation with higher cAMP levels compared to cGMP, and is associated with frequent changes of polarity (I). By contrast, inverting this ciliary cAMP/cGMP balance by electroporation of 5HT6-cAMP Sponge inverts the polarity phenotype from frequent to rare changes of polarity (and vice versa; J). The number of cells is indicated in the graph legends. **, P ≤ 0.01, ****, P ≤ 0.0001, ns, non significant. Two-tailed Mann–Whitney test (FH). Error bars are SEM. Source data and p values are provided as a Source data file.
Fig. 4
Fig. 4. CXCL12 bath application increases cell directionality in a way that mimics ciliary cAMP buffering.
A Representative scheme of the in vitro protocol. MGE explants electroporated with 5HT6 (grey), 5HT6-SponGee (purple) and 5HT6-cAMP Sponge (green) are co-cultured on dissociated cortical cells. Live imaging starts as cortical interneurons initiate their migration and continues for 10 h after CXCL12 is added to the culture medium. B, C Time-lapse recordings of cortical interneurons migrating in control medium (B) or after CXCL12 bath application (C). Interneurons were co-electroporated with the GFP cytoplasmic construct and the control mRFP-tagged 5HT6 (B, C, left-hand sequence), 5HT6-cAMP Sponge (B, C, middle) or 5HT6-SponGee (B, C, right-hand sequence). Arrows point at the dynamic mRFP-tagged PC. Scale bar, 10 μm. D, E Graphical representation of the mean directionality ratios at each time point over a 5-h period, prior to (light curves, D) and after (dark curves, E) CXCL12 application, for the 5HT6, 5HT6-cAMP Sponge and 5HT6-SponGee conditions. Directionality ratios are represented on two sets of graphs for more clarity, although all directionality ratios (prior or after drug application) were measured during a same experimental setup. The light dotted grey curve depicted in (E) corresponds to the control 5HT6-mRF condition prior to drug application that is also represented in (D). Brown arrows highlight the increased directionality induced by CXCL12 application, independently of the electroporated construct. F, G Mean directionality ratio after a maximum 5-hour migration period (F) and mean migration speed (G) for the 5HT6, 5HT6-cAMP Sponge and 5HT6-SponGee conditions prior to and after CXCL12 bath application. The number of cells is indicated in the graph legends. Statistically significant differences are reported using the * or # symbols, when comparing values to the 5HT6 condition or between non-control conditions, respectively. *, P ≤ 0.05; **, P ≤ 0.01; ***, P ≤ 0.001; **** or ####, P ≤ 0.0001. Two-way ANOVA test with Bonferroni’s multiple comparison post test. F Interaction: ****; Genotype effect:****; Treatment effect: ****. G Interaction: *; Genotype effect: ****; Treatment effect: ****. Error bars are SEM. Source data and p values are provided as a Source data file.
Fig. 5
Fig. 5. CXCL12 influence on cell polarity requires its binding to CXCR4 and a decrease in ciliary cAMP levels.
A MGE explants electroporated with 5HT6 (grey), 5HT6-SponGee (purple) and 5HT6-cAMP Sponge (green) are co-cultured on dissociated cortical cells. After 20 h, CXCL12, with or without AMD3100, is added to the culture medium. Live imaging is then performed for 15 h. B The mRFP-tagged SponGee or cAMP Sponge are fused to 5HT6 for PC targeting. C, D Time-lapse recordings of cortical interneurons co-electroporated with the GFP cytoplasmic construct and the PC-targeted 5HT6-mRFP (C, D, left-hand sequences), 5HT6-cAMP Sponge (C, D, middle sequences) or 5HT6-SponGee (C, D, right-hand sequences). Imaging was performed in the presence of CXCL12 (C) or CXCL12 and AMD3100 (D). White arrows indicate the dynamic mRFP-tagged PC. Scale bar, 10 μm. E, F Mean directionality ratios at each time point over a 5-h period in the presence of CXCL12 (E) or AMD3100 + CXCL12 (F). GJ Mean directionality ratio after a maximum 5-h migration period (G, I) and mean migration speed (H, J) for 5HT6-mRFP-, 5HT6-cAMP Sponge and 5HT6-SponGee-electroporated cells in the presence of CXCL12 (G, H) or AMD3100 + CXCL12 (I, J). K The mRFP-tagged bPAC construct is fused to 5HT6 for PC targeting. L Time-lapse recordings of cortical interneurons co-electroporated with the GFP cytoplasmic construct and the PC-targeted 5HT6-mRFP (left) and bPAC (right) constructs. Imaging was performed in the presence of CXCL12. Scale bar, 10 μm. M Mean directionality ratios at each time point over a 5-h period. N Mean directionality ratio after a maximum 5-h migration period. O Mean migration speed. The number of cells is indicated in the graph legends. Statistically significant differences are reported using the * or # symbols, when comparing values to the 5HT6 condition or between non-control conditions, respectively. **, P ≤ 0.01; P ≤ 0.0001; **** or ####, P ≤ 0.0001, ns, non significant. Kruskal-Wallis test (G, H; I, J) with Dunn’s multiple comparisons test (I, J) and two-tailed Mann–Whitney test (NO). Error bars are SEM. Source data and p values are provided as a Source data file.
Fig. 6
Fig. 6. Ciliary cGMP or cAMP buffering impairs the orientation of cortical interneurons migrating ex vivo in the SVZ.
A Representative scheme of a cortical interneuron PC. The mRFP-tagged SponGee or cAMP Sponge chelators are fused to the 5HT6 sequence for PC targeting. B MGEs are dissected from E15.5 mouse embryos and co-electroporated with the cytoplasmic GFP construct and the desired scavenger. Electroporated MGEs are then grafted at the pallium-subpallium boundary of E15.5 organotypic slices and cells are left to migrate for 60 h before fixation. Scale bar, 100 µm. CE Epifluorescence acquisition of E15.5 brain organotypic slices grafted with MGEs co-electroporated with GFP and 5HT6 (C), 5HT6-SponGee (D) or 5HT6-cAMP Sponge (E). Slices were immunostained with the anti-RFP and anti-GFP antibodies. For clarity’s sake, only the GFP staining is represented. SVZ/VZ, IZ and CP regions were delimitated using the dapi staining. Leading processes of migrating cells are drawn in green, purple or blue according to the value of their orientation angle (see F, G, below), namely tangential to the ventricle, radial or intermediate (respectively). Scale bar, 100 µm. F Representative scheme of the orientation angle (α) measured for each migrating cortical interneuron between the soma-swelling axis and the tangential to the ventricle. G α orientation angles were distributed in three categories corresponding to low (<30° or tangential orientation; green), high (>60° or radial orientation; purple) and intermediate angles (30° ≤ α < 60°; blue). The number of cells is indicated on graphs. Orientation angles were measured for cells obtained from four (5HT6-mRFP, 16 organotypic slices), five (5HT6-SponGee, 19 organotypic slices) and five (5HT6-cAMP Sponge, 16 organotypic slices) embryonic brains. Differential distribution of these angles was tested for 5HT6-cAMP Sponge- and 5HT6-SponGee-electroporated cells compared to controls using two-tailed Chi-square tests. ****, P ≤ 0.0001. SVZ subventricular zone, VZ ventricular zone, IZ intermediate zone, CP cortical plate, cIN cortical interneuron. Source data and p values are provided as a Source data file.
Fig. 7
Fig. 7. Model of the ciliary cAMP/cGMP switch activated by CXCL12 to set the tangential migration mode of cortical interneurons in SVZ.
Within the SVZ, ventrally-born cortical interneurons (in green) are exposed to CXCL12 secreted by cortical intermediate progenitors. CXCL12 binds to the ciliary CXCR4 receptor of migrating cells, thereby inhibiting adenylyl cyclase-dependent cAMP production within the PC. The ciliary cAMP/cGMP balance is stabilised in a conformation with low ciliary cAMP levels compared to cGMP (Fig. 3, magnified PC in green), stabilising the polarity of migrating cells within the deep tangential stream, promoting sustained tangential migration. The proportion of tangentially oriented cells therefore increases compared to control cells, at the expense of radially oriented cells (Fig. 6). As CXCL12 expression decreases along time, adenylyl cyclase-dependent production of ciliary cAMP resumes gradually and ciliary cAMP levels increase, favouring a ciliary balance conformation with high cAMP levels compared to cGMP (magnified PC in purple). Cortical interneuron polarity is consequently unlocked and cortical interneurons extend new processes from the soma-swelling compartment, which can become new leading processes. The proportion of cells with radially oriented leading processes increases compared to controls (Fig. 6). CXCL12 expression is represented in brown as a decreasing gradient on the time axis. VZ ventricular zone, SVZ subventricular zone, IZ intermediate zone, CP cortical plate.

References

    1. Tsai L-H, Gleeson JG. Nucleokinesis in neuronal migration. Neuron. 2005;46:383–388. doi: 10.1016/j.neuron.2005.04.013. - DOI - PubMed
    1. Bellion A, Baudoin J-P, Alvarez C, Bornens M, Métin C. Nucleokinesis in tangentially migrating neurons comprises two alternating phases: forward migration of the Golgi/centrosome associated with centrosome splitting and myosin contraction at the rear. J. Neurosci. 2005;25:5691–5699. doi: 10.1523/JNEUROSCI.1030-05.2005. - DOI - PMC - PubMed
    1. Schaar BT, McConnell SK. Cytoskeletal coordination during neuronal migration. Proc. Natl. Acad. Sci. 2005;102:13652–13657. doi: 10.1073/pnas.0506008102. - DOI - PMC - PubMed
    1. Nachury MV, Mick DU. Establishing and regulating the composition of cilia for signal transduction. Nat. Rev. Mol. Cell Biol. 2019;20:389–405. doi: 10.1038/s41580-019-0116-4. - DOI - PMC - PubMed
    1. Tobin JL, et al. Inhibition of neural crest migration underlies craniofacial dysmorphology and Hirschsprung’s disease in Bardet-Biedl syndrome. Proc. Natl. Acad. Sci. USA. 2008;105:6714–6719. doi: 10.1073/pnas.0707057105. - DOI - PMC - PubMed

Publication types