. 2023 Dec 4;14(1):8009.
doi: 10.1038/s41467-023-43646-9.

A structure of the relict phycobilisome from a thylakoid-free cyanobacterium

Affiliations

A structure of the relict phycobilisome from a thylakoid-free cyanobacterium

Han-Wei Jiang et al. Nat Commun. .

Erratum in

Abstract

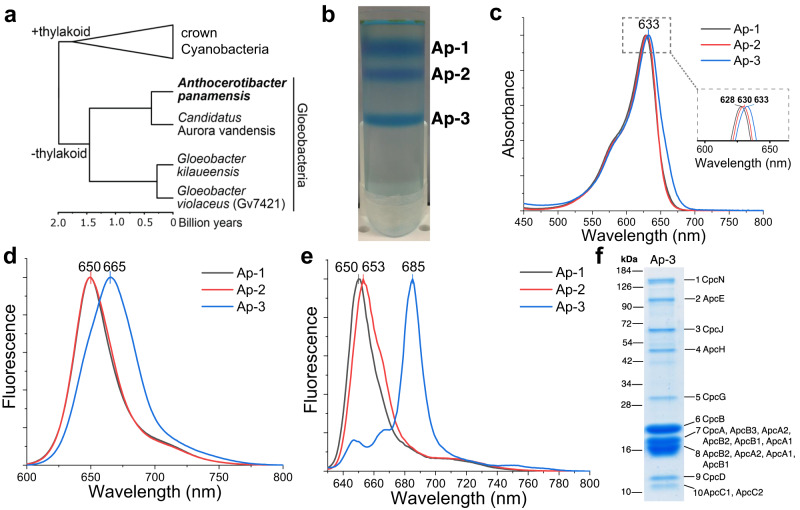
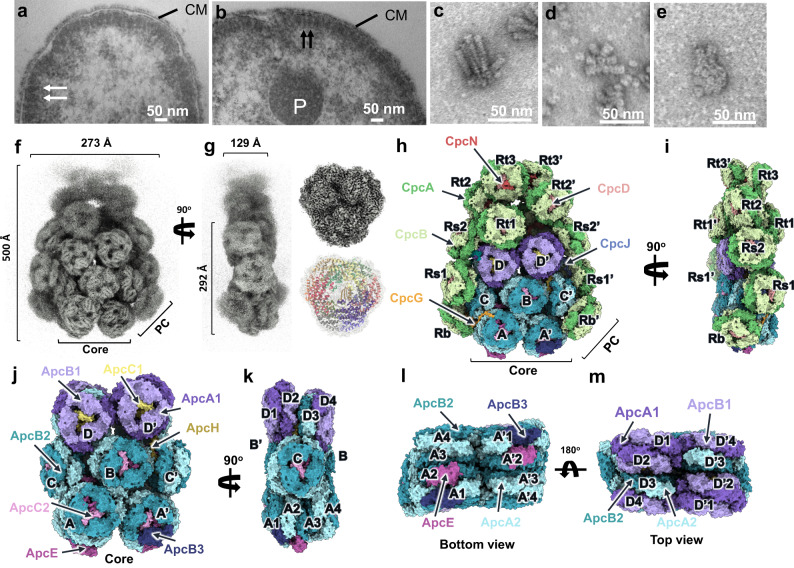
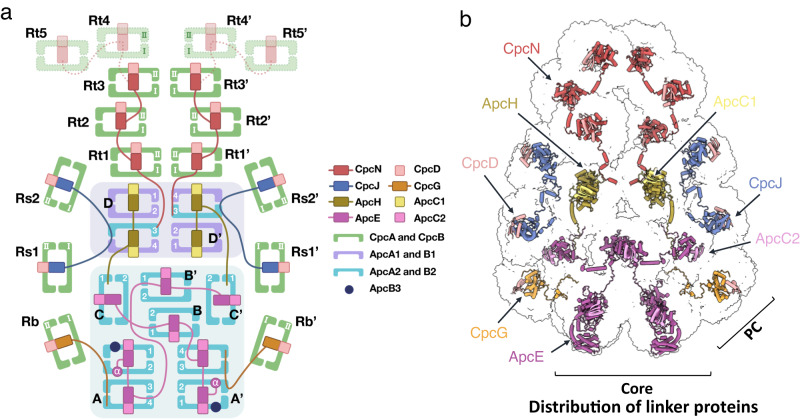
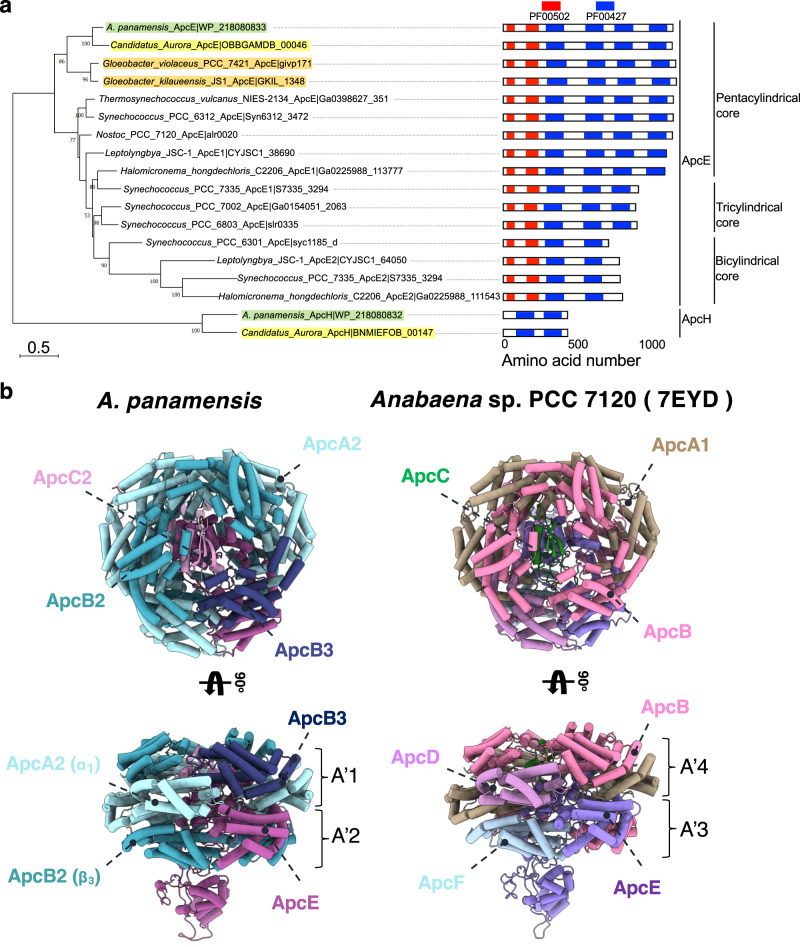
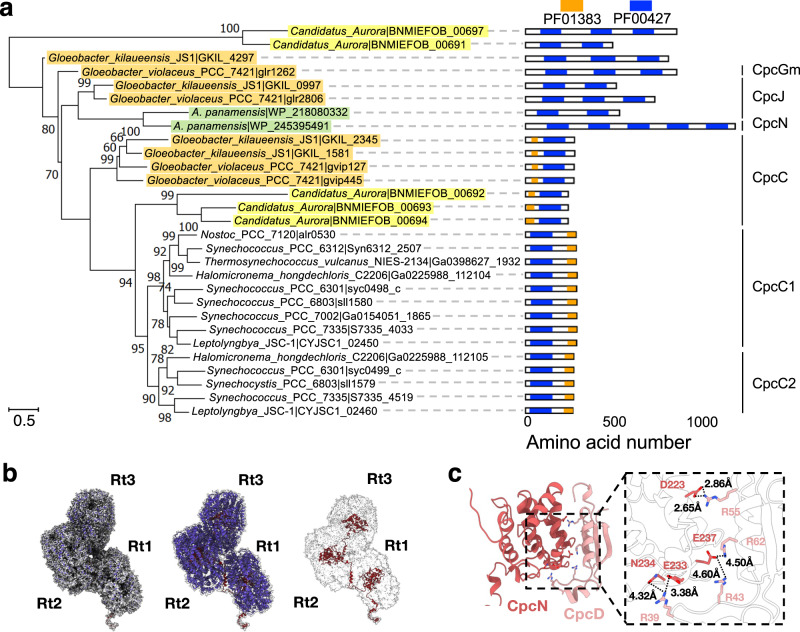
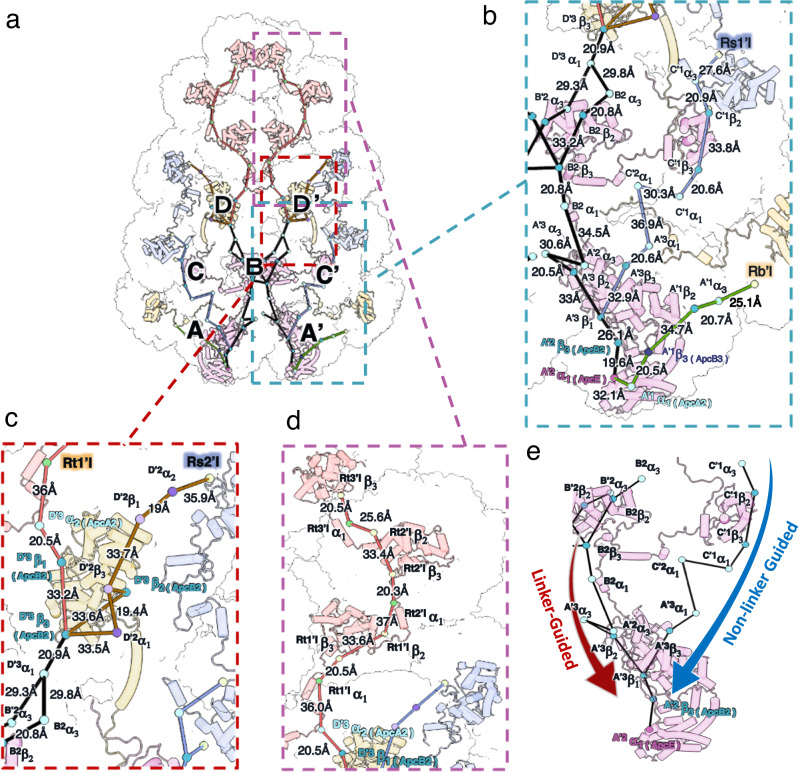
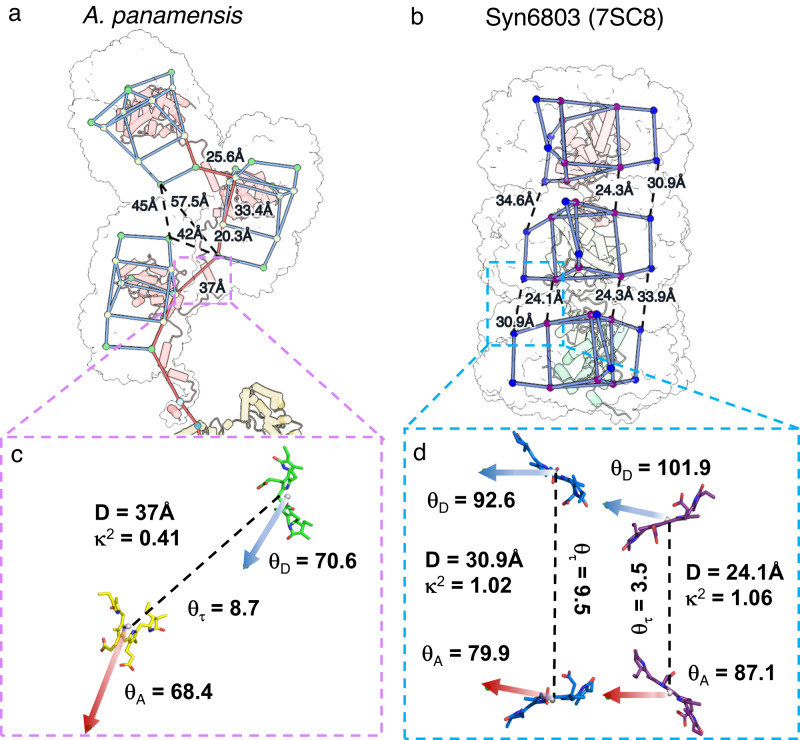
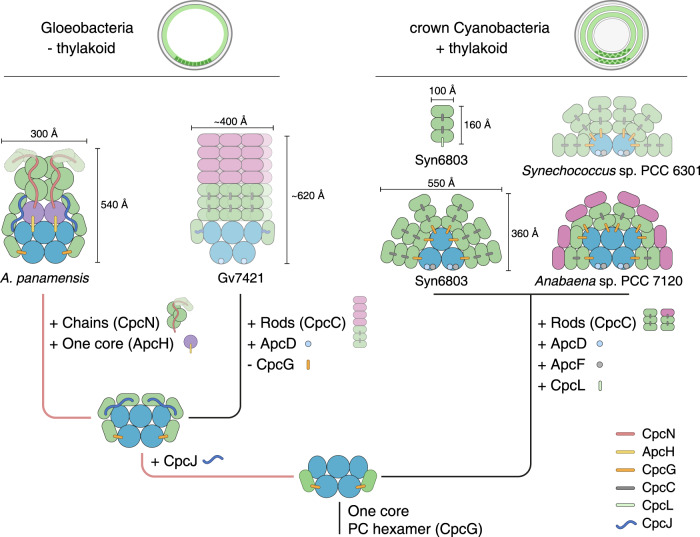
Phycobilisomes (PBS) are antenna megacomplexes that transfer energy to photosystems II and I in thylakoids. PBS likely evolved from a basic, inefficient form into the predominant hemidiscoidal shape with radiating peripheral rods. However, it has been challenging to test this hypothesis because ancestral species are generally inaccessible. Here we use spectroscopy and cryo-electron microscopy to reveal a structure of a "paddle-shaped" PBS from a thylakoid-free cyanobacterium that likely retains ancestral traits. This PBS lacks rods and specialized ApcD and ApcF subunits, indicating relict characteristics. Other features include linkers connecting two chains of five phycocyanin hexamers (CpcN) and two core subdomains (ApcH), resulting in a paddle-shaped configuration. Energy transfer calculations demonstrate that chains are less efficient than rods. These features may nevertheless have increased light absorption by elongating PBS before multilayered thylakoids with hemidiscoidal PBS evolved. Our results provide insights into the evolution and diversification of light-harvesting strategies before the origin of thylakoids.


Conflict of interest statement

The authors declare no competing interests.

Figures

Fig. 1
Fig. 1. The phylogeny of cyanobacteria and characterization of PBP and PBS from A. panamensis.
a A dated phylogeny of cyanobacteria redrawn from Rahmatpour et al. 2021. b Sucrose gradient centrifugation separates PBP and PBS into three fractions. c Room temperature absorbance spectra of the three fractions indicated in b; the inset shows the different absorbance maxima of the fractions. d Room temperature and e low-temperature (77 K) fluorescence emission spectra of the three fractions indicated in b. The excitation wavelength was 580 nm in d, e. All the spectra were normalized based on their maximal values. f SDS-PAGE of fraction Ap-3 stained with Coomassie Blue G-250. Protein mass standards (kDa) are indicated on the left. The numbers on the right side of the gel indicate proteins identified by in-gel trypsin digestion and LC-MS/MS analysis. For bands 7, 8, and 10, the major proteins identified are listed sequentially on the right of the gel based on their relative abundance. Three biological replicates were performed, and a representative result is shown. Source data are provided as a Source Data file.
Fig. 2
Fig. 2. Overall structure of the PBS complex viewed in electron micrographs of cell sections and isolated complexes.
a, b Representative TEM images of A. panamensis. The white arrows indicate the paddle-shaped particles (front view), and the black arrows indicate the rod-shaped particles (side view) attach to the cytoplasmic membrane. P polyphosphate granules, CM cytoplasmic membrane. Representative TEM images of the PBS isolated from Gv7421 (c), Synechocystis sp. PCC 6803 (Syn6803) (d), and A. panamensis (e). ae The images were collected from three biological replicates, which showed similar results. fi The cryo-EM map of A. panamensis PBS complex from two perpendicular views. Front (f, h), Side (g, i) views. Structures of the heptacylindrical PBS core are shown in surface representation in front view (j), side view (k), bottom view (l), and top view (m), respectively.
Fig. 3
Fig. 3. Schematic models of the A. panamensis PBS.
a The illustration of the PBS complex assembly. PBP subunits and linkers are shown in cartoon representation and separately colored. The four PC hexamers in the top two chains (Rt4/Rt4’ and Rt5/Rt5’) with low resolution in the cryo-EM map were only shown in this cartoon representation with dashed lines and faint colors. b Positions of linker proteins are shown in the cryo-EM map.
Fig. 4
Fig. 4. Core linker protein phylogeny and PBP subunit assembly in core hexamers.
a The maximum likelihood phylogenetic trees constructed using the full-length ApcE or ApcH protein sequences from Gloeobacter spp. (orange), Aurora (yellow), A. panamensis (green), and crown Cyanobacteria (unhighlighted). Bootstrap values are presented on the tree nodes; only the values higher than 50 are shown. The scale bars indicate substitutions per site. b The structural comparison shows the subunit distributions in the core between A. panamensis (left) and Anabaena sp. PCC 7120 (right) are very similar. One ApcB2 (β3 in A'2 trimer) and one ApcA2 (α1 in A'1 trimer) in A. panamensis are spatially equivalent to ApcF (in A'3 trimer) and ApcD (in A'4 trimer) of Anabaena sp. PCC 7120, respectively. The PBP subunits are shown in cylinders representation.
Fig. 5
Fig. 5. Phylogenetic relationship of the PC hexamer linker proteins and the role of CpcN in connecting PC hexamers.
a The maximum likelihood phylogenetic trees constructed using the full-length protein sequences of PC hexamer linker proteins from Gloeobacter spp. (orange), Aurora (yellow), A. panamensis (green), and crown Cyanobacteria (unhighlighted). Bootstrap values are presented on the tree nodes; only the values higher than 50 are shown. The scale bars indicate substitutions per site. b CpcN linker connects PC hexamers. Because the Rt4 and Rt5 PC hexamers are too dynamic, the cryo-EM density map focuses on the inner three PC hexamers (Rt1-3) (left). The corresponding atomic models of PC hexamer (middle) and CpcN (right) are colored in blue and deep red. c The interaction between CpcN linker and CpcD in Rt1. The corresponding atomic models of CpcN and CpcD are shown as cartoon representations. The zoom-in view shows the close interaction of CpcN and CpcD. The residues involved in the interactions are labeled, and the corresponding interaction distances are shown.
Fig. 6
Fig. 6. Plausible excitation energy transfer (EET) pathways.
Key bilins and corresponding linker proteins in the EET pathways based on the shortest bilin distances are shown as dots and cartoon diagrams, respectively. Each bilin’s 10th C atom (the central carbon between the rings B and C of the bilin) is shown as a dot. Dots are colored according to their protein subunits, as shown in Fig. 2h, and bilin distances were calculated based on the positions of dots. a Four identified pathways originated from PC are colored orange, brown, cyan, and green, respectively. The pathways in the core are shown as black lines. The bilins with the corresponding proteins and distances are labeled. The enlarged views of the EET pathways b, from the side PC hexamers to the core, c, from the top two cores to the pentacylindrical core, and d, from the top PC chains to the top two cores. e Both linker-guided and non-linker-guided EET routes are shown in the pentacylindrical core.
Fig. 7
Fig. 7. Comparison of EET pathways within PC chains and rods.
The key bilins and linker proteins are shown as dots and cartoon diagrams. The colored dots represent the position of 10th C atom of bilins. The outlines of individual hexamers are shown. a APC chain of A. panamensis (this study) packs on the sides asymmetrically, resulting in one preferable inner-chain EET pathway. b APC rod of Syn6803 (PDB ID: 7SC8) stacks symmetrically, allowing an inner-rod EET network. Blue and red dots represent the bilins in α subunit and the β subunit, respectively. The calculated orientation factors (κ2) of the donor and the acceptor PCBs between PC hexamers are shown in c, for PC chains and in d, for PC rods. The transition dipole moments of the donor and the acceptor are shown as μD (blue arrow) and μA (red arrow), respectively. D represents the distance between the 10th C atom of the donor and the acceptor. θD and θA are the angles between the donor–acceptor connecting line and μD and μA, respectively. θτ is the angle between μD and μA. See Methods and Supplementary Fig. 16 for the details of the calculations.
Fig. 8
Fig. 8. Proposed model for the evolution of PBS.
For clarity, the hypothesized stages preceding the formation of a pentacylindrical core and PC hexamer have been omitted from this figure. The occurrence and disappearance of PBS features are shown as plus and minus signs, respectively. Thylakoid-free cyanobacteria (Gv7421 and A. panamensis) have an electron-dense layer (light green) on the inner surface of the plasma membrane. The inner layers in Syn6803 represent the thylakoid membranes in the cytoplasm. Elongated and hemidiscodial PBS are shown by the green rectangles and semicircles, respectively. Core cylinders are colored in purple and bright blue. PE hexamers (Gv7421) and phycoerythrocyanin hexamers (Anabaena sp. PCC 7120) are colored in pink, and PC hexamers are colored in green. The PBS from Gv7421 and Synechococcus sp. PCC 6301 were drawn in faint colors, and the linker CpcGm (glr1262) was not shown because the PBS high-resolution structures from these two strains were not resolved,–. The fourth and fifth PC hexamers in the paddle-shaped PBS were also colored lightly because their resolutions were not high in the cryo-EM map. The sizes of PBS are presented based on Fig. 2 and previous studies,,,. Dr. Ying Wang, an illustrator, has redrawn this model to enhance the visual quality of the image.

Similar articles

Cited by

References

    1. Sanchez-Baracaldo P, Cardona T. On the origin of oxygenic photosynthesis and Cyanobacteria. New Phytol. 2020;225:1440–1446. doi: 10.1111/nph.16249. - DOI - PubMed
    1. Mangan NM, Flamholz A, Hood RD, Milo R, Savage DF. pH determines the energetic efficiency of the cyanobacterial CO2 concentrating mechanism. Proc. Natl. Acad. Sci. U.S.A. 2016;113:E5354–E5362. doi: 10.1073/pnas.1525145113. - DOI - PMC - PubMed
    1. Overmann, J. & Garcia-Pichel, F. in The Prokaryotes: Prokaryotic Communities and Ecophysiology (eds E. Rosenberg et al.) 203–257 (Springer Berlin Heidelberg, 2013).
    1. Sidler, W. A. in The Molecular Biology of Cyanobacteria In: Advances in Photosynthesis, Vol. 1 (ed D. A. Bryant) 139–216 (Springer Netherlands, 1994).
    1. Sui S-F. Structure of phycobilisomes. Annu. Rev. Biophys. 2021;50:53–72. doi: 10.1146/annurev-biophys-062920-063657. - DOI - PubMed

MeSH terms